Downloaded 59 times


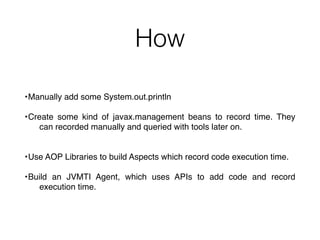
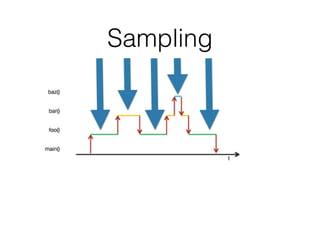
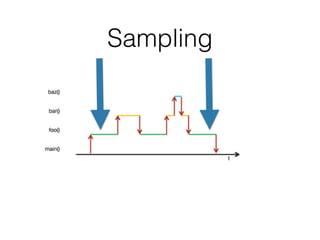
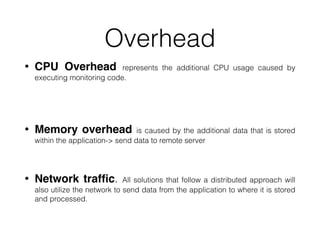
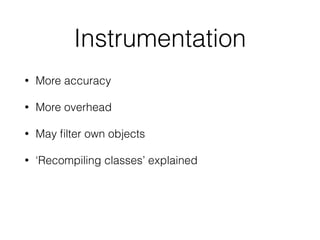
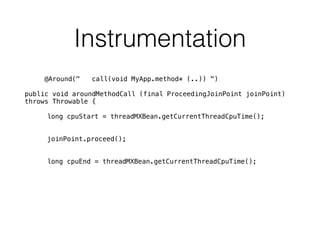
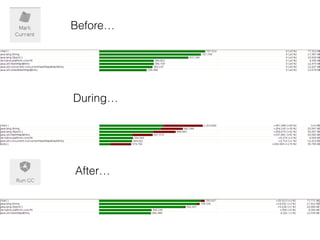
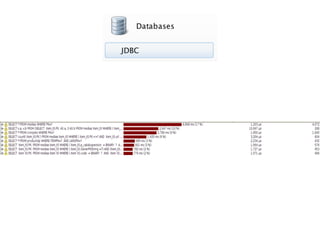

This document provides an introduction to JProfiler and discusses various techniques for profiling Java applications, including bytecode instrumentation, sampling profiling, and Java Management Extensions (JMX). It describes methods like manually adding print statements, using aspects, creating JMX beans, and using the JVM Tool Interface (JVMTI). The document also covers topics like overhead of profiling, hashcodes, equal methods, and examples of using instrumentation and sampling in profiling tools.


![20260201 [FOSDEM] gomodjail - library sandboxing for Go modules.pdf](https://cdn.slidesharecdn.com/ss_thumbnails/20260201fosdemgomodjail-librarysandboxingforgomodules-260201225659-76609ec4-thumbnail.jpg?width=640&height=640&fit=bounds)


