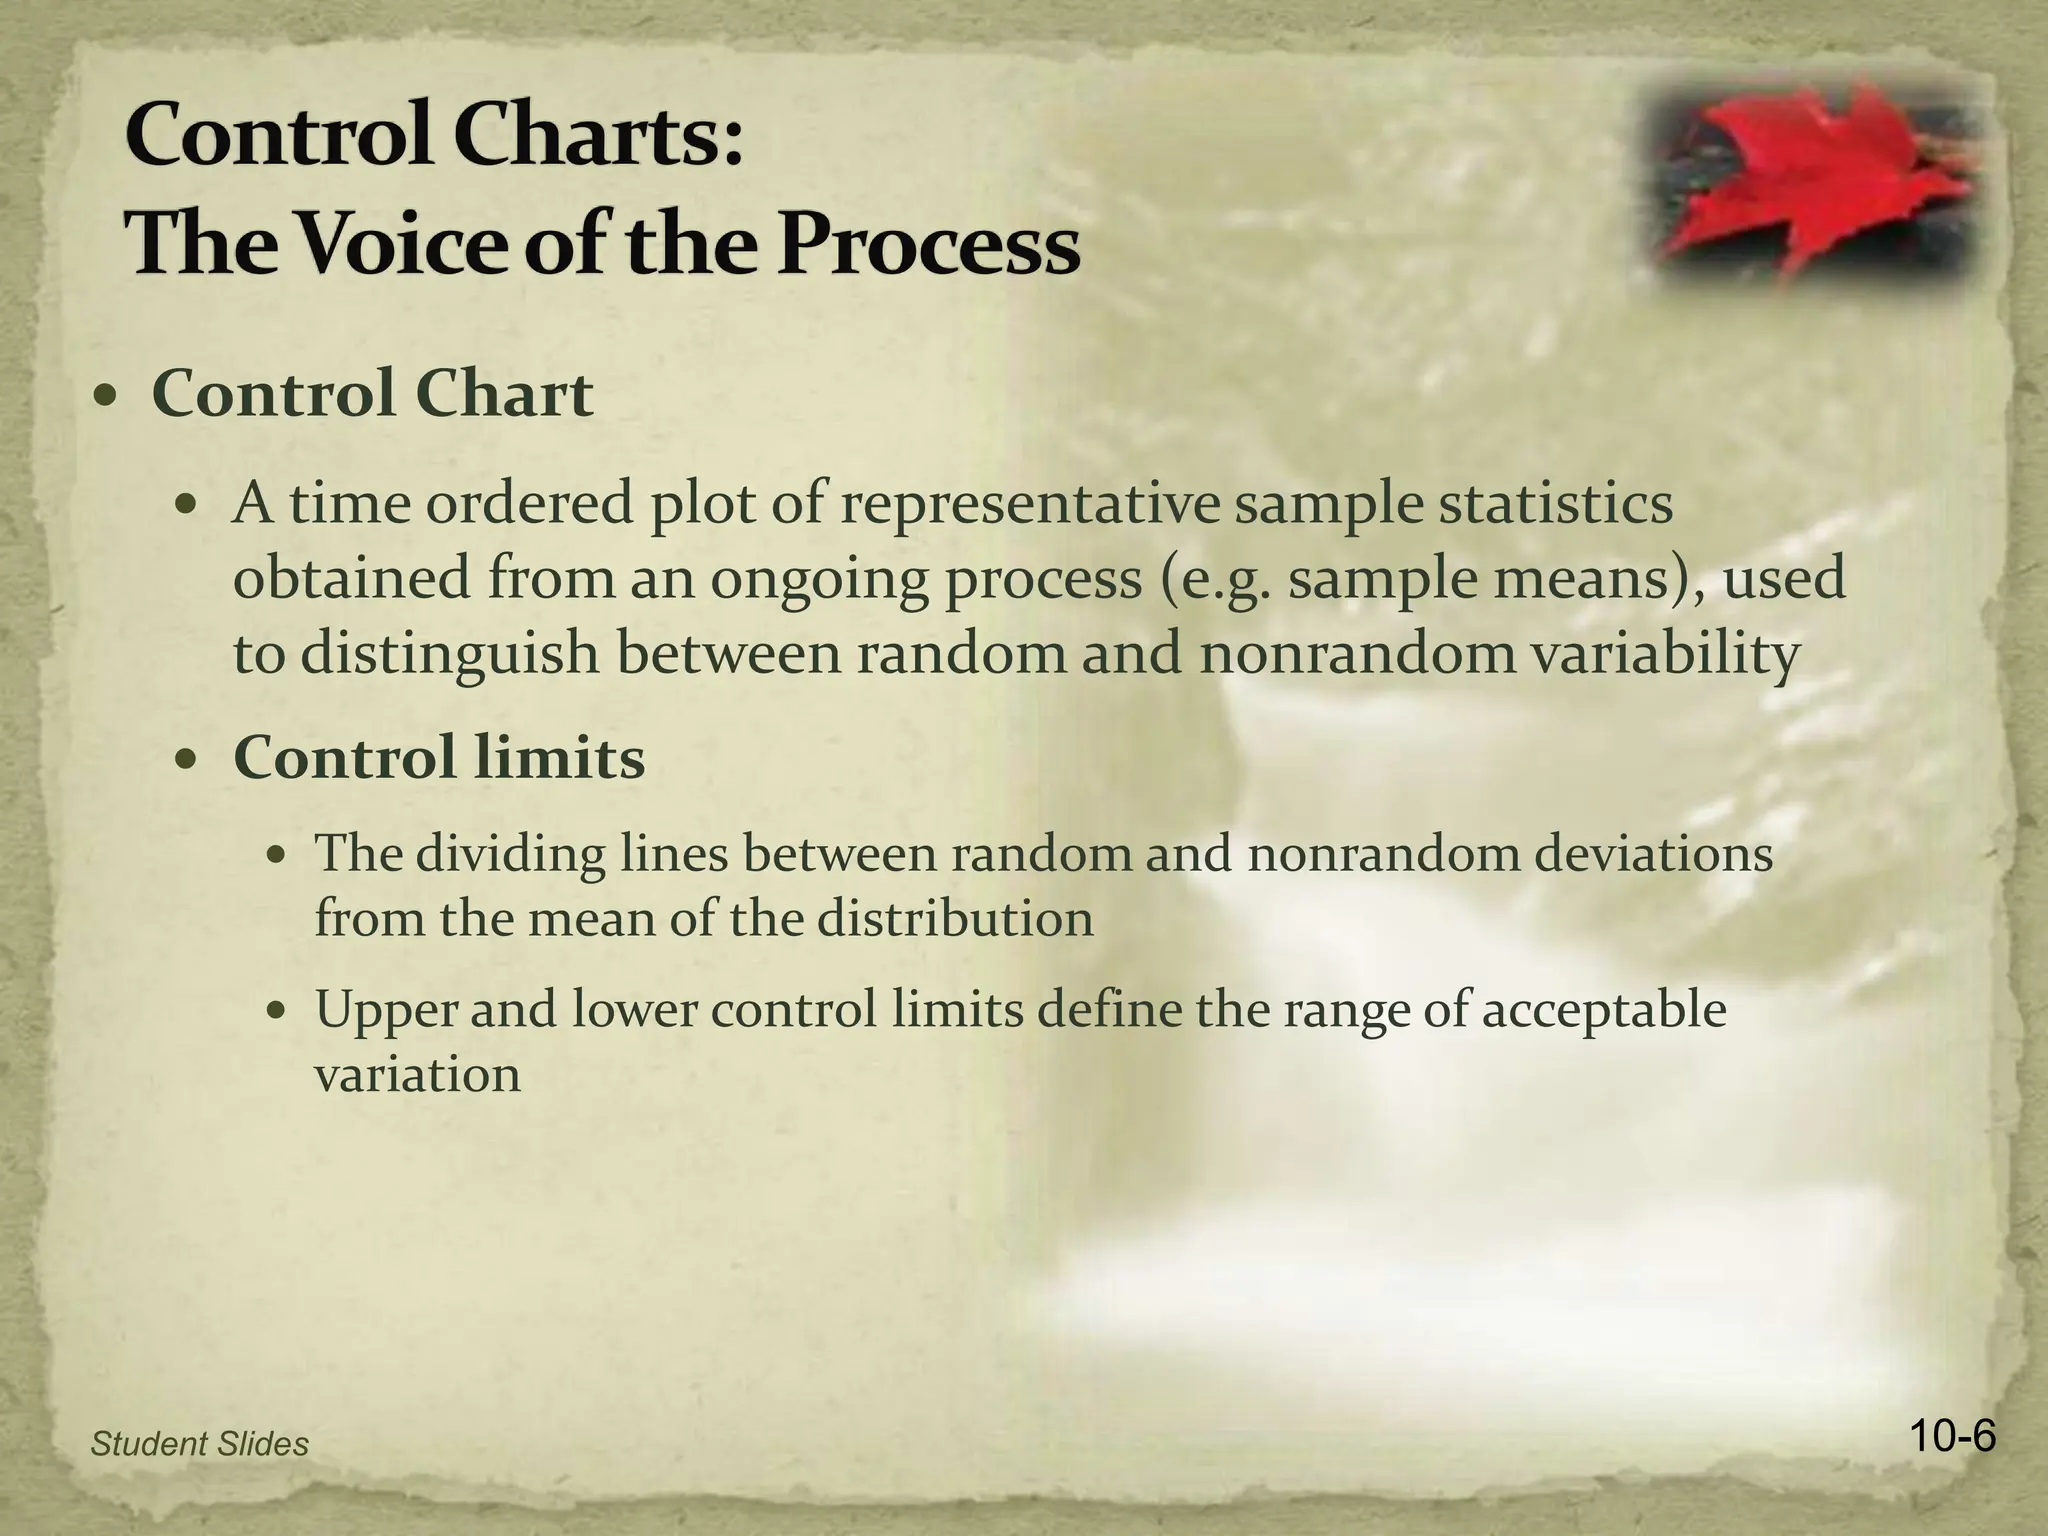
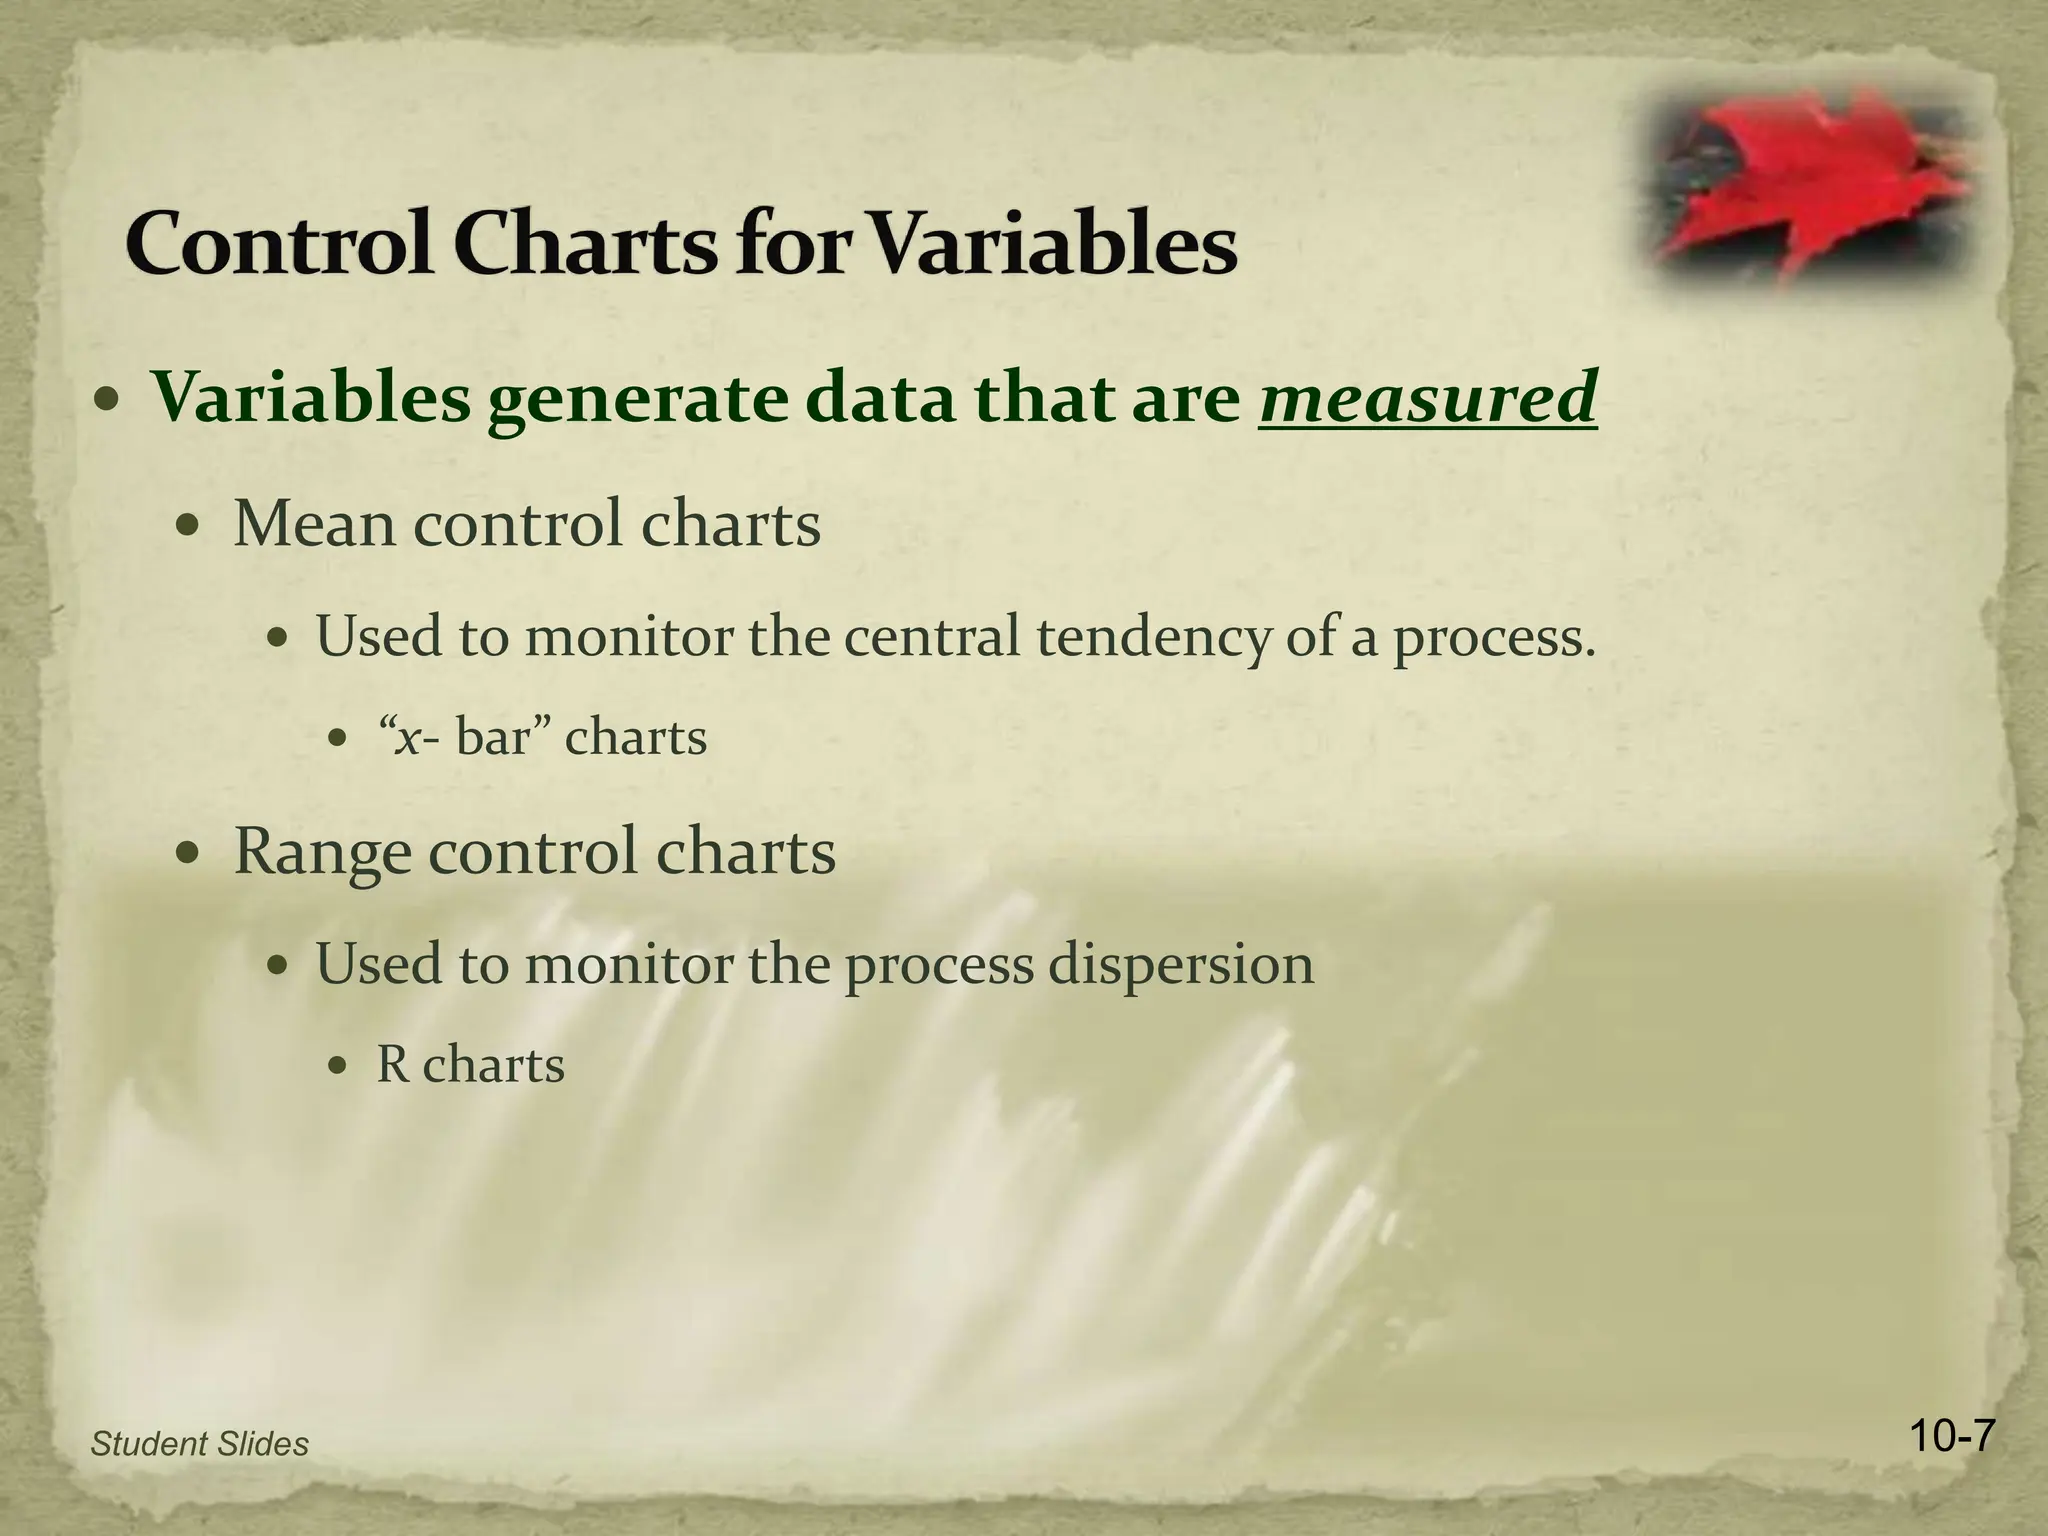
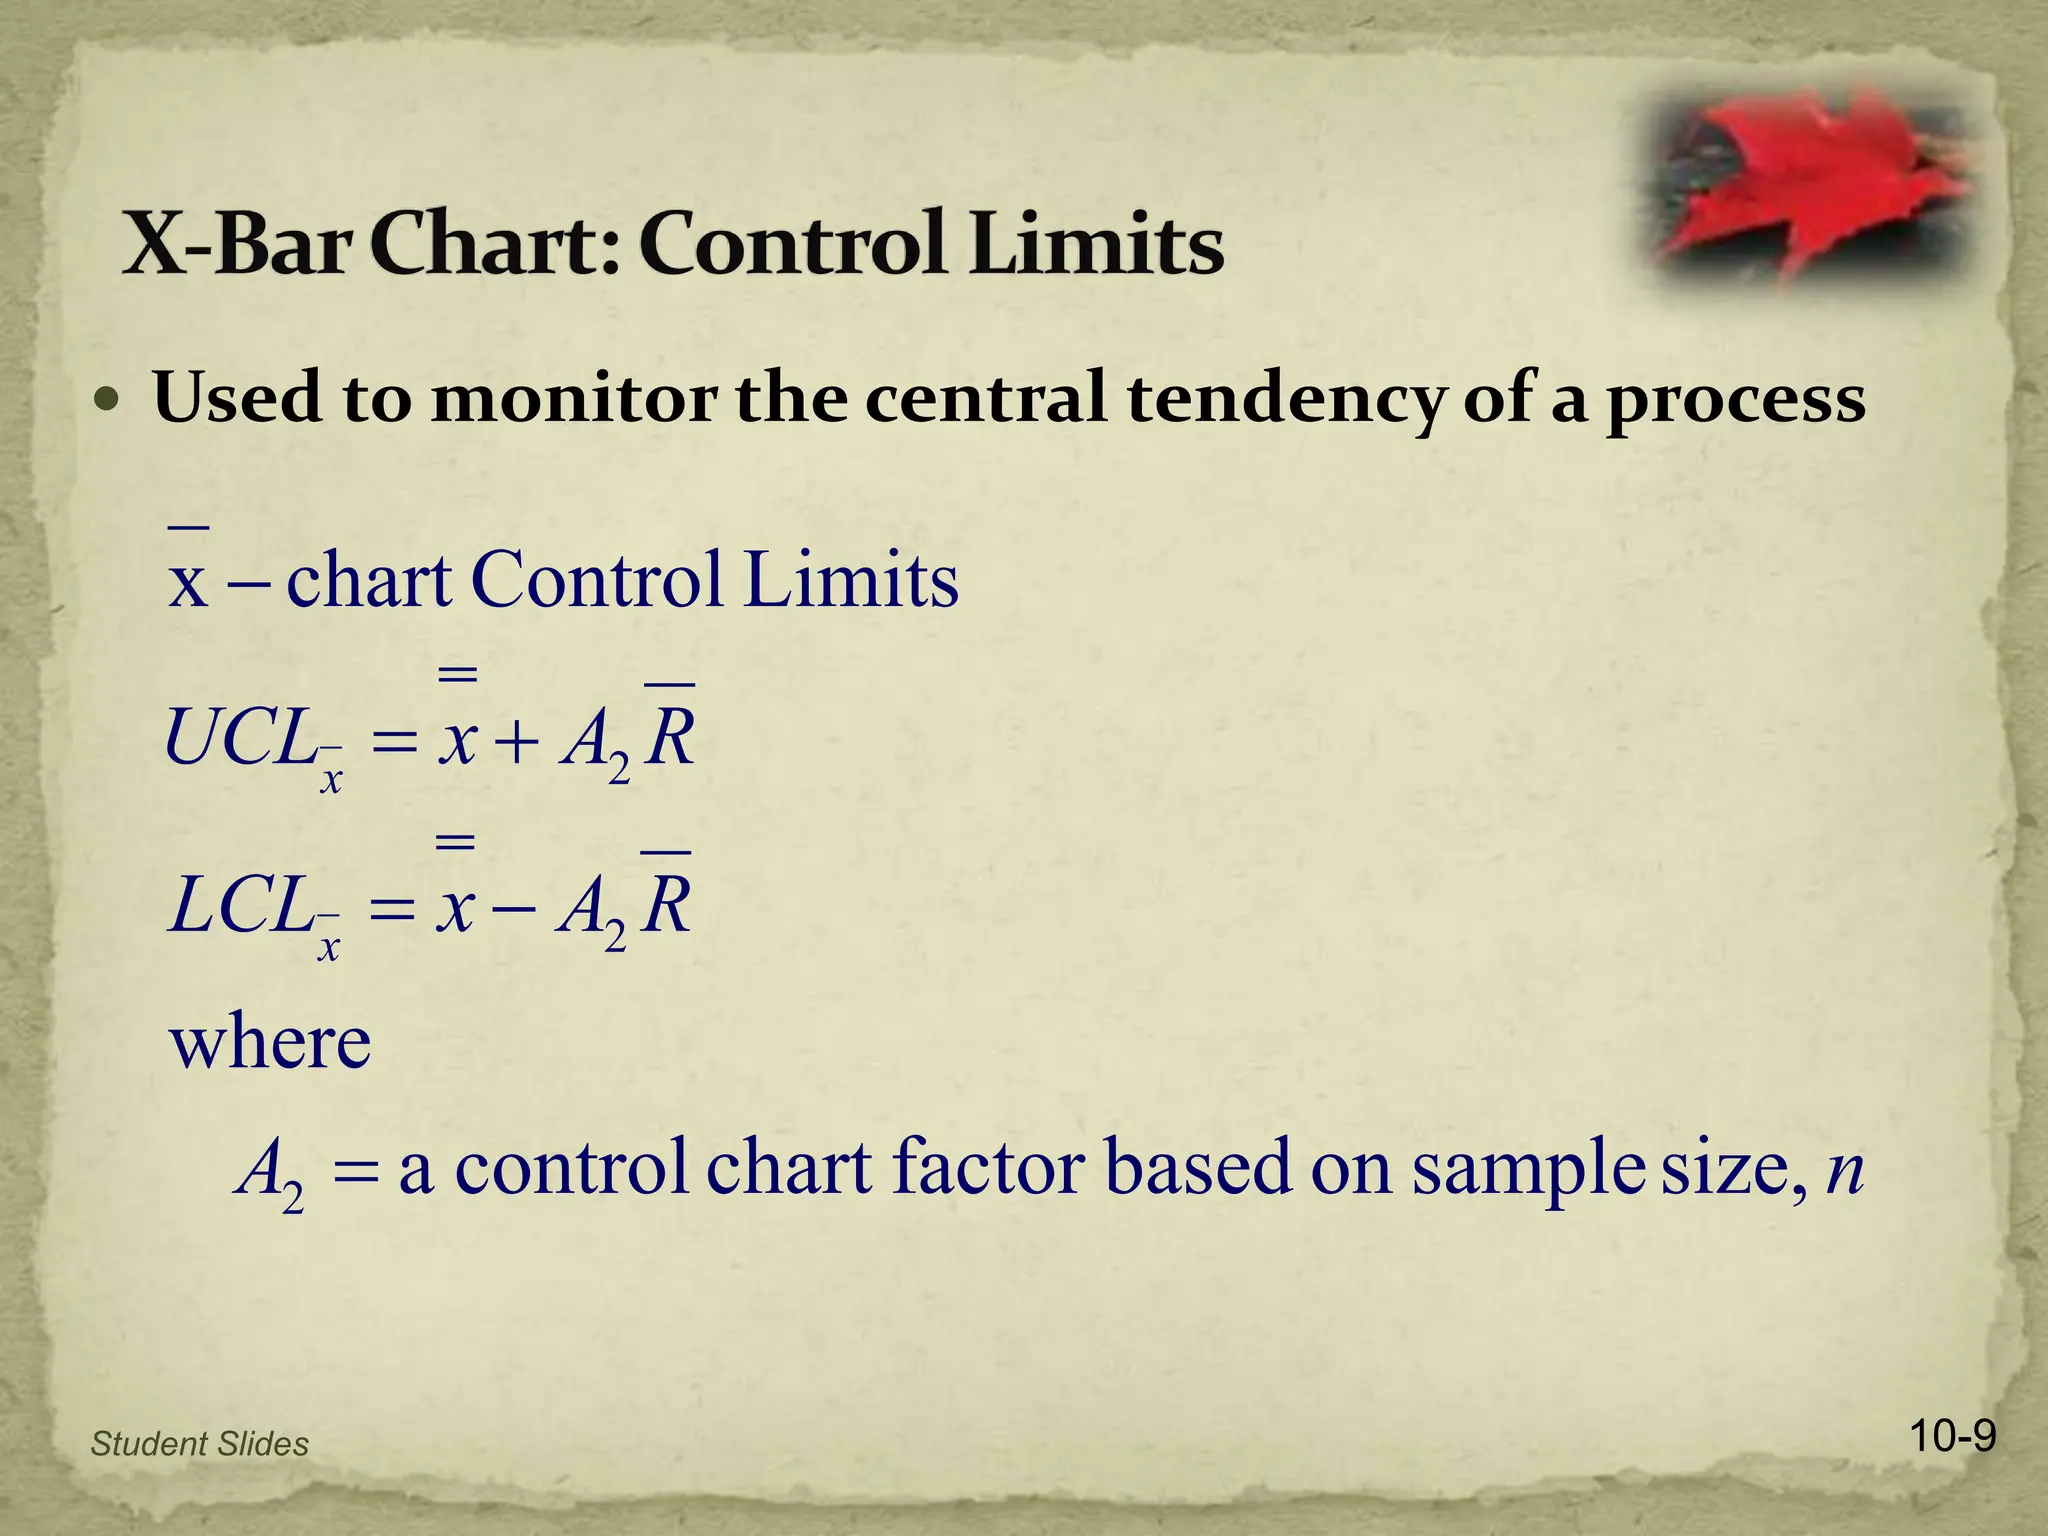
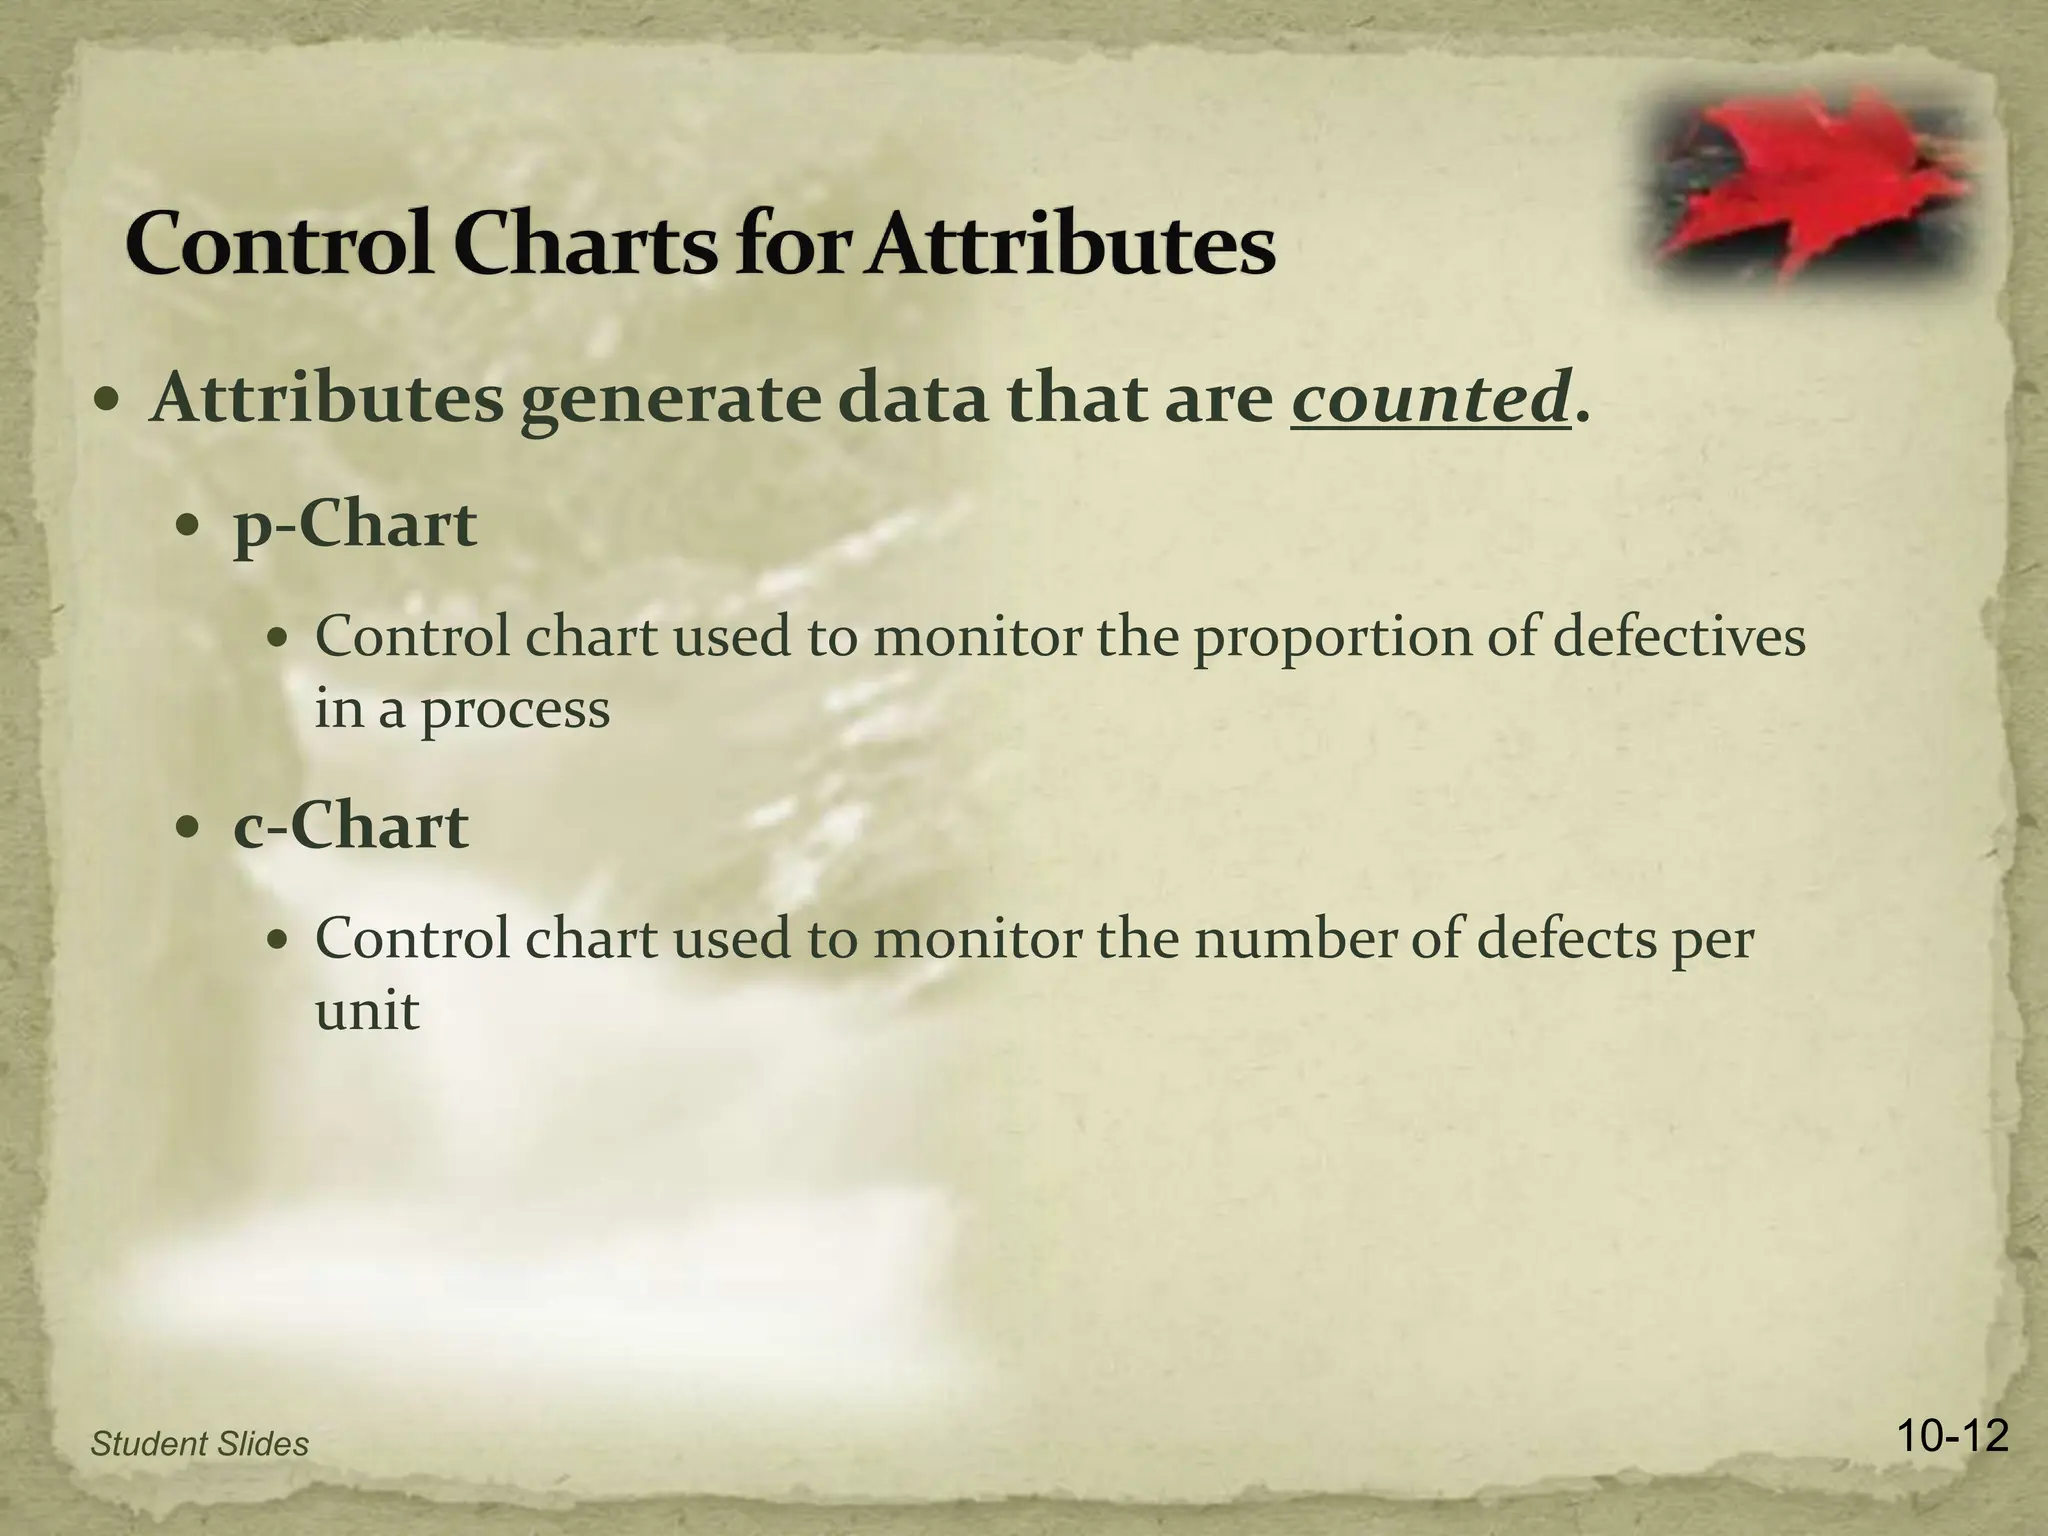
Quality Control
McGraw-Hill/Irwin
Copyright © 2012 by The McGraw-Hill Companies, Inc. All rights reserved.
 You should be able to:
1. List and briefly explain the elements in the control process
2. Explain how control charts are used to monitor a process, and
the concepts that underlie their use
3. Use and interpret control charts
4. Perform run tests to check for nonrandomness in process output
5. Assess process capability
Student Slides 10-2
 Quality Control
 A process that evaluates output relative to a standard
and takes corrective action when output doesn’t meet
standards
 If results are acceptable no further action is required
 Unacceptable results call for correction action
Student Slides 10-3
 Inspection
 An appraisal activity that compares goods or services to
a standard
 Inspection issues:
1. How much to inspect and how often
2. At what points in the process to inspect
3. Whether to inspect in a centralized or on-site location
4. Whether to inspect attributes or variables
Student Slides 10-4
 Quality control seeks
 Quality of Conformance
 A product or service conforms to specifications
 A tool used to help in this process:
 SPC
 Statistical evaluation of the output of a process
 Helps us to decide if a process is “in control” or if corrective
action is needed
Student Slides 10-5
 Control Chart
 A time ordered plot of representative sample statistics
obtained from an ongoing process (e.g. sample means), used
to distinguish between random and nonrandom variability
 Control limits
 The dividing lines between random and nonrandom deviations
from the mean of the distribution
 Upper and lower control limits define the range of acceptable
variation
10-6
Student Slides
 Variables generate data that are measured
 Mean control charts
 Used to monitor the central tendency of a process.
 “x- bar” charts
 Range control charts
 Used to monitor the process dispersion
 R charts
10-7
Student Slides
samples
of
number
sample
of
mean
means
sample
of
Average
where
1






k
i
x
x
k
x
x
i
k
i
i
i
R
k
R
i
k
i
i
sample
of
Range
ranges
sample
of
Average
R
where
R 1





Student Slides 10-8
 Used to monitor the central tendency of a process
n
A
R
A
x
LCL
R
A
x
UCL
x
x
size,
sample
on
based
factor
chart
control
a
where
Limits
Control
chart
x
2
2
2






Student Slides 10-9
 Used to monitor process dispersion
n
D
n
D
R
D
LCL
R
D
UCL
R
R
size,
sample
on
based
factor
chart
control
a
size,
sample
on
based
factor
chart
control
a
where
Limits
Control
Chart
R
4
3
3
4




Student Slides 10-10
Student Slides 10-11
 Attributes generate data that are counted.
 p-Chart
 Control chart used to monitor the proportion of defectives
in a process
 c-Chart
 Control chart used to monitor the number of defects per
unit
10-12
Student Slides
 Once a process has been determined to be stable, it is
necessary to determine if the process is capable of
producing output that is within an acceptable range
 Tolerances or specifications
 Range of acceptable values established by engineering design or
customer requirements
 Process variability
 Natural or inherent variability in a process
 Process capability
 The inherent variability of process output (process width) relative
to the variation allowed by the design specification (specification
width)
10-13
Student Slides
Student Slides 10-14
 Quality is a primary consideration for nearly all
customers
 Achieving and maintaining quality standards is of
strategic importance to all business organizations
 Product and service design
 Increase capability in order to move from extensive use of
control charts and inspection to achieve desired quality
outcomes
Student Slides 10-15

Chap0 10.pptx

  • 1.
    Quality Control McGraw-Hill/Irwin Copyright ©2012 by The McGraw-Hill Companies, Inc. All rights reserved.
  • 2.
     You shouldbe able to: 1. List and briefly explain the elements in the control process 2. Explain how control charts are used to monitor a process, and the concepts that underlie their use 3. Use and interpret control charts 4. Perform run tests to check for nonrandomness in process output 5. Assess process capability Student Slides 10-2
  • 3.
     Quality Control A process that evaluates output relative to a standard and takes corrective action when output doesn’t meet standards  If results are acceptable no further action is required  Unacceptable results call for correction action Student Slides 10-3
  • 4.
     Inspection  Anappraisal activity that compares goods or services to a standard  Inspection issues: 1. How much to inspect and how often 2. At what points in the process to inspect 3. Whether to inspect in a centralized or on-site location 4. Whether to inspect attributes or variables Student Slides 10-4
  • 5.
     Quality controlseeks  Quality of Conformance  A product or service conforms to specifications  A tool used to help in this process:  SPC  Statistical evaluation of the output of a process  Helps us to decide if a process is “in control” or if corrective action is needed Student Slides 10-5
  • 6.
     Control Chart A time ordered plot of representative sample statistics obtained from an ongoing process (e.g. sample means), used to distinguish between random and nonrandom variability  Control limits  The dividing lines between random and nonrandom deviations from the mean of the distribution  Upper and lower control limits define the range of acceptable variation 10-6 Student Slides
  • 7.
     Variables generatedata that are measured  Mean control charts  Used to monitor the central tendency of a process.  “x- bar” charts  Range control charts  Used to monitor the process dispersion  R charts 10-7 Student Slides
  • 8.
  • 9.
     Used tomonitor the central tendency of a process n A R A x LCL R A x UCL x x size, sample on based factor chart control a where Limits Control chart x 2 2 2       Student Slides 10-9
  • 10.
     Used tomonitor process dispersion n D n D R D LCL R D UCL R R size, sample on based factor chart control a size, sample on based factor chart control a where Limits Control Chart R 4 3 3 4     Student Slides 10-10
  • 11.
  • 12.
     Attributes generatedata that are counted.  p-Chart  Control chart used to monitor the proportion of defectives in a process  c-Chart  Control chart used to monitor the number of defects per unit 10-12 Student Slides
  • 13.
     Once aprocess has been determined to be stable, it is necessary to determine if the process is capable of producing output that is within an acceptable range  Tolerances or specifications  Range of acceptable values established by engineering design or customer requirements  Process variability  Natural or inherent variability in a process  Process capability  The inherent variability of process output (process width) relative to the variation allowed by the design specification (specification width) 10-13 Student Slides
  • 14.
  • 15.
     Quality isa primary consideration for nearly all customers  Achieving and maintaining quality standards is of strategic importance to all business organizations  Product and service design  Increase capability in order to move from extensive use of control charts and inspection to achieve desired quality outcomes Student Slides 10-15