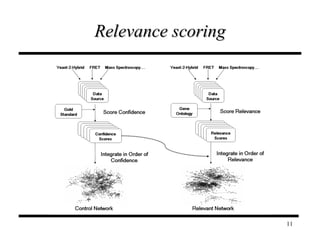
Integration of Full-Coverage Probabilistic Functional Networks with Relevance to Specific Biological Processes   James, K., Wipat, A. & Hallinan, J. School of Computing Science, Newcastle University Data Integration in the Life Sciences 2009
Integrated functional networks Bring together data from a wide range of sources High throughput data is  Large (one node per gene; multiple interactions per node) noisy   (FP 20 – 90%)  Incomplete (to different extents) Assess quality of each dataset against a Gold Standard Weighted edges reflect sum probability that edge actually exists Network can be thresholded to draw attention to most probable edges Suitable for manual (interactive) or computational analysis
Dataset bias Different experiment types provide different types of information Overlap between datasets usually low 1% of synthetic lethal pairs physically interact Genes involved in the same process may be transcribed together Ribosomal biogenesis in yeast Some types of interaction may provide more information about a particular biological process Complex formation: Y2H Signal transduction: phosphorylation
Bias in HTP datasets From  Myers and Troyanskaya, Bioinformatics 2007.
Bias & Relevance Most network analyses are related to a Process of Interest (PoI) PFINs tend to be very large Interactions with equal probability will have different utility Several attempts to eliminate bias Loss of data We aim to  use  bias  Relevance
Hypothesis Functional annotations can be applied to probabilistic integrated functional networks to identify interactions relevant to a biological process of interest
Network integration
Network integration
Effect of D value
Relevance scoring GO annotations One-tailed Fisher’s exact test to score over-representation of genes related to POI POI: term of interest plus any descendants except  inferred from electronic annotation Control network integrated in order of confidence Relevance network integrated in order of relevance We use Lee  et al.  (2004), but method can be applied to any network, any data integration algorithm
Relevance scoring
Data sets Saccharomyces cerevisiae  data from BioGRID v.38 Split by PMID, duplicates removed Datasets > 100 interactions treated individually 50 data sets, max 14,421 interactions Datasets < 100 grouped by BioGRID Experimental categories 22 data sets, min 33 interactions Gene Ontology terms  Telomere Maintenance (GO:0000723) Ageing (GO:0007568)
Choice of D value GO annotations Assign function to nodes based on annotation of neighbour with highest weighted edge Leave-one-out on full network Construct Receiver Operating Characteristic (ROC) curve Area Under Curve (AUC) SE(W) using Wilcoxon statistic
Classifier output classification threshold positives negatives TP TN FP FN Increasing specificity Increasing sensitivity
ROC Curves
D value
D value
Ranking 3 3 2 8 4.2253   8 1 1 1 7 4.4641   7 7 8 5 6 4.5212   6 5 5 7 5 4.9335   5 4 4 3 4 5.0842   4 2 2 6 3 5.7040   3 8 7 8 2 5.7054   2 6 6 4 1 6.6937   1 A&T Rank Telomere Rank Ageing Rank Conf. Rank Conf. Score Dataset
Results
Evaluation - Clustering MCL Markov-based clustering algorithm Considers network topology and edge weights
Results 38.35 33.33 29.83 24.67 523 R 37.98 33.80 29.55 24.26 573 C C 8.59 8.90 7.73 6.50 508 R 6.53 7.02 6.14 5.06 573 C T 36.92 31.75 27.73 22.37 523 R 35.19 28.86 26.14 21.29 573 C A >4 nodes >3 nodes >2 nodes % COI Clusters Bias Net
Cluster annotation
Conclusions Function assignment is statistically significantly better, but probably not practically useful Simplistic algorithm Dependant upon existing annotation Clustering Fewer, larger clusters Clusters draw together genes of interest Different GO terms perform differently Relevance networks are better for interactive exploration Related PoIs
Future work Which GO terms work best with relevance? Why? Further exploration of experimental types and relevance Implement algorithms in Ondex Optimize function assignment / clustering algorithms Extend technique to edges
Acknowledgements Centre for Integrated Systems Biology of Ageing and Nutrition (CISBAN) Newcastle Systems Biology Resource Centre Research Councils of the UK BBSRC SABR Ondex Project Integrative Bioinformatics Research Group

probabilistic ranking

  • 1.
    Integration of Full-CoverageProbabilistic Functional Networks with Relevance to Specific Biological Processes James, K., Wipat, A. & Hallinan, J. School of Computing Science, Newcastle University Data Integration in the Life Sciences 2009
  • 2.
    Integrated functional networksBring together data from a wide range of sources High throughput data is Large (one node per gene; multiple interactions per node) noisy (FP 20 – 90%) Incomplete (to different extents) Assess quality of each dataset against a Gold Standard Weighted edges reflect sum probability that edge actually exists Network can be thresholded to draw attention to most probable edges Suitable for manual (interactive) or computational analysis
  • 3.
    Dataset bias Differentexperiment types provide different types of information Overlap between datasets usually low 1% of synthetic lethal pairs physically interact Genes involved in the same process may be transcribed together Ribosomal biogenesis in yeast Some types of interaction may provide more information about a particular biological process Complex formation: Y2H Signal transduction: phosphorylation
  • 4.
    Bias in HTPdatasets From Myers and Troyanskaya, Bioinformatics 2007.
  • 5.
    Bias & RelevanceMost network analyses are related to a Process of Interest (PoI) PFINs tend to be very large Interactions with equal probability will have different utility Several attempts to eliminate bias Loss of data We aim to use bias Relevance
  • 6.
    Hypothesis Functional annotationscan be applied to probabilistic integrated functional networks to identify interactions relevant to a biological process of interest
  • 7.
  • 8.
  • 9.
  • 10.
    Relevance scoring GOannotations One-tailed Fisher’s exact test to score over-representation of genes related to POI POI: term of interest plus any descendants except inferred from electronic annotation Control network integrated in order of confidence Relevance network integrated in order of relevance We use Lee et al. (2004), but method can be applied to any network, any data integration algorithm
  • 11.
  • 12.
    Data sets Saccharomycescerevisiae data from BioGRID v.38 Split by PMID, duplicates removed Datasets > 100 interactions treated individually 50 data sets, max 14,421 interactions Datasets < 100 grouped by BioGRID Experimental categories 22 data sets, min 33 interactions Gene Ontology terms Telomere Maintenance (GO:0000723) Ageing (GO:0007568)
  • 13.
    Choice of Dvalue GO annotations Assign function to nodes based on annotation of neighbour with highest weighted edge Leave-one-out on full network Construct Receiver Operating Characteristic (ROC) curve Area Under Curve (AUC) SE(W) using Wilcoxon statistic
  • 14.
    Classifier output classificationthreshold positives negatives TP TN FP FN Increasing specificity Increasing sensitivity
  • 15.
  • 16.
  • 17.
  • 18.
    Ranking 3 32 8 4.2253 8 1 1 1 7 4.4641 7 7 8 5 6 4.5212 6 5 5 7 5 4.9335 5 4 4 3 4 5.0842 4 2 2 6 3 5.7040 3 8 7 8 2 5.7054 2 6 6 4 1 6.6937 1 A&T Rank Telomere Rank Ageing Rank Conf. Rank Conf. Score Dataset
  • 19.
  • 20.
    Evaluation - ClusteringMCL Markov-based clustering algorithm Considers network topology and edge weights
  • 21.
    Results 38.35 33.3329.83 24.67 523 R 37.98 33.80 29.55 24.26 573 C C 8.59 8.90 7.73 6.50 508 R 6.53 7.02 6.14 5.06 573 C T 36.92 31.75 27.73 22.37 523 R 35.19 28.86 26.14 21.29 573 C A >4 nodes >3 nodes >2 nodes % COI Clusters Bias Net
  • 22.
  • 23.
    Conclusions Function assignmentis statistically significantly better, but probably not practically useful Simplistic algorithm Dependant upon existing annotation Clustering Fewer, larger clusters Clusters draw together genes of interest Different GO terms perform differently Relevance networks are better for interactive exploration Related PoIs
  • 24.
    Future work WhichGO terms work best with relevance? Why? Further exploration of experimental types and relevance Implement algorithms in Ondex Optimize function assignment / clustering algorithms Extend technique to edges
  • 25.
    Acknowledgements Centre forIntegrated Systems Biology of Ageing and Nutrition (CISBAN) Newcastle Systems Biology Resource Centre Research Councils of the UK BBSRC SABR Ondex Project Integrative Bioinformatics Research Group