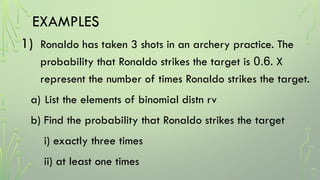
The document covers Chapter 8 on probability distribution, detailing discrete and continuous random variables, including binomial and normal distributions. It provides examples for calculating probabilities, means, variances, and standard deviations related to binomial and normal distributions. Additionally, it includes homework assignments for further practice.
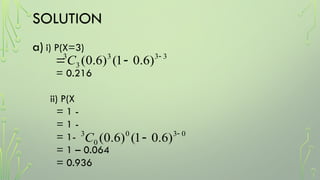
![a)P(X=3)
= 0.2903
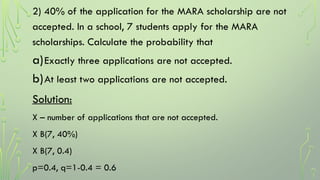
b)Probability at least two not accepted
1- P(X=0) + P(X=1)
=1- (0.0280 + 0.1306)
= 1- 0.1586
= 0. 8414
3
7
3
3
7
)
4
.
0
1
(
)
4
.
0
(
C
]
)
4
.
0
1
(
)
4
.
0
(
)
4
.
0
1
(
)
4
.
0
(
[
1 1
7
1
1
7
0
7
0
0
7
C
C](https://image.slidesharecdn.com/probdistn-241201135339-ab140f87/85/Prob-Distn-additional-mathematics-form-5-pptx-8-320.jpg)