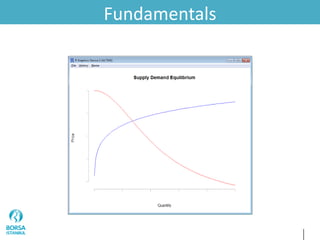
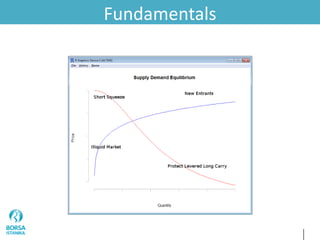
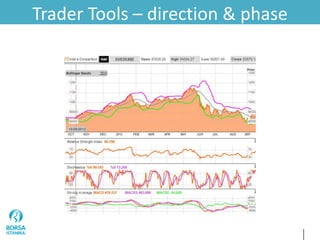
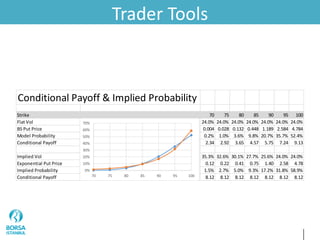
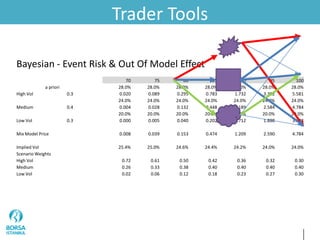
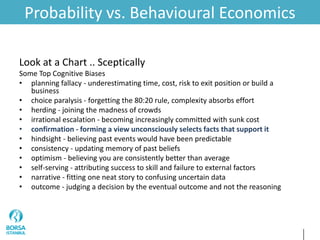
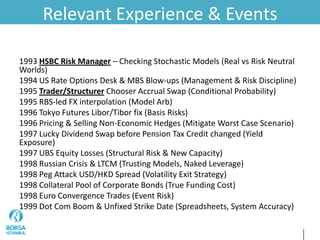
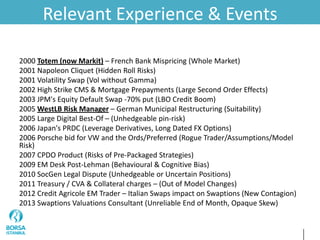
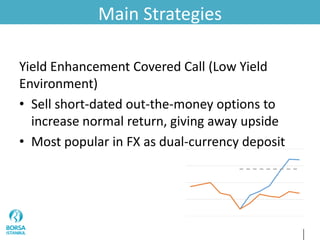
Derivatives
Market Practices
Option Trading
Strategies
Introduction
• Mathematician
• Exotic Fixed Income Options Trader * 6yrs
HSBC
• Option Consensus Valuations * 6yrs Totem
• Risk Manager & EM Local Market Trader 6yrs
WestLB
* indirect exposure to Long-dated OTC Equity Options
Fundamentals
Fundamentals
Trader Tools – direction & phase
Trader Tools
Conditional Payoff & Implied Probability
Strike 70 75 80 85 90 95 100
Flat Vol 24.0% 24.0% 24.0% 24.0% 24.0% 24.0% 24.0%
BS Put Price 0.004 0.028 0.132 0.448 1.189 2.584 4.784
Model Probability 0.2% 1.0% 3.6% 9.8% 20.7% 35.7% 52.4%
Conditional Payoff 2.34 2.92 3.65 4.57 5.75 7.24 9.13
Implied Vol 35.3% 32.6% 30.1% 27.7% 25.6% 24.0% 24.0%
Exponential Put Price 0.12 0.22 0.41 0.75 1.40 2.58 4.78
Implied Probability 1.5% 2.7% 5.0% 9.3% 17.2% 31.8% 58.9%
Conditional Payoff 8.12 8.12 8.12 8.12 8.12 8.12 8.12
0%
10%
20%
30%
40%
50%
60%
70%
70 75 80 85 90 95 100
Trader Tools
Bayesian - Event Risk & Out Of Model Effect
70 75 80 85 90 95 100
a priori 28.0% 28.0% 28.0% 28.0% 28.0% 28.0% 28.0%
High Vol 0.3 0.020 0.089 0.295 0.783 1.732 3.302 5.581
24.0% 24.0% 24.0% 24.0% 24.0% 24.0% 24.0%
Medium 0.4 0.004 0.028 0.132 0.448 1.189 2.584 4.784
20.0% 20.0% 20.0% 20.0% 20.0% 20.0% 20.0%
Low Vol 0.3 0.000 0.005 0.040 0.202 0.712 1.888 3.988
Mix Model Price 0.008 0.039 0.153 0.474 1.209 2.590 4.784
Implied Vol 25.4% 25.0% 24.6% 24.4% 24.2% 24.0% 24.0%
Scenario Weights
High Vol 0.72 0.61 0.50 0.42 0.36 0.32 0.30
Medium 0.26 0.33 0.38 0.40 0.40 0.40 0.40
Low Vol 0.02 0.06 0.12 0.18 0.23 0.27 0.30
Model Assumptions
Probability vs. Behavioural Economics
Look at a Chart .. Sceptically
Some Top Cognitive Biases
• planning fallacy - underestimating time, cost, risk to exit position or build a
business
• choice paralysis - forgetting the 80:20 rule, complexity absorbs effort
• herding - joining the madness of crowds
• irrational escalation - becoming increasingly committed with sunk cost
• confirmation - forming a view unconsciously selects facts that support it
• hindsight - believing past events would have been predictable
• consistency - updating memory of past beliefs
• optimism - believing you are consistently better than average
• self-serving - attributing success to skill and failure to external factors
• narrative - fitting one neat story to confusing uncertain data
• outcome - judging a decision by the eventual outcome and not the reasoning
Relevant Experience & Events
1993 HSBC Risk Manager – Checking Stochastic Models (Real vs Risk Neutral
Worlds)
1994 US Rate Options Desk & MBS Blow-ups (Management & Risk Discipline)
1995 Trader/Structurer Chooser Accrual Swap (Conditional Probability)
1995 RBS-led FX interpolation (Model Arb)
1996 Tokyo Futures Libor/Tibor fix (Basis Risks)
1996 Pricing & Selling Non-Economic Hedges (Mitigate Worst Case Scenario)
1997 Lucky Dividend Swap before Pension Tax Credit changed (Yield
Exposure)
1997 UBS Equity Losses (Structural Risk & New Capacity)
1998 Russian Crisis & LTCM (Trusting Models, Naked Leverage)
1998 Peg Attack USD/HKD Spread (Volatility Exit Strategy)
1998 Collateral Pool of Corporate Bonds (True Funding Cost)
1998 Euro Convergence Trades (Event Risk)
1999 Dot Com Boom & Unfixed Strike Date (Spreadsheets, System Accuracy)
Relevant Experience & Events
2000 Totem (now Markit) – French Bank Mispricing (Whole Market)
2001 Napoleon Cliquet (Hidden Roll Risks)
2001 Volatility Swap (Vol without Gamma)
2002 High Strike CMS & Mortgage Prepayments (Large Second Order Effects)
2003 JPM's Equity Default Swap -70% put (LBO Credit Boom)
2005 WestLB Risk Manager – German Municipal Restructuring (Suitability)
2005 Large Digital Best-Of – (Unhedgeable pin-risk)
2006 Japan's PRDC (Leverage Derivatives, Long Dated FX Options)
2006 Porsche bid for VW and the Ords/Preferred (Rogue Trader/Assumptions/Model
Risk)
2007 CPDO Product (Risks of Pre-Packaged Strategies)
2009 EM Desk Post-Lehman (Behavioural & Cognitive Bias)
2010 SocGen Legal Dispute (Unhedgeable or Uncertain Positions)
2011 Treasury / CVA & Collateral charges – (Out of Model Changes)
2012 Credit Agricole EM Trader – Italian Swaps impact on Swaptions (New Contagion)
2013 Swaptions Valuations Consultant (Unreliable End of Month, Opaque Skew)
Agenda
• Typical Supply and Demand Patterns
• Static Analysis
– Supply & Demand on the Volatility Surface
– Model-free traders' rule-of-thumb
• Volatility as an Asset Class
• Hedge Priority & Preferences with Jumps
– Hidden assumptions of models
– Portfolio Risk & Mismatches
• Real Options & Non-Economic Options
Liquidity, Depth & Sophistication
Increasing Trend in Place
Volume is growing on the VİOP since August 2013
Istanbul attracting more offshore investors
sophisticated regional financial centre
Market conditions likely to remain favourable
Lower rates → demand for higher leverage
Uncertainty / Volatility → hedging demand
Trading Styles of Participants
Real Money Investor, Leveraged long-only, Corporate Hedger : Buy & Hold
• structured positions, preference for zero cost
• static hedge, pro-cyclical effect
Financial Institution, Fund : Overlay Trade
• covered call, yield enhancement
• leverage with limited downside
Market Maker, Speculator : Vol, Gamma or Probability View
• book-running, offset structural risk, event-driven bets
• flow business, ahead of expected supply & demand
Leverage User, Alternative Investor : Seeking Alpha
• short time horizon
• long-short strategies
Arbitrageur, Managed Futures/CTA, High Frequency Trading
• value trading inter-market spreads
• algorithmic model driven
Simplify Supply-Demand
The surface has complex movement due to expected
risks, fear of uncertainty and capacity stress, step 1 is
understanding a static equilibrium.
• Fundamentals sustain and motivate option market-
users
We will consider all types of “client” here but ignore
competing market-makers & short-term speculative flow
• Review Strategies for Equity Index & Single Stock
Options
• Look for Price Arbitrage and Volatility Surface “Value”
Main Strategies
Short term bounce (Cautious Bullish)
• Timing of entry, e.g. technical view is primarily on
the underlying but influences strike choice too.
• Long at-the-money or
out-the-money call has
limited downside.
• Can safely look for a take
profit, sell ATM option
or gamma trade
Main Strategies
Long-Only Hedge (Retail friendly)
• Give up some return, buy out-the-money put.
(participating deposit)
• Volatility is a wasting asset, theta cost favours
longer horizons.
• Guaranteed stop-loss,
unlikely to sell &
position lower down
Main Strategies
Zero cost structures (Cautious Bullish)
• Outright with limited upside and downside
e.g. defray the cost of buying a put by selling a
cap.
Main Strategies
Range-bound view (Stable Environment)
• Make money when nothing happens. Sell
volatility and buy back the wings. Accrual
Swap / Corridor Swap / Condor / Digital
Strangle / Double-no-touch
Main Strategies
Yield Enhancement Covered Call (Low Yield
Environment)
• Sell short-dated out-the-money options to
increase normal return, giving away upside
• Most popular in FX as dual-currency deposit
Supply & Demand - Conclusion
• Partly explains expensive puts
• Informs market phases and potential linkages
• Explains structural risks and likely stress
scenarios
• Suggests where a risk-premium is available
Now we need tools to compare our view to
market
Supply & Demand - Conclusion
Critical Analysis of a Snapshot
• Model-Free
• Strike Spread : Digital Option, simple bet
• Price is a (discounted) implied risk-neutral
probability
• Risk to Skew may be significant
Smooth Interpolation
• Bumps in a volatility surface around strike
concentration
Arbitrage limit
• Non-negative price of a fly
is equivalent to
• Exercise Probability vs Strike reduces out-the-money
Note : skew means different things across the surface
Note : dynamic sources of “fat-tails” and “skew”
Implied Conditional Pay-off
Divide price by probability to find “what-if”. Expected pay-out
conditioned on that single option expiring in-the-money.
Any pay-out at expiry can be sliced up into scenario buckets, assign
probability from bets and obtain simple heuristic “what-if” outcomes.
• Apply intuition about underlying to these “what-if” scenarios
Beware fine-tuning, very crude static model, no tails, narrative bias
Traders also look at a complex portfolio with correlations in terms of
“factors” – project payoff and risk onto a single “underlying” axis.
• Static hedging needs to monetise premium, avoid strike
concentration
Example : Expensive Puts
Conditional Payoff & Implied Probability
Strike 70 75 80 85 90 95 100
Flat Vol 24.0% 24.0% 24.0% 24.0% 24.0% 24.0% 24.0%
BS Put Price 0.004 0.028 0.132 0.448 1.189 2.584 4.784
Model Probability 0.2% 1.0% 3.6% 9.8% 20.7% 35.7% 52.4%
Conditional Payoff 2.34 2.92 3.65 4.57 5.75 7.24 9.13
Implied Vol 35.3% 32.6% 30.1% 27.7% 25.6% 24.0% 24.0%
Exponential Put Price 0.12 0.22 0.41 0.75 1.40 2.58 4.78
Implied Probability 1.5% 2.7% 5.0% 9.3% 17.2% 31.8% 58.9%
Conditional Payoff 8.12 8.12 8.12 8.12 8.12 8.12 8.12
0%
10%
20%
30%
40%
50%
60%
70%
70 75 80 85 90 95 100
Risk-Neutral as a Reality Distortion
Price is supply/demand driven & Behavioural Economics shows irrational forces exist … but Arbitrage
will ensure the whole picture looks pretty self-consistent.
Underlying market “irrational prices” situations:
• Fear of a sharp rally near the end of a bubble, forces individual bears to the side-lines waiting for a
trigger.
• Stop-loss discipline makes for choppy markets and bounces off the lows.
• Sideways move of an already expensive asset encourages roll of carry trades.
Corresponding Options situations:
• Fear of a crash persists some time after an adjustment even though volatility is strongly mean
reverting.
• Spikes in skew and volatility are highly correlated with actual drops in the underlying.
• Volatility gets super-cheap and stays there with a small yield from gamma trading or levered carry.
Be aware of this in historical analyses & in exit plans
Static Analysis – Typical Pattern
Value Creation …
• Customer products tend to make strong predictions.
• Expressing a clear view on an underlying scenario and
maximising pay-off for a small range is good for sales pitch.
Risk Creation …
• Static strategies’ strikes tend to be similar money-ness/cost
balance to get the best overall pay-off – concentration
affects whole market.
• Since option prices are less relevant than leverage, demand
can keep pushing beyond rational, creating mini mark-to-
market bubbles.
Static Analysis - Tips
• Phase of the underlying market will strongly affect
demand (think ahead, look at conditional probabilities,
understand what products work at what level)
• Plan exit knowing the market can stay in one phase a
long time (see gamma trading later)
• Customer business is mainly pro-cyclical (Keynesian
beauty contest exacerbated by momentum algorithms
and unrealised profit)
• Market makers try and reduce the price of what they
really want to buy – you can play along but do not get
sucked in to “new normal” thinking – (be patient
waiting for flow or a stress event)
Prediction Market & Bayes
Discipline for estimating odds requires defining
confidence. Updates have a lot more information
that outcomes.
Bayes allows for an estimate to be updated, it is
implicit within Black Scholes and other models that
build in assumptions about updates of market.
Use scenario Bayes to enrich a prediction e.g.:
• Start with uncertain inputs
• Reason about event risk
• Quantify “Out of Model” effects
Mixed Model Example
Bayesian - Event Risk & Out Of Model Effect
70 75 80 85 90 95 100
a priori 28.0% 28.0% 28.0% 28.0% 28.0% 28.0% 28.0%
High Vol 0.3 0.020 0.089 0.295 0.783 1.732 3.302 5.581
24.0% 24.0% 24.0% 24.0% 24.0% 24.0% 24.0%
Medium 0.4 0.004 0.028 0.132 0.448 1.189 2.584 4.784
20.0% 20.0% 20.0% 20.0% 20.0% 20.0% 20.0%
Low Vol 0.3 0.000 0.005 0.040 0.202 0.712 1.888 3.988
Mix Model Price 0.008 0.039 0.153 0.474 1.209 2.590 4.784
Implied Vol 25.4% 25.0% 24.6% 24.4% 24.2% 24.0% 24.0%
Scenario Weights
High Vol 0.72 0.61 0.50 0.42 0.36 0.32 0.30
Medium 0.26 0.33 0.38 0.40 0.40 0.40 0.40
Low Vol 0.02 0.06 0.12 0.18 0.23 0.27 0.30
Volatility as an Asset Class
Basic choice of monetising a long volatility position is by selling options or gamma trading the
underlying.
GAMBLER’S RUIN *
• Strategy that automatically buys stocks when they go down and sells stocks when they go up. Could
guarantee execution by leaving orders (not always best execution)
LIQUIDITY PROVIDER
Traditional market-maker, or user of order-driven platform, writes very small short-term options to
other participants. The reward is not having to deal across the spread.
Options ( long gamma, long volatility ) are a licence to execute that strategy within limits (Monopoly :
“Get out of jail free”)
• Suggests premium cost should be more than true expected pay-out
• Uncertainty increases with time-horizon, suggests volatility should normally rise in the short term
* to short options, esp. short gamma, you should own something you can afford to lose, e.g. Monetise
Real Options or else buy options back to control tail risks, extreme / unforeseeable events.
Gamma Trading for Volatility
Conviction required for a Sell or Buy Signal on Volatility.
Size of difference, Time to Monetise, Cost to Monetise,
Residual Risks of Drawdown.
E.g. 22.5% market vs 25% our view of fair on 3mth.
• Long-term expected compound return optimises
capital usage. Draw-down is lesser amount and
depends on risk appetite.
• Losses are more important than gains, too much
leverage wipes out capital. We need to stay in the
game.
• Worst case time-frame is hedge with underlying until
expiry.
.. without Any Dynamic Hedge
Maintain an investment of 20% of capital in premium
about 4.5x notional.
10% price converts to only a per-period return on capital
of 1%, the missing “half” of return is potential downside
from successive losses of premium forcing us to scale
back position.
The equivalent risk-return view on underlying would be
1.7% returns realised over a three month period without
adjusting position. Optimal leverage would be about 1.2x
assuming >20% recovery on an index.
Gamma Trading Tips
• The Bid-Offer spread, impact of leaving orders etc. can
cause immense friction or give away liquidity and
information to competitors
• In any case we focus on monetising opportunities not
expected to last until expiry – range trading style
• Note positive gamma can benefit other flow business,
private internal orders, generates axes
• Calculate hedges from the real volatility you expect to
crystallise (not market implied volatility)
• Combine with taking asymmetric views on the
underlying
Is there a Volatility Carry?
• It depends on theta and gamma and term structure but
in theory favours sellers ATM, and unregulated
providers of wing protection.
• Shorting volatility to profit from sideways drift has big
potential downside which limits efficient leverage
unless it can be closed out for an expected gain in a
short time
• If volatility is high and likely to fall rapidly that is a good
scenario to offer options
• Low implied volatility can push realised volatility down
due to gamma traders monetising long options - but it
is usually better to trade the underlying on that view
Term-structure & Mean Reversion
EXAMPLES
• medium-term FX : stable economic factors
• long-term FX : interest rate differentials dominate
• Equity 3yr rate-of-growth : rate reverts but effect is small relative to volatility and
rate / dividend spread
• Equity spread : possibly strongly mean reverting
• Interest Rates : cyclical and mean reverting but whole-curve shape has volatility
Volatility affected in term structure & correct hedge ratio between calendar spreads.
Volatility itself is strongly mean reverting:
• What shape is a “normal” volatility curve, long-end depends on long-dated
structures rates and yield
• Two scenarios, calm with increasing uncertainty or stressed and inverted
• Forward-forward volatility is hard to lock-in in the presence of strong correlations
and skew (model risk)
• Persistence and dynamic of skew is particular shortcoming of any local-gamma
model
Volatility as an Asset Class
Summary
Investment Banks transform risk like Banks transform debt maturity
Market-maker needs to know :
• fair-price & competitive spread (risk neutral)
• best value hedge (estimate of real = view)
E.g. Treasury lends 3mth but will mainly fund overnight unless they
expect a tightening
Models have no intuition about prices.
• licence to fish for volatility is good if you know where the fish are
• low volatility, consider leveraging a carry trade or bullish view
Hedge Priority & Preferences
• Delta – underlying, rates, currency, dividends,
discount/collateral
• Cash Premium – check Volatility hedge doesn’t leak Theta
• Buy-back wings
• Check Gamma by Strike, provision for pin-risk
.. but .. with Jumps
Portfolio replication theory assumes
“complete market, unlimited depth”
“continual hedging without cost”
Even in the most liquid market, FX majors, this is far from true
Jumps
Regular Normal Jumps
e.g. between sessions
• Occur in all markets quite
often
• Potential cost can be
estimated
• Mitigate by not over-
trading, and avoiding any
execution lag
• Generally not a problem,
just noise
Rare extreme moves
• Uncertain and unpredictable
• May not be estimated from
history
• Any model assumes future
trading liquidity
• Mitigate reliance on
dynamic rebalancing, buy
back wings
• Hedge Calculating Delta with
added Uncertainty
Real & Non-Economic Options
Financial option : contract with exercise, price, strike. Embedded convexity e.g. CMS
rate, predefined exchange rate.
Real option : choice with economic consequence
Contractual
• ability to prepay loan without penalty or with small fixed penalty
• flexibility for business decisions about timing, e.g. loan drawdown
• employee share scheme, terms fixed before deciding to participate
Tender to Contract
• tender on a fixed price, final contract may be awarded at later time
• stock listing, flotation, takeover
Non-contractual
• central bank or government policy (Greenspan / Bernanke Put)
• statutory pre-emption rights
Islamic Form
• Wa'ad Irrevocable Promise
Index as a Basket of Stocks
• XU030 - Weighted 30 stocks
• Sector concentration :
5 non-bank stocks with traded options
• Settlement differences :
Physical vs Cash
• Exercise differences :
American vs European
0
20
40
60
80
100
120
2001
2002
2003
2004
2005
2006
2007
2008
2009
2010
2011
2012
2013
Other
• Dividend yield, lumpy ex-div dates, tax bed & breakfast
• Roll risk & index composition changes
• Collateral costs
• Single-stock – Index as a basket option, “implied
correlation”
• Correlation instability, causality direction, contagion
• Co-integration, lags, spread option, best-of, worst-of
• Digital risk
• Barriers
• Retail products, inflation linked strike
Conclusion
Trading business model needs ..
• information advantage
• find new customer business
• obtain limits to utilise as a new resource
+ Genuinely more to trade
Ability to monetise contingent views, opportunities in quiet markets
- Difficulty = Barrier to entry
More products means more complexity and potentially more market
risk but definitely more model risk and less liquid positions
Conclusion
• Big challenge in modelling risk is persistence and
dynamic of skew, less important for short-dated vanilla
options
• Guard against any narrative with unlikely precision, use
simple tools to review complex ones, capture
uncertainty with scenarios
• Unknown unknowns and structural risk can dominate a
book, the "black swan" type trigger may be
unpredictable but the systemic risks are predictable
and controllable at a price
Conclusion
Opportunities
• Leverage – benefit existing directional views
• Carry – potential new source of income
• Active Trading – greater barriers to entry
06.10.2013 48
TEŞEKKÜR EDERİZ
VİOP
viop@borsaistanbul.com

Equity Option Trading : Derivatives Market Practices

  • 2.
  • 3.
    Introduction • Mathematician • ExoticFixed Income Options Trader * 6yrs HSBC • Option Consensus Valuations * 6yrs Totem • Risk Manager & EM Local Market Trader 6yrs WestLB * indirect exposure to Long-dated OTC Equity Options
  • 4.
  • 5.
  • 6.
    Trader Tools –direction & phase
  • 7.
    Trader Tools Conditional Payoff& Implied Probability Strike 70 75 80 85 90 95 100 Flat Vol 24.0% 24.0% 24.0% 24.0% 24.0% 24.0% 24.0% BS Put Price 0.004 0.028 0.132 0.448 1.189 2.584 4.784 Model Probability 0.2% 1.0% 3.6% 9.8% 20.7% 35.7% 52.4% Conditional Payoff 2.34 2.92 3.65 4.57 5.75 7.24 9.13 Implied Vol 35.3% 32.6% 30.1% 27.7% 25.6% 24.0% 24.0% Exponential Put Price 0.12 0.22 0.41 0.75 1.40 2.58 4.78 Implied Probability 1.5% 2.7% 5.0% 9.3% 17.2% 31.8% 58.9% Conditional Payoff 8.12 8.12 8.12 8.12 8.12 8.12 8.12 0% 10% 20% 30% 40% 50% 60% 70% 70 75 80 85 90 95 100
  • 8.
    Trader Tools Bayesian -Event Risk & Out Of Model Effect 70 75 80 85 90 95 100 a priori 28.0% 28.0% 28.0% 28.0% 28.0% 28.0% 28.0% High Vol 0.3 0.020 0.089 0.295 0.783 1.732 3.302 5.581 24.0% 24.0% 24.0% 24.0% 24.0% 24.0% 24.0% Medium 0.4 0.004 0.028 0.132 0.448 1.189 2.584 4.784 20.0% 20.0% 20.0% 20.0% 20.0% 20.0% 20.0% Low Vol 0.3 0.000 0.005 0.040 0.202 0.712 1.888 3.988 Mix Model Price 0.008 0.039 0.153 0.474 1.209 2.590 4.784 Implied Vol 25.4% 25.0% 24.6% 24.4% 24.2% 24.0% 24.0% Scenario Weights High Vol 0.72 0.61 0.50 0.42 0.36 0.32 0.30 Medium 0.26 0.33 0.38 0.40 0.40 0.40 0.40 Low Vol 0.02 0.06 0.12 0.18 0.23 0.27 0.30
  • 9.
  • 10.
    Probability vs. BehaviouralEconomics Look at a Chart .. Sceptically Some Top Cognitive Biases • planning fallacy - underestimating time, cost, risk to exit position or build a business • choice paralysis - forgetting the 80:20 rule, complexity absorbs effort • herding - joining the madness of crowds • irrational escalation - becoming increasingly committed with sunk cost • confirmation - forming a view unconsciously selects facts that support it • hindsight - believing past events would have been predictable • consistency - updating memory of past beliefs • optimism - believing you are consistently better than average • self-serving - attributing success to skill and failure to external factors • narrative - fitting one neat story to confusing uncertain data • outcome - judging a decision by the eventual outcome and not the reasoning
  • 11.
    Relevant Experience &Events 1993 HSBC Risk Manager – Checking Stochastic Models (Real vs Risk Neutral Worlds) 1994 US Rate Options Desk & MBS Blow-ups (Management & Risk Discipline) 1995 Trader/Structurer Chooser Accrual Swap (Conditional Probability) 1995 RBS-led FX interpolation (Model Arb) 1996 Tokyo Futures Libor/Tibor fix (Basis Risks) 1996 Pricing & Selling Non-Economic Hedges (Mitigate Worst Case Scenario) 1997 Lucky Dividend Swap before Pension Tax Credit changed (Yield Exposure) 1997 UBS Equity Losses (Structural Risk & New Capacity) 1998 Russian Crisis & LTCM (Trusting Models, Naked Leverage) 1998 Peg Attack USD/HKD Spread (Volatility Exit Strategy) 1998 Collateral Pool of Corporate Bonds (True Funding Cost) 1998 Euro Convergence Trades (Event Risk) 1999 Dot Com Boom & Unfixed Strike Date (Spreadsheets, System Accuracy)
  • 12.
    Relevant Experience &Events 2000 Totem (now Markit) – French Bank Mispricing (Whole Market) 2001 Napoleon Cliquet (Hidden Roll Risks) 2001 Volatility Swap (Vol without Gamma) 2002 High Strike CMS & Mortgage Prepayments (Large Second Order Effects) 2003 JPM's Equity Default Swap -70% put (LBO Credit Boom) 2005 WestLB Risk Manager – German Municipal Restructuring (Suitability) 2005 Large Digital Best-Of – (Unhedgeable pin-risk) 2006 Japan's PRDC (Leverage Derivatives, Long Dated FX Options) 2006 Porsche bid for VW and the Ords/Preferred (Rogue Trader/Assumptions/Model Risk) 2007 CPDO Product (Risks of Pre-Packaged Strategies) 2009 EM Desk Post-Lehman (Behavioural & Cognitive Bias) 2010 SocGen Legal Dispute (Unhedgeable or Uncertain Positions) 2011 Treasury / CVA & Collateral charges – (Out of Model Changes) 2012 Credit Agricole EM Trader – Italian Swaps impact on Swaptions (New Contagion) 2013 Swaptions Valuations Consultant (Unreliable End of Month, Opaque Skew)
  • 13.
    Agenda • Typical Supplyand Demand Patterns • Static Analysis – Supply & Demand on the Volatility Surface – Model-free traders' rule-of-thumb • Volatility as an Asset Class • Hedge Priority & Preferences with Jumps – Hidden assumptions of models – Portfolio Risk & Mismatches • Real Options & Non-Economic Options
  • 14.
    Liquidity, Depth &Sophistication Increasing Trend in Place Volume is growing on the VİOP since August 2013 Istanbul attracting more offshore investors sophisticated regional financial centre Market conditions likely to remain favourable Lower rates → demand for higher leverage Uncertainty / Volatility → hedging demand
  • 15.
    Trading Styles ofParticipants Real Money Investor, Leveraged long-only, Corporate Hedger : Buy & Hold • structured positions, preference for zero cost • static hedge, pro-cyclical effect Financial Institution, Fund : Overlay Trade • covered call, yield enhancement • leverage with limited downside Market Maker, Speculator : Vol, Gamma or Probability View • book-running, offset structural risk, event-driven bets • flow business, ahead of expected supply & demand Leverage User, Alternative Investor : Seeking Alpha • short time horizon • long-short strategies Arbitrageur, Managed Futures/CTA, High Frequency Trading • value trading inter-market spreads • algorithmic model driven
  • 16.
    Simplify Supply-Demand The surfacehas complex movement due to expected risks, fear of uncertainty and capacity stress, step 1 is understanding a static equilibrium. • Fundamentals sustain and motivate option market- users We will consider all types of “client” here but ignore competing market-makers & short-term speculative flow • Review Strategies for Equity Index & Single Stock Options • Look for Price Arbitrage and Volatility Surface “Value”
  • 17.
    Main Strategies Short termbounce (Cautious Bullish) • Timing of entry, e.g. technical view is primarily on the underlying but influences strike choice too. • Long at-the-money or out-the-money call has limited downside. • Can safely look for a take profit, sell ATM option or gamma trade
  • 18.
    Main Strategies Long-Only Hedge(Retail friendly) • Give up some return, buy out-the-money put. (participating deposit) • Volatility is a wasting asset, theta cost favours longer horizons. • Guaranteed stop-loss, unlikely to sell & position lower down
  • 19.
    Main Strategies Zero coststructures (Cautious Bullish) • Outright with limited upside and downside e.g. defray the cost of buying a put by selling a cap.
  • 20.
    Main Strategies Range-bound view(Stable Environment) • Make money when nothing happens. Sell volatility and buy back the wings. Accrual Swap / Corridor Swap / Condor / Digital Strangle / Double-no-touch
  • 21.
    Main Strategies Yield EnhancementCovered Call (Low Yield Environment) • Sell short-dated out-the-money options to increase normal return, giving away upside • Most popular in FX as dual-currency deposit
  • 22.
    Supply & Demand- Conclusion • Partly explains expensive puts • Informs market phases and potential linkages • Explains structural risks and likely stress scenarios • Suggests where a risk-premium is available Now we need tools to compare our view to market
  • 23.
    Supply & Demand- Conclusion
  • 24.
    Critical Analysis ofa Snapshot • Model-Free • Strike Spread : Digital Option, simple bet • Price is a (discounted) implied risk-neutral probability • Risk to Skew may be significant
  • 25.
    Smooth Interpolation • Bumpsin a volatility surface around strike concentration Arbitrage limit • Non-negative price of a fly is equivalent to • Exercise Probability vs Strike reduces out-the-money Note : skew means different things across the surface Note : dynamic sources of “fat-tails” and “skew”
  • 26.
    Implied Conditional Pay-off Divideprice by probability to find “what-if”. Expected pay-out conditioned on that single option expiring in-the-money. Any pay-out at expiry can be sliced up into scenario buckets, assign probability from bets and obtain simple heuristic “what-if” outcomes. • Apply intuition about underlying to these “what-if” scenarios Beware fine-tuning, very crude static model, no tails, narrative bias Traders also look at a complex portfolio with correlations in terms of “factors” – project payoff and risk onto a single “underlying” axis. • Static hedging needs to monetise premium, avoid strike concentration
  • 27.
    Example : ExpensivePuts Conditional Payoff & Implied Probability Strike 70 75 80 85 90 95 100 Flat Vol 24.0% 24.0% 24.0% 24.0% 24.0% 24.0% 24.0% BS Put Price 0.004 0.028 0.132 0.448 1.189 2.584 4.784 Model Probability 0.2% 1.0% 3.6% 9.8% 20.7% 35.7% 52.4% Conditional Payoff 2.34 2.92 3.65 4.57 5.75 7.24 9.13 Implied Vol 35.3% 32.6% 30.1% 27.7% 25.6% 24.0% 24.0% Exponential Put Price 0.12 0.22 0.41 0.75 1.40 2.58 4.78 Implied Probability 1.5% 2.7% 5.0% 9.3% 17.2% 31.8% 58.9% Conditional Payoff 8.12 8.12 8.12 8.12 8.12 8.12 8.12 0% 10% 20% 30% 40% 50% 60% 70% 70 75 80 85 90 95 100
  • 28.
    Risk-Neutral as aReality Distortion Price is supply/demand driven & Behavioural Economics shows irrational forces exist … but Arbitrage will ensure the whole picture looks pretty self-consistent. Underlying market “irrational prices” situations: • Fear of a sharp rally near the end of a bubble, forces individual bears to the side-lines waiting for a trigger. • Stop-loss discipline makes for choppy markets and bounces off the lows. • Sideways move of an already expensive asset encourages roll of carry trades. Corresponding Options situations: • Fear of a crash persists some time after an adjustment even though volatility is strongly mean reverting. • Spikes in skew and volatility are highly correlated with actual drops in the underlying. • Volatility gets super-cheap and stays there with a small yield from gamma trading or levered carry. Be aware of this in historical analyses & in exit plans
  • 29.
    Static Analysis –Typical Pattern Value Creation … • Customer products tend to make strong predictions. • Expressing a clear view on an underlying scenario and maximising pay-off for a small range is good for sales pitch. Risk Creation … • Static strategies’ strikes tend to be similar money-ness/cost balance to get the best overall pay-off – concentration affects whole market. • Since option prices are less relevant than leverage, demand can keep pushing beyond rational, creating mini mark-to- market bubbles.
  • 30.
    Static Analysis -Tips • Phase of the underlying market will strongly affect demand (think ahead, look at conditional probabilities, understand what products work at what level) • Plan exit knowing the market can stay in one phase a long time (see gamma trading later) • Customer business is mainly pro-cyclical (Keynesian beauty contest exacerbated by momentum algorithms and unrealised profit) • Market makers try and reduce the price of what they really want to buy – you can play along but do not get sucked in to “new normal” thinking – (be patient waiting for flow or a stress event)
  • 31.
    Prediction Market &Bayes Discipline for estimating odds requires defining confidence. Updates have a lot more information that outcomes. Bayes allows for an estimate to be updated, it is implicit within Black Scholes and other models that build in assumptions about updates of market. Use scenario Bayes to enrich a prediction e.g.: • Start with uncertain inputs • Reason about event risk • Quantify “Out of Model” effects
  • 32.
    Mixed Model Example Bayesian- Event Risk & Out Of Model Effect 70 75 80 85 90 95 100 a priori 28.0% 28.0% 28.0% 28.0% 28.0% 28.0% 28.0% High Vol 0.3 0.020 0.089 0.295 0.783 1.732 3.302 5.581 24.0% 24.0% 24.0% 24.0% 24.0% 24.0% 24.0% Medium 0.4 0.004 0.028 0.132 0.448 1.189 2.584 4.784 20.0% 20.0% 20.0% 20.0% 20.0% 20.0% 20.0% Low Vol 0.3 0.000 0.005 0.040 0.202 0.712 1.888 3.988 Mix Model Price 0.008 0.039 0.153 0.474 1.209 2.590 4.784 Implied Vol 25.4% 25.0% 24.6% 24.4% 24.2% 24.0% 24.0% Scenario Weights High Vol 0.72 0.61 0.50 0.42 0.36 0.32 0.30 Medium 0.26 0.33 0.38 0.40 0.40 0.40 0.40 Low Vol 0.02 0.06 0.12 0.18 0.23 0.27 0.30
  • 33.
    Volatility as anAsset Class Basic choice of monetising a long volatility position is by selling options or gamma trading the underlying. GAMBLER’S RUIN * • Strategy that automatically buys stocks when they go down and sells stocks when they go up. Could guarantee execution by leaving orders (not always best execution) LIQUIDITY PROVIDER Traditional market-maker, or user of order-driven platform, writes very small short-term options to other participants. The reward is not having to deal across the spread. Options ( long gamma, long volatility ) are a licence to execute that strategy within limits (Monopoly : “Get out of jail free”) • Suggests premium cost should be more than true expected pay-out • Uncertainty increases with time-horizon, suggests volatility should normally rise in the short term * to short options, esp. short gamma, you should own something you can afford to lose, e.g. Monetise Real Options or else buy options back to control tail risks, extreme / unforeseeable events.
  • 34.
    Gamma Trading forVolatility Conviction required for a Sell or Buy Signal on Volatility. Size of difference, Time to Monetise, Cost to Monetise, Residual Risks of Drawdown. E.g. 22.5% market vs 25% our view of fair on 3mth. • Long-term expected compound return optimises capital usage. Draw-down is lesser amount and depends on risk appetite. • Losses are more important than gains, too much leverage wipes out capital. We need to stay in the game. • Worst case time-frame is hedge with underlying until expiry.
  • 35.
    .. without AnyDynamic Hedge Maintain an investment of 20% of capital in premium about 4.5x notional. 10% price converts to only a per-period return on capital of 1%, the missing “half” of return is potential downside from successive losses of premium forcing us to scale back position. The equivalent risk-return view on underlying would be 1.7% returns realised over a three month period without adjusting position. Optimal leverage would be about 1.2x assuming >20% recovery on an index.
  • 36.
    Gamma Trading Tips •The Bid-Offer spread, impact of leaving orders etc. can cause immense friction or give away liquidity and information to competitors • In any case we focus on monetising opportunities not expected to last until expiry – range trading style • Note positive gamma can benefit other flow business, private internal orders, generates axes • Calculate hedges from the real volatility you expect to crystallise (not market implied volatility) • Combine with taking asymmetric views on the underlying
  • 37.
    Is there aVolatility Carry? • It depends on theta and gamma and term structure but in theory favours sellers ATM, and unregulated providers of wing protection. • Shorting volatility to profit from sideways drift has big potential downside which limits efficient leverage unless it can be closed out for an expected gain in a short time • If volatility is high and likely to fall rapidly that is a good scenario to offer options • Low implied volatility can push realised volatility down due to gamma traders monetising long options - but it is usually better to trade the underlying on that view
  • 38.
    Term-structure & MeanReversion EXAMPLES • medium-term FX : stable economic factors • long-term FX : interest rate differentials dominate • Equity 3yr rate-of-growth : rate reverts but effect is small relative to volatility and rate / dividend spread • Equity spread : possibly strongly mean reverting • Interest Rates : cyclical and mean reverting but whole-curve shape has volatility Volatility affected in term structure & correct hedge ratio between calendar spreads. Volatility itself is strongly mean reverting: • What shape is a “normal” volatility curve, long-end depends on long-dated structures rates and yield • Two scenarios, calm with increasing uncertainty or stressed and inverted • Forward-forward volatility is hard to lock-in in the presence of strong correlations and skew (model risk) • Persistence and dynamic of skew is particular shortcoming of any local-gamma model
  • 39.
    Volatility as anAsset Class Summary Investment Banks transform risk like Banks transform debt maturity Market-maker needs to know : • fair-price & competitive spread (risk neutral) • best value hedge (estimate of real = view) E.g. Treasury lends 3mth but will mainly fund overnight unless they expect a tightening Models have no intuition about prices. • licence to fish for volatility is good if you know where the fish are • low volatility, consider leveraging a carry trade or bullish view
  • 40.
    Hedge Priority &Preferences • Delta – underlying, rates, currency, dividends, discount/collateral • Cash Premium – check Volatility hedge doesn’t leak Theta • Buy-back wings • Check Gamma by Strike, provision for pin-risk .. but .. with Jumps Portfolio replication theory assumes “complete market, unlimited depth” “continual hedging without cost” Even in the most liquid market, FX majors, this is far from true
  • 41.
    Jumps Regular Normal Jumps e.g.between sessions • Occur in all markets quite often • Potential cost can be estimated • Mitigate by not over- trading, and avoiding any execution lag • Generally not a problem, just noise Rare extreme moves • Uncertain and unpredictable • May not be estimated from history • Any model assumes future trading liquidity • Mitigate reliance on dynamic rebalancing, buy back wings • Hedge Calculating Delta with added Uncertainty
  • 42.
    Real & Non-EconomicOptions Financial option : contract with exercise, price, strike. Embedded convexity e.g. CMS rate, predefined exchange rate. Real option : choice with economic consequence Contractual • ability to prepay loan without penalty or with small fixed penalty • flexibility for business decisions about timing, e.g. loan drawdown • employee share scheme, terms fixed before deciding to participate Tender to Contract • tender on a fixed price, final contract may be awarded at later time • stock listing, flotation, takeover Non-contractual • central bank or government policy (Greenspan / Bernanke Put) • statutory pre-emption rights Islamic Form • Wa'ad Irrevocable Promise
  • 43.
    Index as aBasket of Stocks • XU030 - Weighted 30 stocks • Sector concentration : 5 non-bank stocks with traded options • Settlement differences : Physical vs Cash • Exercise differences : American vs European 0 20 40 60 80 100 120 2001 2002 2003 2004 2005 2006 2007 2008 2009 2010 2011 2012 2013
  • 44.
    Other • Dividend yield,lumpy ex-div dates, tax bed & breakfast • Roll risk & index composition changes • Collateral costs • Single-stock – Index as a basket option, “implied correlation” • Correlation instability, causality direction, contagion • Co-integration, lags, spread option, best-of, worst-of • Digital risk • Barriers • Retail products, inflation linked strike
  • 45.
    Conclusion Trading business modelneeds .. • information advantage • find new customer business • obtain limits to utilise as a new resource + Genuinely more to trade Ability to monetise contingent views, opportunities in quiet markets - Difficulty = Barrier to entry More products means more complexity and potentially more market risk but definitely more model risk and less liquid positions
  • 46.
    Conclusion • Big challengein modelling risk is persistence and dynamic of skew, less important for short-dated vanilla options • Guard against any narrative with unlikely precision, use simple tools to review complex ones, capture uncertainty with scenarios • Unknown unknowns and structural risk can dominate a book, the "black swan" type trigger may be unpredictable but the systemic risks are predictable and controllable at a price
  • 47.
    Conclusion Opportunities • Leverage –benefit existing directional views • Carry – potential new source of income • Active Trading – greater barriers to entry
  • 48.