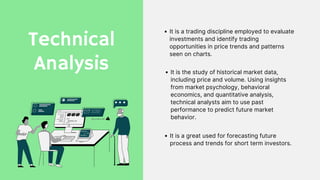
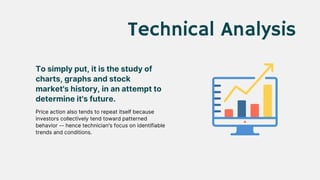
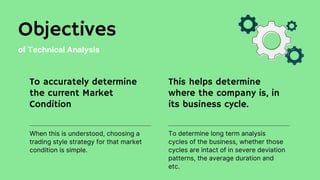
Technical analysis is the study of historical market data like prices and volumes to identify patterns and trends that can be used to predict future market behavior. The objectives of technical analysis include accurately determining the current market condition, identifying trends, reducing risks, setting targets and exits, and avoiding false trades. Common technical analysis strategies involve identifying trends, momentum, support and resistance levels, and analyzing indicators like moving averages, oscillators, and volume measures.
Technical Analysis Explained
Trends in Technical Analysis
Trend Classifications
Support & Resistance
Technical Analysis Indicators
Using the MACD to trade the EUR/USD
Technical analysis is a method of evaluating securities by analyzing the statistics generated by market activity, such as past prices and volume. Technical analysts do not attempt to measure a security's intrinsic value, but instead use charts and other tools to identify patterns that can suggest future activity
This document provides an introduction to technical analysis and its key concepts and techniques. It discusses the basic assumptions of technical analysis, including that the market discounts everything, price moves in trends, and history tends to repeat itself. It then covers various charting techniques like line charts, bar charts, candlestick charts, and point and figure charts. It also discusses important concepts in technical analysis like chart patterns, trends, trend lines, channels, support and resistance, and specific patterns like head and shoulders, cup and handle, double tops/bottoms, triangles, flags, and pennants.
Top 5 Indicators for Intraday Trading and How to Use ThemStock Venture
Intraday traders realize how crucial trustworthy indications are. Which one should you choose? It's a complex question with no easy answer. Some traders swear by oscillators like the Relative Strength Index (RSI), while others prefer Bollinger Bands or Moving Average Convergence Divergence (MACD). We'll break down each indicator in this tutorial to help you choose the right one for your trading style and goals. Learn how to trade intraday!
Price Action Trading Best 100% Successful Strategies used by Investors.pdfNazim Khan
What is meant by price action?
The movement of a security’s price plotted over time is known as price action. All technical analysis of a stock, commodity, or other asset chart is based on price activity. Many short-term traders base all of their trading choices solely on price movement and the formations and trends that can be drawn from it. Since it employs previous prices in calculations that can then be used to advise trading decisions, technical analysis as a practice is a derivative of price action.
A method for speculating on the financial markets called “price action trading” involves analyzing the fundamental changes in price over time. It is frequently used by institutional traders, hedge fund managers, and a large number of retail traders to forecast the future direction of the price of securities or financial markets.
In other words, price action trading is a ‘pure’ form of technical analysis because it doesn’t use any indicators that are derived from previous prices. The only data a market generates about itself that price action traders are interested in is price movement over time.
Price action analysis enables a trader to comprehend market price movement and offers explanations that help the trader create an image in their minds of how the market is currently structured. A market’s ‘gut feel’ and the experience of seasoned price action traders are frequently cited as the main drivers of their trading success.
A trader can attempt to interpret the human thought process underlying a market’s movement using the price action of the market. As they trade, each participant in a market leaves ‘clues’ in the form of price action on the price chart of that market. These clues can be analyzed and used to try to predict the next move in a market.
What Can You Learn from Price Action?
Charts that show price changes over time can be used to observe and interpret price action. To better identify and understand trends, breakouts, and reversals, traders’ use various chart compositions. Since candlestick charts show the open, high, low, and close values in the context of up or down sessions, they aid in the better visualization of price movements and are popular among traders.
Price action can be visually interpreted using candlestick patterns like the Harami cross, engulfing pattern, and three white soldiers. Many more candlestick formations can be created based on price action to predict what will happen next. Other chart types, such as point-and-figure charts, box charts, box plots, and others, can use the same formations.
Many technical analysts calculate technical indicators using price action data in addition to the visual formations on the chart. The objective is to uncover order in a price’s occasionally seeming random movement. For instance, the price action indicates that bulls have attempted a breakout on multiple occasions and have gained momentum each time, so an ascending triangle pattern created by applying trend lines to a price ac
Intraday or day trading can be challenging for newcomers. To get an advantage over others, traders must keep an eye on various key aspects. Chart patterns, technical indicators, open interest, market news, and so on are examples of these variables. The most significant indicators for intraday trading will be discussed in this post. These indications will aid you in maintaining a high success rate and a favorable risk-reward ratio.
www.ksofttechnologies.com
Investment and analysis has many deep interventions to it. Have a look and get idea about these. Simple moving Average, Exponential moving average, Professional traders, oscillators, break out, Convergence, Divergence, market indicators, IRS, ROc, bullish percent Index.
The document provides guidance on using an effective swing trading strategy in forex markets. It discusses identifying trends using techniques like moving averages and trendlines. Traders are advised to use support and resistance levels as well as technical indicators to identify potential entry and exit points. Clear rules for entering and exiting trades based on factors like moving average crossovers and stop losses are also recommended. The document stresses the importance of risk management and staying informed about market news and events to help swing traders make profitable decisions.
A fundamental study on Technical AnalysisJay Sadhwani
Technical analysis is the use of historical price and volume data to forecast future price movements. It is based on the assumptions that market prices reflect all known information, that prices trend, and that history repeats itself. There are various chart types used including line charts, bar charts, candlestick charts, and point and figure charts. Key aspects of technical analysis include identifying trends, measuring trend strength, finding low risk entry points, using stop losses, and exiting when trends reverse. Technical analysis focuses on price movements to predict the future, while weaknesses include subjectivity and interpretation of patterns.
The document provides an overview of technical analysis. It defines technical analysis as identifying trend reversals using indicators such as price, volume, support/resistance levels, and chart patterns. It discusses various technical analysis tools like moving averages, oscillators, and chart patterns that are used to identify trends and potential reversals. The key difference between technical and fundamental analysis is that technical analysis focuses on internal market data like price and volume, while fundamental analysis considers external factors like the economy and company performance.
Technical analysis is the forecasting of future asset prices based on past price movements. It uses charts, indicators, and patterns to analyze supply and demand forces influencing prices over time. The objectives are to determine the direction and extent of price trends, as well as when trends may reverse. Key aspects of technical analysis include identifying support and resistance levels, trendlines, moving averages, and common patterns like head and shoulders and triangles. Volume analysis and indicators provide additional context for interpreting price charts and anticipating trend changes.
- The document discusses technical analysis, which uses patterns in stock prices and trading volume to predict future stock performance, rather than analyzing companies' financials.
- It outlines various technical analysis techniques like charting patterns, indicators like RSI and Bollinger Bands, and identifying support and resistance levels.
- Technical analysis is believed to be one of the oldest forms of security analysis and is still widely used today, though it also faces challenges from theories like the efficient market hypothesis.
Better understand technical analysis and some indicatorsAbdirahmanYusuf14
This document provides an overview of technical analysis and some common indicators used in currency trading. It describes how technical analysis uses historical price data and trends to identify signals for profitable trades. Several technical indicators are explained, including moving averages, MACD, Bollinger Bands, Fibonacci retracement, and RSI, which analyze trends, momentum, and overbought/oversold conditions to provide buy and sell signals. The document emphasizes the importance of combining multiple indicators and trading with the trend and within one's risk tolerance.
The document discusses technical analysis, which uses historical market data like stock prices and volumes to identify trends and predict future market moves. It describes several technical analysis techniques including bar and line charts, moving averages, volume and momentum indicators. The key idea of technical analysis is that market trends persist due to shifts in supply and demand, which can be observed through patterns in historical price data. Technical analysts use tools like charts and indicators to identify emerging trends and make trading decisions.
10 Best Technical Indicators List Trend Indicators.pdfNazim Khan
Trading in the financial markets requires a deep understanding of various tools and techniques that can help traders make informed decisions. One such set of tools is technical indicators, which are widely used to analyze price movements, identify trends, and generate trading signals. In this article, we will explore some of the most trending technical indicators used by traders worldwide. So, let’s dive in and uncover the power of these indicators in shaping successful trading strategies.
Introduction to Technical Indicators
Technical indicators are mathematical calculations applied to historical price and volume data to gain insights into market trends and price patterns. These indicators help traders identify potential buy or sell signals and assist in making informed trading decisions. Traders often combine multiple indicators to validate their analysis and increase the probability of successful trades.
1. Moving Averages
Simple Moving Average (SMA)
A simple moving average (SMA) is a commonly used technical indicator that calculates the average price of a security over a specified period. It smoothes out price fluctuations and helps identify trends. Traders use SMAs to determine support and resistance levels and generate trading signals when the price crosses above or below the moving average.
Exponential Moving Average (EMA)
The exponential moving average (EMA) is another widely used moving average indicator. It gives more weight to recent prices, making it more responsive to recent market changes compared to the SMA. Traders use EMAs to identify short-term trends and potential entry or exit points.
2. Relative Strength Index (RSI)
The Relative Strength Index (RSI) is a momentum oscillator that measures the speed and change of price movements. RSI values range from 0 to 100 and indicate overbought or oversold conditions in the market. Traders use the RSI to identify potential trend reversals and generate buy or sell signals.
3. Bollinger Bands
Bollinger Bands consist of a moving average (usually the SMA) and two standard deviation lines. These bands expand and contract based on market volatility. Traders use Bollinger Bands to identify periods of low volatility (squeezes) and anticipate potential breakout moves. When the price touches the upper band, it may be a signal to sell, while touching the lower band may indicate a buying opportunity.
4. MACD (Moving Average Convergence Divergence)
The Moving Average Convergence Divergence (MACD) is a trend-following momentum indicator. It consists of two lines: the MACD line and the signal line. Traders use the MACD to identify potential trend reversals, generate buy or sell signals, and confirm the strength of a trend.
5. Stochastic Oscillator
The Stochastic Oscillator is a momentum indicator that compares the closing price of a security to its price range over a specific period. It consists of two lines: %K and %D. Traders use the Stochastic Oscillator to identify overbought or oversold conditions
The document provides an overview of technical analysis and various techniques for determining market trends and identifying trading opportunities, including trend lines, psychological levels, moving averages, Bollinger Bands, MACD, and stochastic. Examples are given for each technique that illustrate how to determine the market bias, establish entry and exit criteria, and design trading strategies around supports and resistances. Technical analysis techniques are presented as educational tools and there is no guarantee they will result in profits.
Using analysis on a particular market instrument or stock can be hard to do manually but today's market analysis software and trading platforms often have features that can does this even on multiple items or samples.
This document provides an overview of technical analysis in 3 paragraphs or less:
Technical analysis uses historical market data, particularly price and volume, to identify trends and predict future market movements. Charts like bar charts and candlestick charts are used to identify patterns indicating trends are strengthening or reversing. Technical indicators like moving averages, MACD, and ADX are analyzed to determine whether the market is trending or consolidating. Common chart patterns like head and shoulders and double tops/bottoms provide additional signals on the strength and direction of trends. Volume analysis is also important, with increasing volume confirming trends and decreasing volume indicating potential reversals.
This document provides an overview of technical analysis and various technical indicators used to analyze stock prices and generate buy/sell signals. It discusses technical analysis approaches like trend lines, support and resistance levels, chart patterns like head and shoulders and double tops/bottoms, and indicators such as moving averages, MACD, RSI, Bollinger Bands, pivot points, and money flow index. The goal of technical analysis is to forecast stock prices and market movements based on historical market data like price, volume, and open interest.
QNBFS Daily Technical Trader Qatar - December 03 2019 التحليل الفني اليومي لب...QNB Group
The Index reached the upper side of the flattish, and now testing the moving averages after it broke below the short- term uptrend channel. That being said, a breakout above that side of the flattish channel means a stronger possibility of a bullish move towards the 11,000 mark.
QNBFS Daily Technical Trader Qatar - November 14 2019 التحليل الفني اليومي لب...QNB Group
The Index reached the upper side of the flattish, and now testing the moving averages after it broke below the short- term uptrend channel. That being said, a breakout above that side of the flattish channel means a stronger possibility of a bullish move towards the 11,000 mark.
QNBFS Daily Technical Trader - Qatar for March 20, 2018 التحليل الفني اليومي ...Aicha El-Mamy
The Index managed to close above the corrective channel
which extended since January. The uptick was accompanied with relatively higher volumes and we are becoming more optimistic for the breakout above the 9,000 level.
Trends and Trendlines in Indian stock market.pdfiamraham
Trends and Trendlines explained for intraday and swing trading in Indian stock market. A complete guide for the trend identification for a short term or medium term investments.
QNBFS Daily Technical Trader Qatar - October 09 2019 التحليل الفني اليومي لبو...QNB Group
The Index reached the upper side of the flattish, and now testing the moving averages after it broke below the short- term uptrend channel. That being said, a breakout above that side of the flattish channel means a stronger possibility of a bullish move towards the 11,000 mark.
QNBFS Daily Technical Trader Qatar - October 15 2019 التحليل الفني اليومي لبو...QNB Group
The document provides a daily technical analysis and overview of the Qatar Stock Exchange Index and two Qatari stocks - Commercial Bank and Industries Qatar. For the index, it notes it reached the upper limit of its range and is now testing moving averages after breaking below a short-term uptrend channel. For Commercial Bank, it discusses the sideways trading and potential for an upward move. Key resistance and support levels are identified for both. Technical indicators and definitions are also included.
Technical analysis, market efficiency, and behavioral financeBabasab Patil
Technical analysis uses patterns in stock prices and trading volume to predict future market movements and identify trading opportunities. The efficient market hypothesis states that stock prices instantly reflect all available information, making technical analysis ineffective. However, behavioral finance suggests psychological factors influence investor decisions and market anomalies exist, challenging the notion of complete market efficiency.
This document provides information on technical analysis and its key concepts. It defines technical analysis as using past and current price and volume movements to predict future market direction. It discusses the assumptions of technical analysis and compares it to fundamental analysis. It then describes various charting methods used in technical analysis like bar charts, line charts, point and figure charts, and Japanese candlestick charts. It also covers chart patterns, efficient market theory, Dow theory, and random walk theory as related concepts in technical analysis.
ZKsync airdrop of 3.6 billion ZK tokens is scheduled by ZKsync for next week.pdfSOFTTECHHUB
The world of blockchain and decentralized technologies is about to witness a groundbreaking event. ZKsync, the pioneering Ethereum Layer 2 network, has announced the highly anticipated airdrop of its native token, ZK. This move marks a significant milestone in the protocol's journey, empowering the community to take the reins and shape the future of this revolutionary ecosystem.
UnityNet World Environment Day Abraham Project 2024 Press ReleaseLHelferty
June 12, 2024 UnityNet International (#UNI) World Environment Day Abraham Project 2024 Press Release from Markham / Mississauga, Ontario in the, Greater Tkaronto Bioregion, Canada in the North American Great Lakes Watersheds of North America (Turtle Island).
The E-Way Bill revolutionizes logistics by digitizing the documentation of goods transport, ensuring transparency, tax compliance, and streamlined processes. This mandatory, electronic system reduces delays, enhances accountability, and combats tax evasion, benefiting businesses and authorities alike. Embrace the E-Way Bill for efficient, reliable transportation operations.
World economy charts case study presented by a Big 4
World economy charts case
World economy charts case study presented by a Big 4
World economy charts case study presented by a Big 4World economy charts case study presented by a Big 4
World economy charts case study presented by a Big 4
World economy charts case study presented by a Big 4World economy charts case study presented by a Big 4World economy charts case study presented by a Big 4World economy charts case study presented by a Big 4World economy charts case study presented by a Big 4World economy charts case study presented by a Big 4World economy charts case study presented by a Big 4World economy charts case study presented by a Big 4World economy charts case study presented by a Big 4World economy charts case study presented by a Big 4World economy charts case study presented by a Big 4World economy charts case study presented by a Big 4World economy charts case study presented by a Big 4World economy charts case study presented by a Big 4study presented by a Big 4
Cleades Robinson, a respected leader in Philadelphia's police force, is known for his diplomatic and tactful approach, fostering a strong community rapport.
Methanex is the world's largest producer and supplier of methanol. We create value through our leadership in the global production, marketing and delivery of methanol to customers. View our latest Investor Presentation for more details.
2. Matters on the Docket
A brief look at what we will discuss on this report
Technical Analysis Strategies
Technical Analysis: Defined and Explained
01
04
02
05
03
06
Technical Analysis in Stock Market
Objectives of Technical Analysis
Purpose of Performing Technical Analysis
Methods to Perform Technical Analysis
3. Technical
Analysis
It is a trading discipline employed to evaluate
investments and identify trading
opportunities in price trends and patterns
seen on charts.
It is the study of historical market data,
including price and volume. Using insights
from market psychology, behavioral
economics, and quantitative analysis,
technical analysts aim to use past
performance to predict future market
behavior.
It is a great used for forecasting future
process and trends for short term investors.
4. Technical Analysis
Price action also tends to repeat itself because
investors collectively tend toward patterned
behavior -- hence technician's focus on identifiable
trends and conditions.
To simply put, it is the study of
charts, graphs and stock
market's history, in an attempt to
determine it's future.
5. Objectives
of Technical Analysis
When this is understood, choosing a
trading style strategy for that market
condition is simple.
To accurately determine
the current Market
Condition
To determine long term analysis
cycles of the business, whether those
cycles are intact of in severe deviation
patterns, the average duration and
etc.
This helps determine
where the company is, in
its business cycle.
6. Objectives
of Technical Analysis
To analyze Industry and Sector cycles
to find the strongest industries or
sectors for optimizing and focusing on
the highest growth potential industries
for the coming year and subsequent
years.
To identify which industries
have the highest number of
quality stocks that lead
their industry
There are different market participant
groups that all 3 data sets. Selecting
one for that market condition or
selecting one that provides the lowest
risk versus highest profit potential for
trading is taught.
Selection of which market
group the trader intends to
trade with and which
groups to avoid
7. Objectives
of Technical Analysis
This information can be studied, and
provide excellent data set information
for decisions within the daily activity
when needed.
Technical Patterns reveal
enormous amounts of
information about the
current trading conditions
Many patterns are in the Relational
Technical Analysis studies. With this
knowledge and the skill to use this
information correctly, a trader can
trade almost any market condition and
trading condition successfully.
Lowering Risk is a huge
aspect of technical
analysis
8. The trend is the direction of the
market, in technical analysis trends
are identified by trend line connecting
the high and lows form by price during
it move in a trend
Identify
Trend
Purpose of Performing
Technical Analysis of Stocks
Movement of the stock indicates the
speed of price change in the stock.
Momentum shows the rate of change
of price over a defined period helps
the trader to define the strength of the
move.
Movement
9. refers to the price at which a trader in
punching buys or sell order, in trading
timing an entry is everything, price
alone can’t help in timing but the
technical analysis does, it guides us
through different support and
resistance value.
Entry
Purpose of Performing
Technical Analysis of Stocks
It allows us to minimize the loss, by
properly knowing the nearby support
and resistance zone we can place our
stop-loss order at the right price so
that if we are wrong in our analysis our
stop loss will prevent the dropdown in
our capital.
Reduce Loss
10. There is a saying in the market
“knowing when to exit is more
important than then when to entry”, so
before entering a trade it is more
important for you to define your exit
level in advance.
Target
Purpose of Performing
Technical Analysis of Stocks
It prevents the false trade, technical of
a stock helps us to locate the support
and resistance zone, so by
understanding the zone in which the
price is, you can trade accordingly or
at least we will not short a share near
a support zone, or buy a share near a
resistance
False Trade
11. Technical
Analysis in
Stock Market
Technicians say that a market's price
reflects all relevant information, so their
analysis looks at the history of a
security's trading pattern rather than
external drivers such as economic,
fundamental and news events.
Technical analysis determines
trends and tries to take
advantage of them
12.
13.
14.
15.
16.
17.
18.
19.
20. Methods to Perform
Technical Analysis
Technical indicators are used by
traders to gain insight into the
supply and demand of securities
and market psychology.
Together, these indicators form
the basis of technical analysis.
Metrics, such as trading volume,
provide clues as to whether a
price move will continue. In this
way, indicators can be used to
generate buy and sell signals.
21. Technical indicators that use the same
scale as prices are plotted over the top
of the prices on a stock chart.
Overlays
Rather than being overlayed on a price
chart, technical indicators that oscillate
between a local minimum and maximum
are plotted above or below a price chart
Oscillators
Tools of the Trade
The tools of the trade for day
traders and technical analysts
consist of charting tools that
generate signals to buy or sell, or
which indicate trends or patterns
in the market. Broadly speaking,
there are two basic types of
technical indicators:
22. On-Balance
Volume
We use the on-balance volume indicator
(OBV) to measure the positive and
negative flow of volume in a security
over time.
When OBV is rising, it shows that buyers are
willing to step in and push the price higher.
When OBV is falling, the selling volume is
outpacing buying volume, which indicates
lower prices. In this way, it acts like a trend
confirmation tool. If price and OBV are rising,
that helps indicate a continuation of the
trend.
Traders who use OBV also watch for
divergence. This occurs when the indicator
and price are going in different directions. If
the price is rising but OBV is falling, that
could indicate that the trend is not backed by
strong buyers and could soon reverse.
23.
24. Accumulation/
Distribution
Line
One of the most commonly used
indicators to determine the money flow
in and out of a security is the
accumulation/distribution line (A/D line).
It is similar to the on-balance volume
indicator (OBV), but instead of considering
only the closing price of the security for the
period, it also takes into account the trading
range for the period and where the close is in
relation to that range. If a stock finishes near
its high, the indicator gives volume more
weight than if it closes near the midpoint of
its range. The different calculations mean
that OBV will work better in some cases and
A/D will work better in others.
If the indicator line is trending up, it shows
buying interest, since the stock is closing
above the halfway point of the range. This
helps confirm an uptrend. On the other hand,
if A/D is falling, that means the price is
finishing in the lower portion of its daily
range, and thus volume is considered
negative. This helps confirm a downtrend.
25.
26. Average
Directional
Index
It is a trend indicator used to measure
the strength and momentum of a trend.
When the ADX is above 40, the trend is
considered to have a lot of directional
strength, either up or down, depending
on the direction the price is moving.
ADX above 20 and DI+ above DI-: That's
an uptrend.
ADX above 20 and DI- above DI+: That's a
downtrend.
ADX below 20 is a weak trend or ranging
period, often associated with the DI- and
DI+ rapidly crisscrossing each other.
The ADX is the main line on the indicator,
usually colored black. There are two
additional lines that can be optionally shown.
These are DI+ and DI-. These lines are often
colored red and green, respectively. All three
lines work together to show the direction of
the trend as well as the momentum of the
trend.
27.
28. Aroon
Indicator
It is a technical indicator used to
measure whether a security is in a trend,
and more specifically if the price is
hitting new highs or lows over the
calculation period (typically 25).
When the Aroon-up crosses above the
Aroon-down, that is the first sign of a
possible trend change. If the Aroon-up hits
100 and stays relatively close to that level
while the Aroon-down stays near zero, that is
positive confirmation of an uptrend.
The reverse is also true. If Aroon-down
crosses above Aroon-up and stays near 100,
this indicates that the downtrend is in force.
29.
30. MACD
The moving average convergence
divergence (MACD) indicator helps
traders see the trend direction, as well as
the momentum of that trend. It also
provides a number of trade signals.
When the MACD is above zero, the price
is in an upward phase. If the MACD is
below zero, it has entered a bearish
period.
The indicator is composed of two lines: the
MACD line and a signal line, which moves
slower. When MACD crosses below the signal
line, it indicates that the price is falling. When
the MACD line crosses above the signal line,
the price is rising.
Looking at which side of zero the indicator is
on aids in determining which signals to follow.
For example, if the indicator is above zero,
watch for the MACD to cross above the
signal line to buy. If the MACD is below zero,
the MACD crossing below the signal line may
provide the signal for a possible short trade.
31.
32. Relative
Strength
Index
(RSI) has at least three major uses. The
indicator moves between zero and 100,
plotting recent price gains versus recent
price losses. The RSI levels therefore
help in gauging momentum and trend
strength.
The most basic use of an RSI is as an
overbought and oversold indicator. When RSI
moves above 70, the asset is considered
overbought and could decline. When the RSI
is below 30, the asset is oversold and could
rally. However, making this assumption is
dangerous; therefore, some traders wait for
the indicator to rise above 70 and then drop
below before selling, or drop below 30 and
then rise back above before buying.
Divergence is another use of the RSI. When
the indicator is moving in a different direction
than the price, it shows that the current price
trend is weakening and could soon reverse.
33.
34. Stochastic
Oscillator
It is an indicator that measures the
current price relative to the price range
over a number of periods. Plotted
between zero and 100, the idea is that,
when the trend is up, the price should be
making new highs. In a downtrend, the
price tends to make new lows.
The stochastic moves up and down relatively
quickly as it is rare for the price to make
continual highs, keeping the stochastic near,
100 or continual lows, keeping the stochastic
near zero. Therefore, the stochastic is often
used as an overbought and oversold
indicator. Values above 80 are considered
overbought, while levels below 20 are
considered oversold.
35.
36. Technical Analysis
Strategies
(Choosing the Right Approach)
There are generally two
different ways to approach
technical analysis: the top-down
approach and the bottom-up
approach. Often, short-term
traders will take a top-down
approach and long-term
investors will take a bottom-up
approach. In addition to this,
there are five core steps to
getting started with technical
analysis.
37. The top-down
approach is a
macroeconomic
analysis that looks at
the overall economy
before focusing on
individual securities. A
trader would first
focus on economies,
then sectors, and then
companies in the case
of stocks.
The bottom-up
approach focuses on
individual stocks as
opposed to a
macroeconomic view.
It involves analyzing a
stock that appears
fundamentally
interesting for
potential entry and
exit points.
Top-Down Bottom-Up
38. Five Core Steps to get start with
Technical Analysis
01 02 03 04 05
Pick a Strategy
or Develop a
Trading System
Identify
Securities
Find the Right
Brokerage
Track and
Monitor Trades
Use Additional
Software or
Tools
39. Thank you!
Sources:
TECHNICAL ANALYSIS PART 1 -
ppt download (slideplayer.com)
Top 7 Technical Analysis Tools
(investopedia.com)
What are the main objectives of
technical analysis? - Quora
Technical Analysis for Stocks:
Beginners Overview
(investopedia.com)