Downloaded 57 times


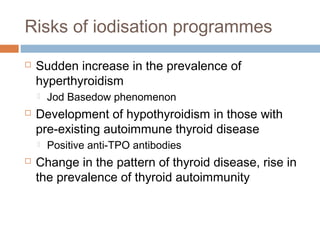
![Are iodine levels falling?
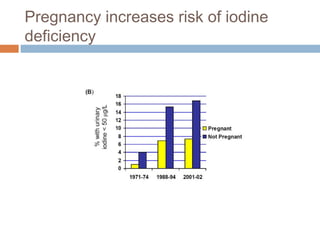
Figure 1. (A) Median U.S. urinary iodine concentrations in
males and females, 1971-2002 (B) Median U.S. urinary
iodine concentrations in pregnant and non-pregnant women
of child-bearing age (15- 44 years old), 1971-2002.
[Adapted from Hollowell et al, JCEM 1998; 83:3401-8 & Caldwell et al,
Thyroid 2005;15:692-9]](https://image.slidesharecdn.com/preventionagainstmicronutrientmalnutrition-140523082513-phpapp02/85/Prevention-against-micronutrient-malnutrition-19-320.jpg)
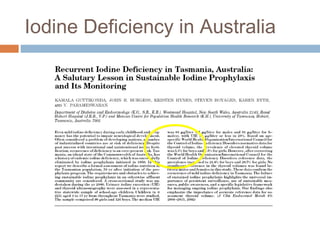

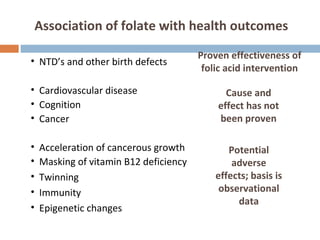
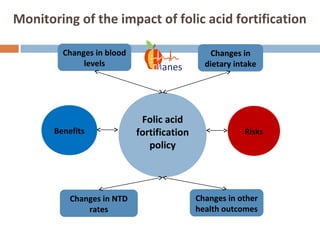


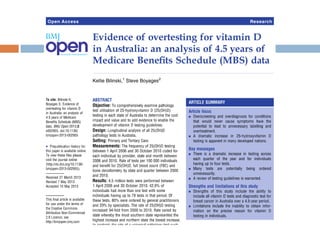


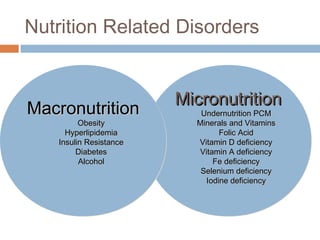
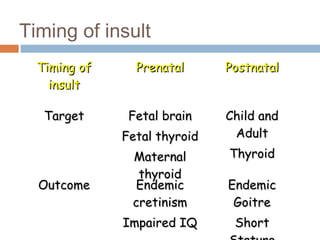
The document discusses the significance of preventing micronutrient malnutrition, focusing on iodine, folic acid, and vitamin D deficiencies, and their widespread health impacts, particularly in developing countries. It highlights the risks of iodine deficiency disorders (IDD) affecting millions globally and outlines the critical role of adequate iodine intake for fetal and childhood brain development. Additionally, it emphasizes the success of public health interventions like folic acid fortification while acknowledging the need for comprehensive measures to ensure optimal dietary intake of essential nutrients.


