Download to read offline


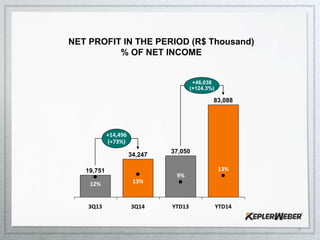


- Kepler Weber reported record quarterly performance in 3Q14, with net revenues increasing 52.4% and net income growing 72.7% compared to the previous year. - EBITDA increased 63.3% to R$58.4 million, with an industry-leading margin of 22.9%. Cash generation also improved significantly compared to 3Q13. - For the first nine months of 2014, net income grew 124.3% to R$83.1 million due to strong operating results and productivity gains. EBITDA increased 91.5% to R$137.8 million over the same period in 2013.


