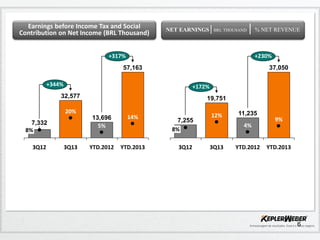
Earnings before IncomeTax and Social
Contribution on Net Income (BRL Thousand)
NET EARNINGS│BRL THOUSAND │ % NET REVENUE
+317%
+230%
57,163
37,050
+344%
+172%
32,577
19,751
20%
13,696
5%
7,332
8%
3Q12
3Q13
14%
YTD.2012
YTD.2013
7,255
8%
3Q12
12%
11,235
4%
3Q13
YTD.2012
9%
YTD.2013
6
7.
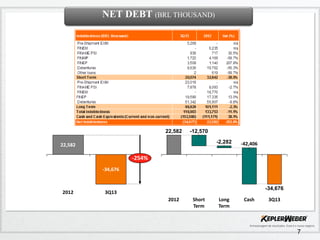
NET DEBT (BRLTHOUSAND)
22,582
-12,570
-2,282
22,582
-42,406
-254%
-34,676
2012
-34,676
3Q13
2012
Short
Term
Long
Term
Cash
3Q13
7
8.
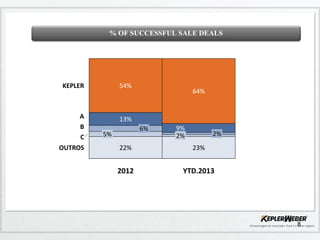
% OF SUCCESSFULSALE DEALS
KEPLER
54%
A
B
C
13%
OUTROS
64%
6%
5%
9%
2%
2%
22%
23%
2012
YTD.2013
8
9.
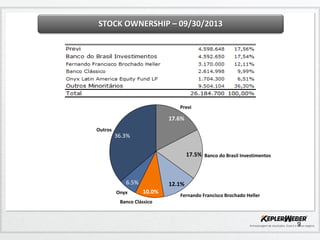
STOCK OWNERSHIP –09/30/2013
Previ
17.6%
Outros
36.3%
17.5% Banco do Brasil Investimentos
6.5%
Onyx
12.1%
10.0%
Fernando Francisco Brochado Heller
Banco Clássico
9