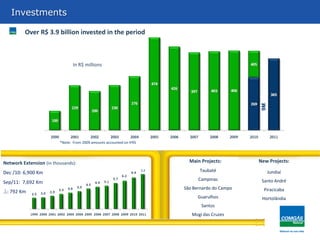
1
Financial Results
September 2011
2
Highlights
792 km network built since the beginning of the year;
More than 118,000 UDA's connected in 12 months;
Volume of gas in the residential segment was 12.3% higher than 9M10;
9.8% increase in the number of meters compared to 9M10;
Disbursement of $ 365 million for investment in expansion; and
Approval of R$ 417.8 million as shareholder remuneration.
3
Volume per Segment
3Q11 2Q11 3Q10
∆
3Q11/2Q11
∆
3Q11/3Q10
9M11 9M10
∆
9M11/9M10
53,289 48,400 46,958 10.10% 13.48% RESIDENTIAL 134,629 119,893 12.29%
28,822 27,008 26,396 6.72% 9.19% COMMERCIAL 80,279 74,490 7.77%
991,916 983,661 946,873 0.84% 4.76% INDUSTRIAL 2,918,080 2,780,285 4.96%
762 6,326 117,238 -87.95% -99.35% THERMAL GENERATION 45,405 168,723 -73.09%
83,530 82,779 91,217 0.91% -8.43% COGENERATION 258,201 238,711 8.16%
73,313 75,124 76,593 -2.41% -4.28% NGV 215,079 240,622 -10.62%
1,231,632 1,223,298 1,305,275 0.68% -5.64% 3,651,673 3,622,724 0.80%
13.4 13.4 12.9 0.04% 3.61% Mi m³/day* 13.2 12.7 4.41%
In thousand M3
4
Meters per Segment
* UDAs (Householders)
Sep/11 Jun/11 Sep/10
∆
Sep11/Jun11
∆
Sep11/Sep10
808,314 790,047 735,967 RESIDENTIAL 2.31% 9.83%
1,063,364 1,031,610 945,327 UDAs* 3.08% 12.49%
10,206 10,014 9,568 COMMERCIAL 1.92% 6.67%
1,002 998 974 INDUSTRIAL 0.40% 2.87%
2 2 2 THERMAL GENERATION 0.00% 0.00%
23 24 20 COGENERATION -4.17% 15.00%
360 363 373 NGV -0.83% -3.49%
819,907 801,448 746,904 2.30% 9.77%
5
Volume x Margin
2010
9M11
3,623 3,652
1,676
2,243
2,952
3,418
3,812
4,342
4,761
5,069 5,253
4,261
4,910
2000 2001 2002 2003 2004 2005 2006 2007 2008 2009 2010 2011
Volume
6
Key Financial Figures – Millions of m³
9M
107
177
347 330
549
668
860
925
1,035
838
934
727
600
1,363
1,188
913
835
2000 2001 2002 2003 2004 2005 2006 2007 2008 2009 2010 9M10 9M11
EBITDA
7
Key Financial Figures – BRL million
Considers impact of IFRS adoption
45 64
108 103
242
319
427 443
514
368
413
333
201
690
580
453
352
2000 2001 2002 2003 2004 2005 2006 2007 2008 2009 2010 9M10 9M11
Net Income
8
Considers impact of IFRS adoption
Key Financial Figures – BRL million
Fornecimento de Gás Natural: CONTRATOSNatural Gas Supply
Firm GSA: Comgás buys natural gas from Petrobras and distributes to existing markets receiving its distribution margin. the Natural Gas
couldn’t be interrupted;
Firm Flexible Agreement: under this type of agreement, Petrobras supplies natural gas or indemnifies clients for the additional costs
incurred due to the consumption of an alternative fuel. Gas supply may be interrupted at the discretion of Petrobras, but with no risk of
supply cuts for Comgás consumers. Petrobras will also bear the cost of the financial impacts incurred by Comgás and the clients in
question;
10
Financial Results
In BRL thousand
1,097,862 1,011,469 1,084,078 8.54% 1.27% 3,034,676 3,045,127 -0.34%
-814,483 -705,066 -642,142 15.52% 26.84% -2,163,474 -1,898,412 13.96%
283,379 306,403 441,936 -7.51% -35.88% 871,202 1,146,715 -24.03%
-96,867 -85,203 -85,822 13.69% 12.87% -270,494 -229,056 18.09%
219 -122 -4,969 N.A. N.A. -519 -4,963 N.A.
186,731 221,078 351,145 -15.54% -46.82% 600,189 912,696 -34.24%
-60,860 -58,756 -52,392 3.58% 16.16% -177,158 -155,726 13.76%
-66,174 -42,875 -37,032 54.34% 78.69% -140,726 -100,690 39.76%
59,697 119,447 261,721 -50.02% -77.19% 282,305 656,280 -56.98%
40,397 92,344 188,335 -56.25% -78.55% 200,984 452,658 -55.60%
According to the last accounting legislation (unaudited figures)
122,469 69,910 102,147 75.18% 19.89% 224,820 186,797 20.36%
311,432 294,184 250,997 5.86% 24.08% 835,311 726,548 14.97%
122,166 139,614 121,536 -12.50% 0.52% 352,183 332,511 5.92%
3Q11 2Q11 3Q10
D
3Q11/2Q11
D
3Q11/3Q10
9M11 9M10
D
9M11/9M10
Net Sales Revenue
Cost of Goods Sold and/ or Services Rendered
GROSS RESULT
Selling General and Adm. Expenses
Other Operating Result
EBTIDA
EBITDA
Depreciation and Amortization
Financial Results
NET INCOME
OPERATING RESULT
NET INCOME
Current Account
3Q11 2Q11 3Q10 9M11 9M10
10.4 10.0 11.7 Equity per Share ($) 10.4 11.7
0.3 0.8 1.6 Earnings per Share ($) 1.7 3.8
1.4 1.2 1.0 Net Debt per Equity (x) 1.4 1.0
2.3 1.7 1.0 Net Debt per EBITDA (x) 1.9 1.1
0.7 0.6 0.8 Current Ratio (x) 0.7 0.8
25.8% 30.3% 40.8% Gross Margin (%) 28.7% 37.7%
3.7% 9.1% 17.4% Net Margin (%) 6.6% 14.9%
17.0% 21.9% 32.4% EBITDA Margin (%) 19.8% 30.0%
3.8% 9.4% 19.2% Return on Assets (%) 6.3% 15.4%
13.0% 30.7% 53.8% Return on Equity (%) 21.6% 43.1%
According to the last accountability legislation (unauditaed figures)
40.3% 40.7% 33.6% Gross Margin (%) 39.5% 33.5%
12.1% 15.0% 12.0% Net Margin (%) 12.6% 11.6%
30.7% 31.5% 24.7% EBITDA Margin (%) 29.8% 25.3%
11
Financial Indicators
1,533
In BRL Million
TotalIndebtedness
Estrutura de Endividamento
Aging
Indebtedness Composition
In BRL million
Indebtedness Structure
1,864
D = 111
Evolução do Saldo do Conta Corrente
D = 102
D = 73
D = 61
D = 204
D = 17
InR$Millons
D = 123
D = 68
Regulatory Current Account Balance Evolution
D = 32
D = 70
Balance of Gas bill receivables: Cash Effect
D = 123
Investimentos
In R$ millions
Main Projects:Network Extension (in thousands):
Dec /10: 6,900 Km
Sep/11: 7,692 Km
D: 792 Km
New Projects:
Investments
Over R$ 3.9 billion invested in the period
*Note: From 2009 amounts accounted on IFRS
Taubaté
Campinas
São Bernardo do Campo
Guarulhos
Santos
Mogi das Cruzes
Jundiaí
Santo André
Piracicaba
Hortolândia
9M
7.7
11 16
27 25
303
330 334
275 268
427 418
2001 2002 2003 2004 2005 2006 2007 2008 2009 2010 2011
17% 15%
26%
10%
95%
77% 75%
53%
73%
104%
15
Shareholders Remuneration – In BRL Millions
PAY OUT BRGAAP
PAY OUT IFRS
74%
16
Stock Data
BRL Volume traded
Comgás ON
-16.01%
Comgás PNA
-15.04%
-24.50%
Ibovespa
17
The forward-looking statements in this report related to
the outlook for the business, estimated financial and
operating results and growth prospects of COMGAS are
merely projections and, as such, are based exclusively
on management expectations regarding future
performance. These expectations depend substantially
on market conditions and the performance of the
Brazilian economy, the business sector and the
international markets, and are therefore subject to
change without prior notice.
Investor Relations
investidores@comgas.com.br
www.comgas.com.br/en/investors
ROBERTO LAGE
CFO and
IRO
PAULO POLEZI
Treasury and
Investor Relations
RENATA OLIVA
Investor Relations
Rua Olimpíadas nº 205 10º floor – Vila Olímpia – CEP 04551-000 / São Paulo – SP -Brazil

Results presentation 3 q11

  • 1.
  • 2.
    2 Highlights 792 km networkbuilt since the beginning of the year; More than 118,000 UDA's connected in 12 months; Volume of gas in the residential segment was 12.3% higher than 9M10; 9.8% increase in the number of meters compared to 9M10; Disbursement of $ 365 million for investment in expansion; and Approval of R$ 417.8 million as shareholder remuneration.
  • 3.
    3 Volume per Segment 3Q112Q11 3Q10 ∆ 3Q11/2Q11 ∆ 3Q11/3Q10 9M11 9M10 ∆ 9M11/9M10 53,289 48,400 46,958 10.10% 13.48% RESIDENTIAL 134,629 119,893 12.29% 28,822 27,008 26,396 6.72% 9.19% COMMERCIAL 80,279 74,490 7.77% 991,916 983,661 946,873 0.84% 4.76% INDUSTRIAL 2,918,080 2,780,285 4.96% 762 6,326 117,238 -87.95% -99.35% THERMAL GENERATION 45,405 168,723 -73.09% 83,530 82,779 91,217 0.91% -8.43% COGENERATION 258,201 238,711 8.16% 73,313 75,124 76,593 -2.41% -4.28% NGV 215,079 240,622 -10.62% 1,231,632 1,223,298 1,305,275 0.68% -5.64% 3,651,673 3,622,724 0.80% 13.4 13.4 12.9 0.04% 3.61% Mi m³/day* 13.2 12.7 4.41% In thousand M3
  • 4.
    4 Meters per Segment *UDAs (Householders) Sep/11 Jun/11 Sep/10 ∆ Sep11/Jun11 ∆ Sep11/Sep10 808,314 790,047 735,967 RESIDENTIAL 2.31% 9.83% 1,063,364 1,031,610 945,327 UDAs* 3.08% 12.49% 10,206 10,014 9,568 COMMERCIAL 1.92% 6.67% 1,002 998 974 INDUSTRIAL 0.40% 2.87% 2 2 2 THERMAL GENERATION 0.00% 0.00% 23 24 20 COGENERATION -4.17% 15.00% 360 363 373 NGV -0.83% -3.49% 819,907 801,448 746,904 2.30% 9.77%
  • 5.
  • 6.
    3,623 3,652 1,676 2,243 2,952 3,418 3,812 4,342 4,761 5,069 5,253 4,261 4,910 20002001 2002 2003 2004 2005 2006 2007 2008 2009 2010 2011 Volume 6 Key Financial Figures – Millions of m³ 9M
  • 7.
    107 177 347 330 549 668 860 925 1,035 838 934 727 600 1,363 1,188 913 835 2000 20012002 2003 2004 2005 2006 2007 2008 2009 2010 9M10 9M11 EBITDA 7 Key Financial Figures – BRL million Considers impact of IFRS adoption
  • 8.
    45 64 108 103 242 319 427443 514 368 413 333 201 690 580 453 352 2000 2001 2002 2003 2004 2005 2006 2007 2008 2009 2010 9M10 9M11 Net Income 8 Considers impact of IFRS adoption Key Financial Figures – BRL million
  • 9.
    Fornecimento de GásNatural: CONTRATOSNatural Gas Supply Firm GSA: Comgás buys natural gas from Petrobras and distributes to existing markets receiving its distribution margin. the Natural Gas couldn’t be interrupted; Firm Flexible Agreement: under this type of agreement, Petrobras supplies natural gas or indemnifies clients for the additional costs incurred due to the consumption of an alternative fuel. Gas supply may be interrupted at the discretion of Petrobras, but with no risk of supply cuts for Comgás consumers. Petrobras will also bear the cost of the financial impacts incurred by Comgás and the clients in question;
  • 10.
    10 Financial Results In BRLthousand 1,097,862 1,011,469 1,084,078 8.54% 1.27% 3,034,676 3,045,127 -0.34% -814,483 -705,066 -642,142 15.52% 26.84% -2,163,474 -1,898,412 13.96% 283,379 306,403 441,936 -7.51% -35.88% 871,202 1,146,715 -24.03% -96,867 -85,203 -85,822 13.69% 12.87% -270,494 -229,056 18.09% 219 -122 -4,969 N.A. N.A. -519 -4,963 N.A. 186,731 221,078 351,145 -15.54% -46.82% 600,189 912,696 -34.24% -60,860 -58,756 -52,392 3.58% 16.16% -177,158 -155,726 13.76% -66,174 -42,875 -37,032 54.34% 78.69% -140,726 -100,690 39.76% 59,697 119,447 261,721 -50.02% -77.19% 282,305 656,280 -56.98% 40,397 92,344 188,335 -56.25% -78.55% 200,984 452,658 -55.60% According to the last accounting legislation (unaudited figures) 122,469 69,910 102,147 75.18% 19.89% 224,820 186,797 20.36% 311,432 294,184 250,997 5.86% 24.08% 835,311 726,548 14.97% 122,166 139,614 121,536 -12.50% 0.52% 352,183 332,511 5.92% 3Q11 2Q11 3Q10 D 3Q11/2Q11 D 3Q11/3Q10 9M11 9M10 D 9M11/9M10 Net Sales Revenue Cost of Goods Sold and/ or Services Rendered GROSS RESULT Selling General and Adm. Expenses Other Operating Result EBTIDA EBITDA Depreciation and Amortization Financial Results NET INCOME OPERATING RESULT NET INCOME Current Account
  • 11.
    3Q11 2Q11 3Q109M11 9M10 10.4 10.0 11.7 Equity per Share ($) 10.4 11.7 0.3 0.8 1.6 Earnings per Share ($) 1.7 3.8 1.4 1.2 1.0 Net Debt per Equity (x) 1.4 1.0 2.3 1.7 1.0 Net Debt per EBITDA (x) 1.9 1.1 0.7 0.6 0.8 Current Ratio (x) 0.7 0.8 25.8% 30.3% 40.8% Gross Margin (%) 28.7% 37.7% 3.7% 9.1% 17.4% Net Margin (%) 6.6% 14.9% 17.0% 21.9% 32.4% EBITDA Margin (%) 19.8% 30.0% 3.8% 9.4% 19.2% Return on Assets (%) 6.3% 15.4% 13.0% 30.7% 53.8% Return on Equity (%) 21.6% 43.1% According to the last accountability legislation (unauditaed figures) 40.3% 40.7% 33.6% Gross Margin (%) 39.5% 33.5% 12.1% 15.0% 12.0% Net Margin (%) 12.6% 11.6% 30.7% 31.5% 24.7% EBITDA Margin (%) 29.8% 25.3% 11 Financial Indicators
  • 12.
    1,533 In BRL Million TotalIndebtedness Estruturade Endividamento Aging Indebtedness Composition In BRL million Indebtedness Structure 1,864
  • 13.
    D = 111 Evoluçãodo Saldo do Conta Corrente D = 102 D = 73 D = 61 D = 204 D = 17 InR$Millons D = 123 D = 68 Regulatory Current Account Balance Evolution D = 32 D = 70 Balance of Gas bill receivables: Cash Effect D = 123
  • 14.
    Investimentos In R$ millions MainProjects:Network Extension (in thousands): Dec /10: 6,900 Km Sep/11: 7,692 Km D: 792 Km New Projects: Investments Over R$ 3.9 billion invested in the period *Note: From 2009 amounts accounted on IFRS Taubaté Campinas São Bernardo do Campo Guarulhos Santos Mogi das Cruzes Jundiaí Santo André Piracicaba Hortolândia 9M 7.7
  • 15.
    11 16 27 25 303 330334 275 268 427 418 2001 2002 2003 2004 2005 2006 2007 2008 2009 2010 2011 17% 15% 26% 10% 95% 77% 75% 53% 73% 104% 15 Shareholders Remuneration – In BRL Millions PAY OUT BRGAAP PAY OUT IFRS 74%
  • 16.
    16 Stock Data BRL Volumetraded Comgás ON -16.01% Comgás PNA -15.04% -24.50% Ibovespa
  • 17.
    17 The forward-looking statementsin this report related to the outlook for the business, estimated financial and operating results and growth prospects of COMGAS are merely projections and, as such, are based exclusively on management expectations regarding future performance. These expectations depend substantially on market conditions and the performance of the Brazilian economy, the business sector and the international markets, and are therefore subject to change without prior notice.
  • 18.
    Investor Relations investidores@comgas.com.br www.comgas.com.br/en/investors ROBERTO LAGE CFOand IRO PAULO POLEZI Treasury and Investor Relations RENATA OLIVA Investor Relations Rua Olimpíadas nº 205 10º floor – Vila Olímpia – CEP 04551-000 / São Paulo – SP -Brazil