Download to read offline


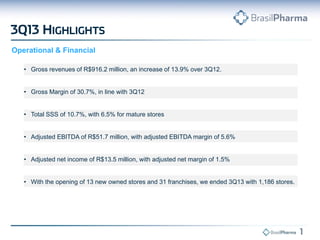
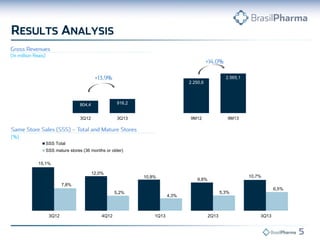

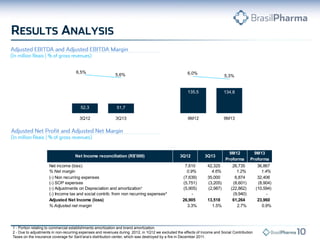

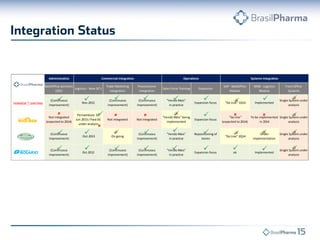


- Brasil Pharma reported gross revenues of R$916.2 million in 3Q13, an increase of 13.9% over 3Q12. Adjusted EBITDA was R$51.7 million with an adjusted EBITDA margin of 5.6%. Adjusted net income was R$13.5 million with an adjusted net margin of 1.5%. - The company ended 3Q13 with 1,186 stores, having opened 13 new owned stores and 31 franchises in the quarter. - Integration of acquired companies is ongoing with administrative, commercial, logistics and systems integration in progress and targeted for completion in 2014.


