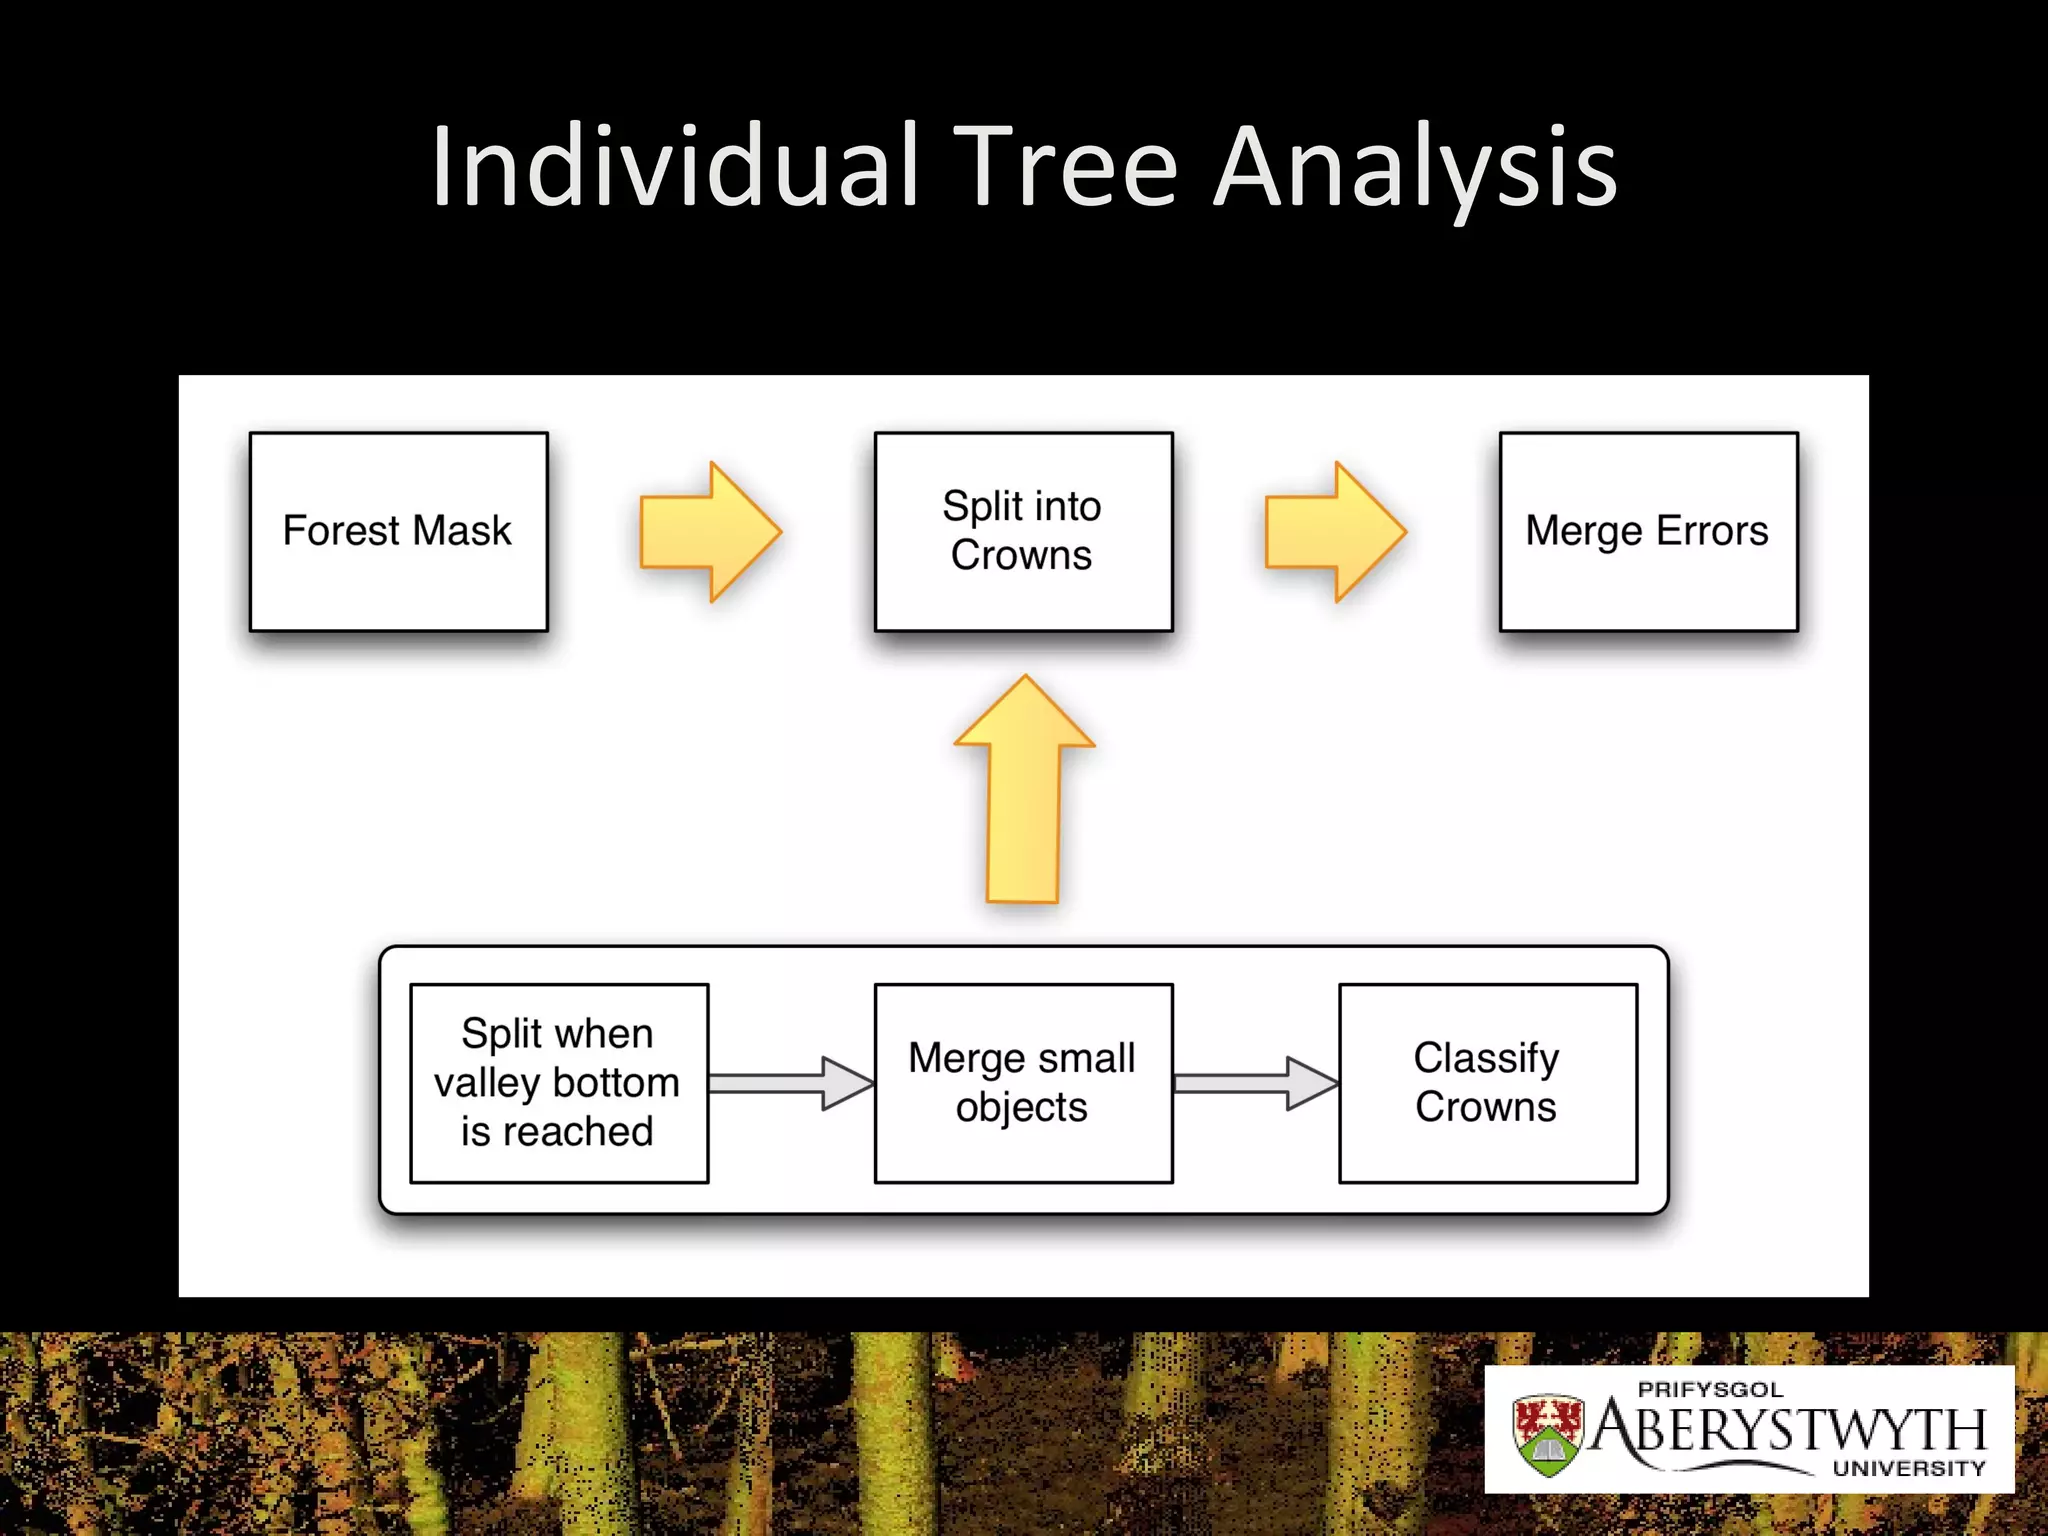
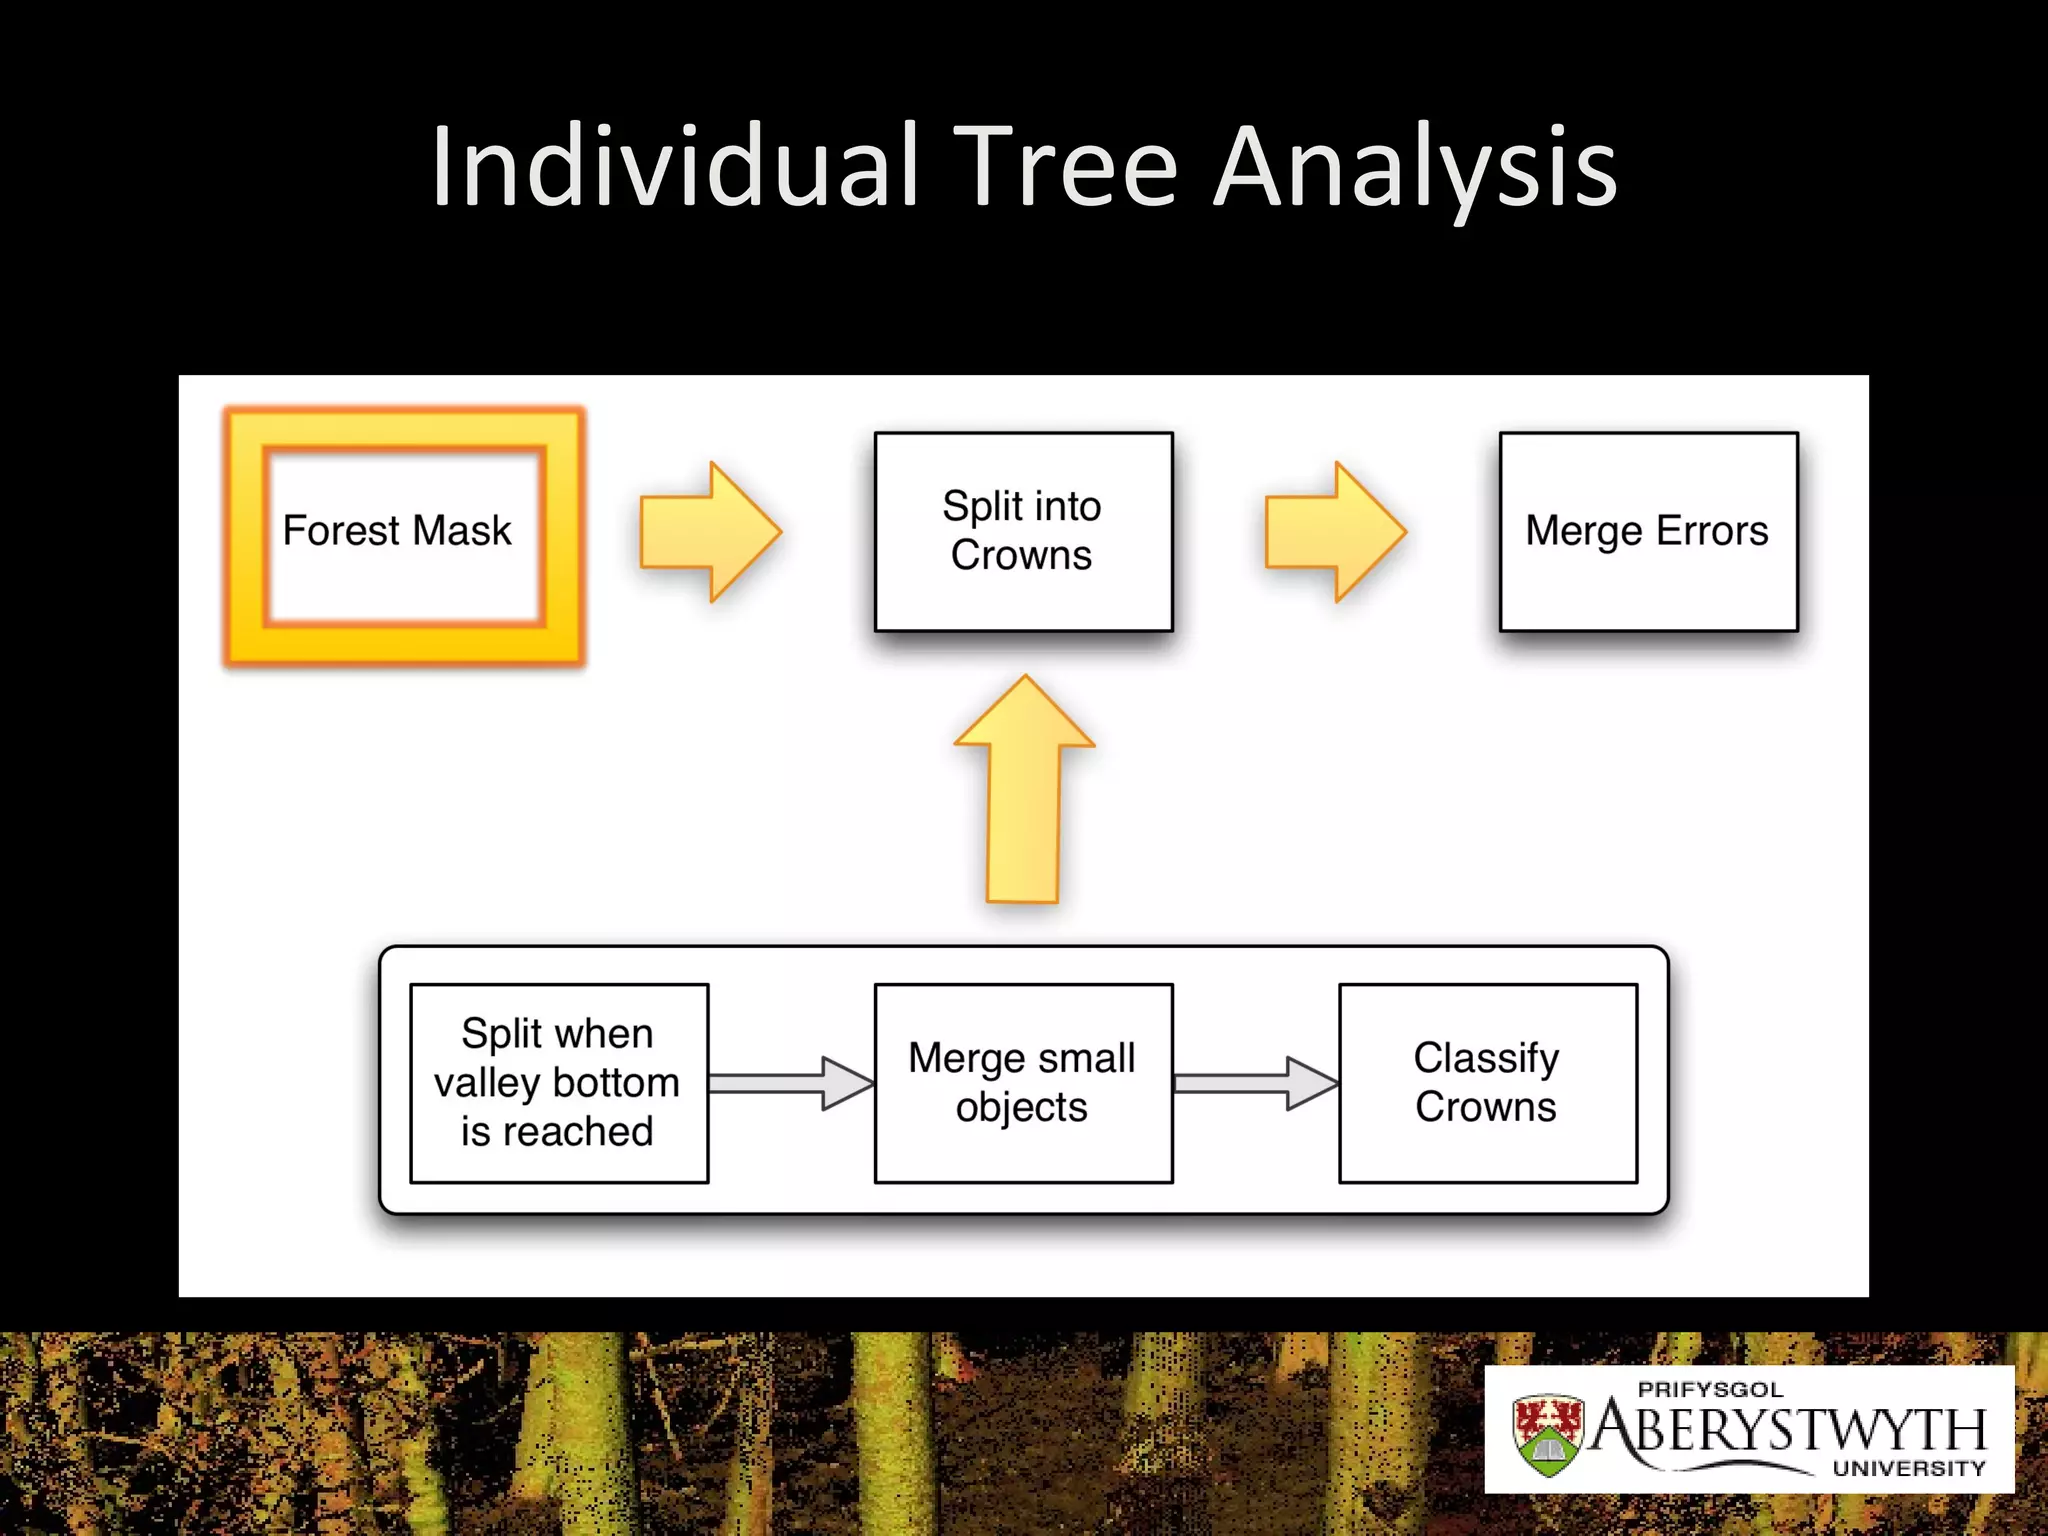
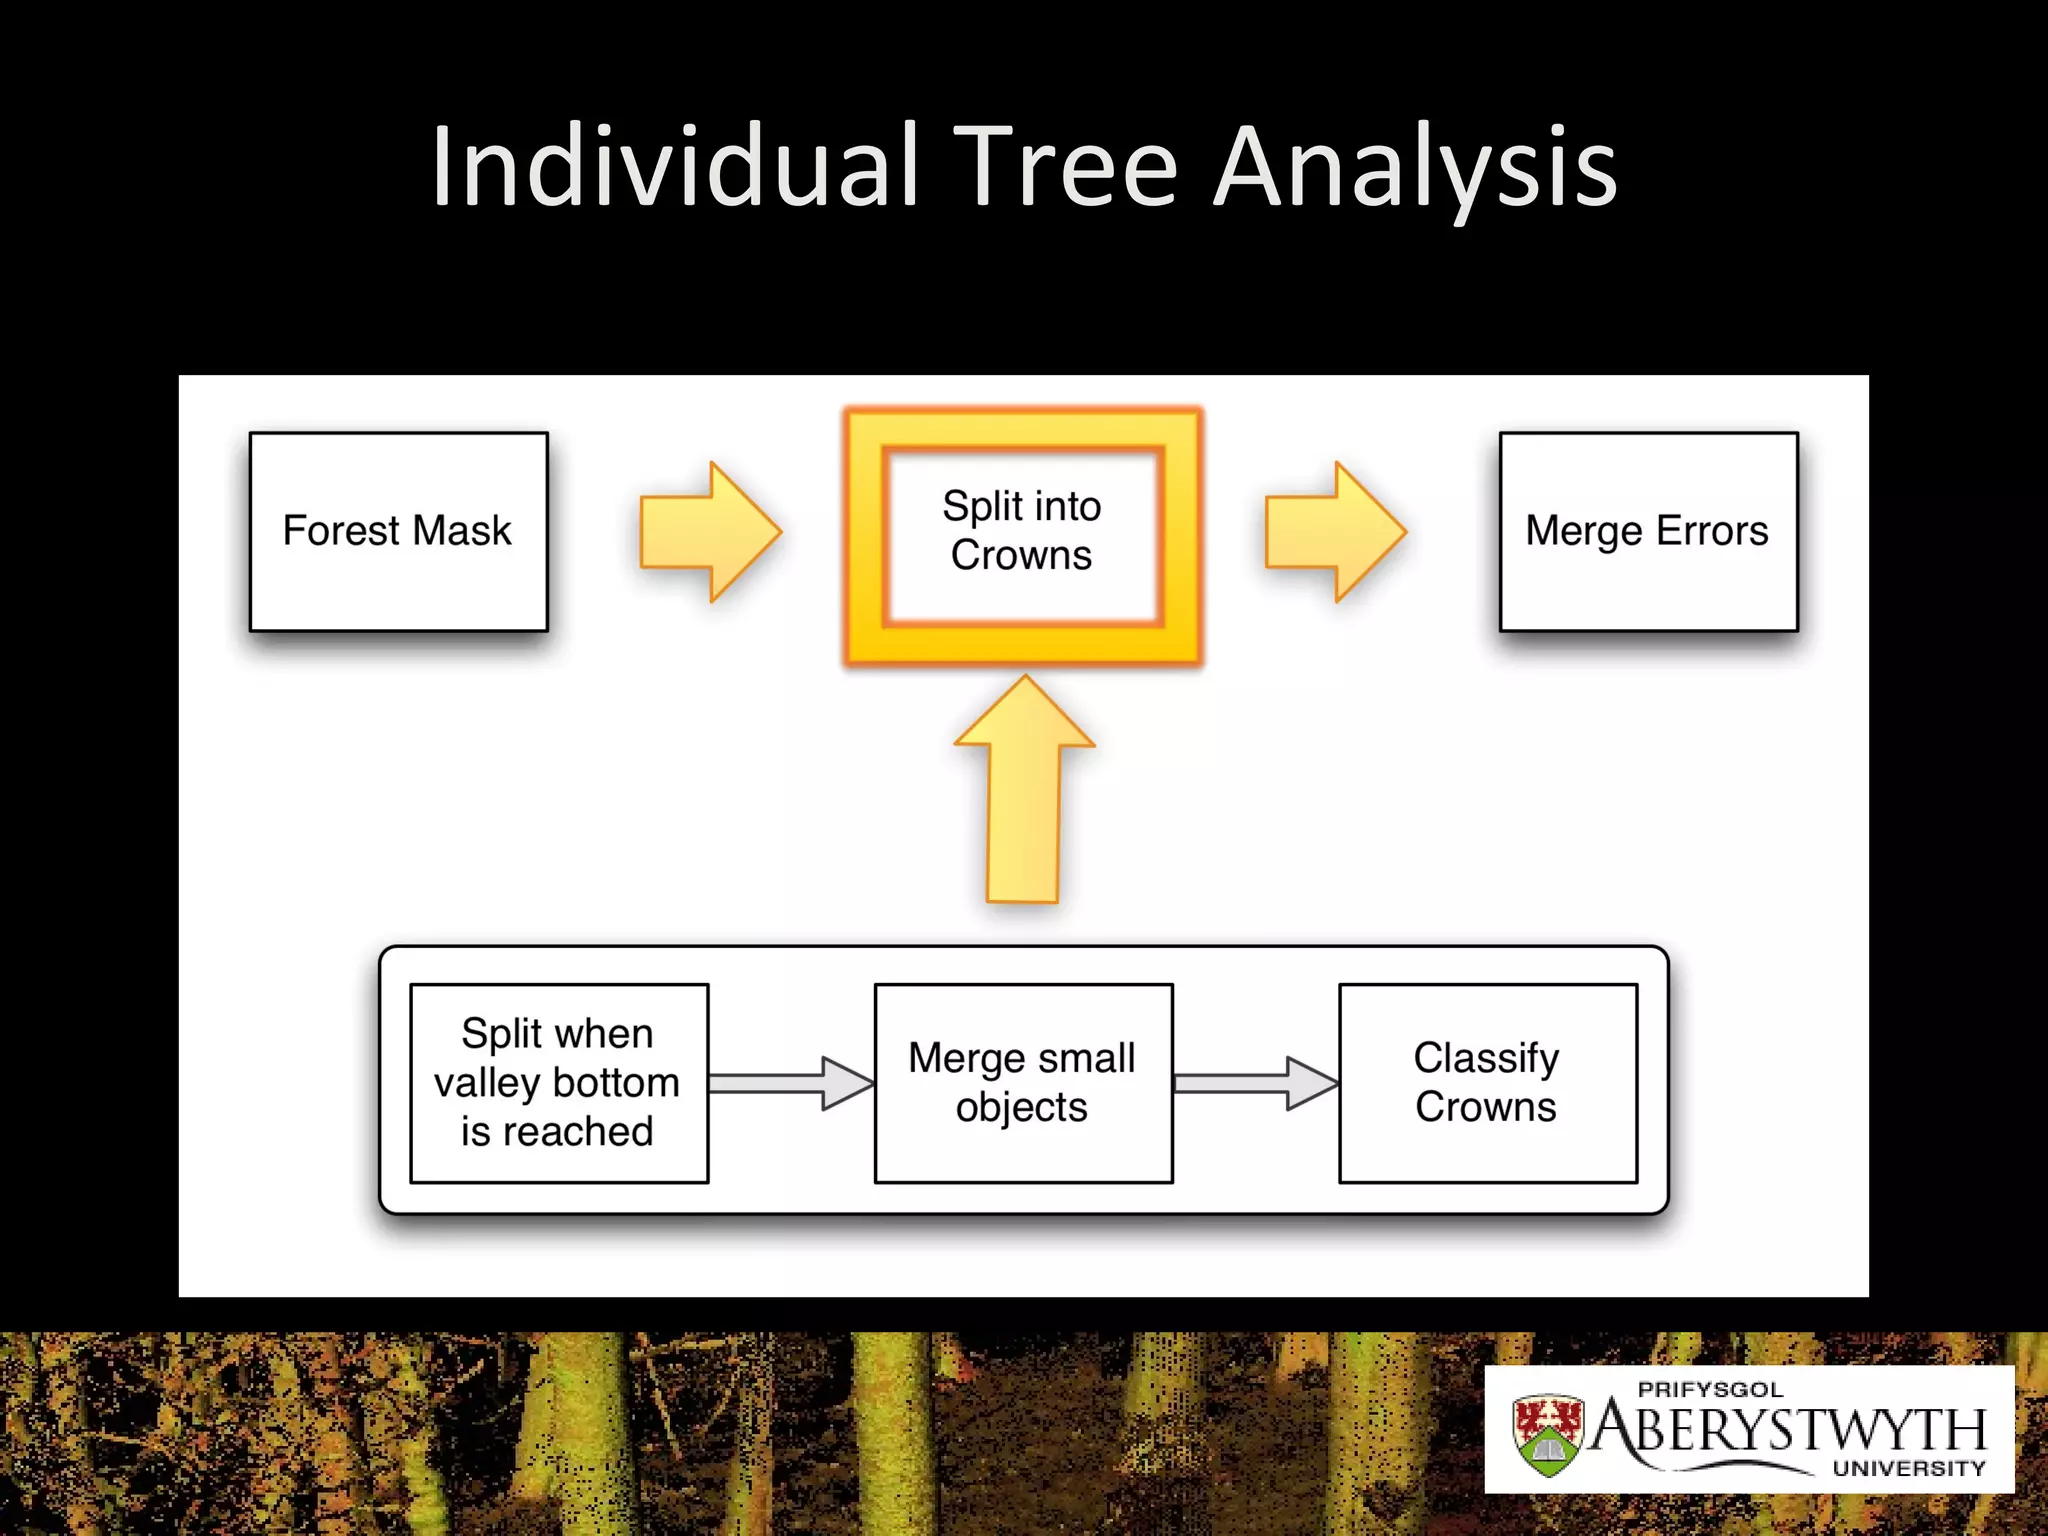
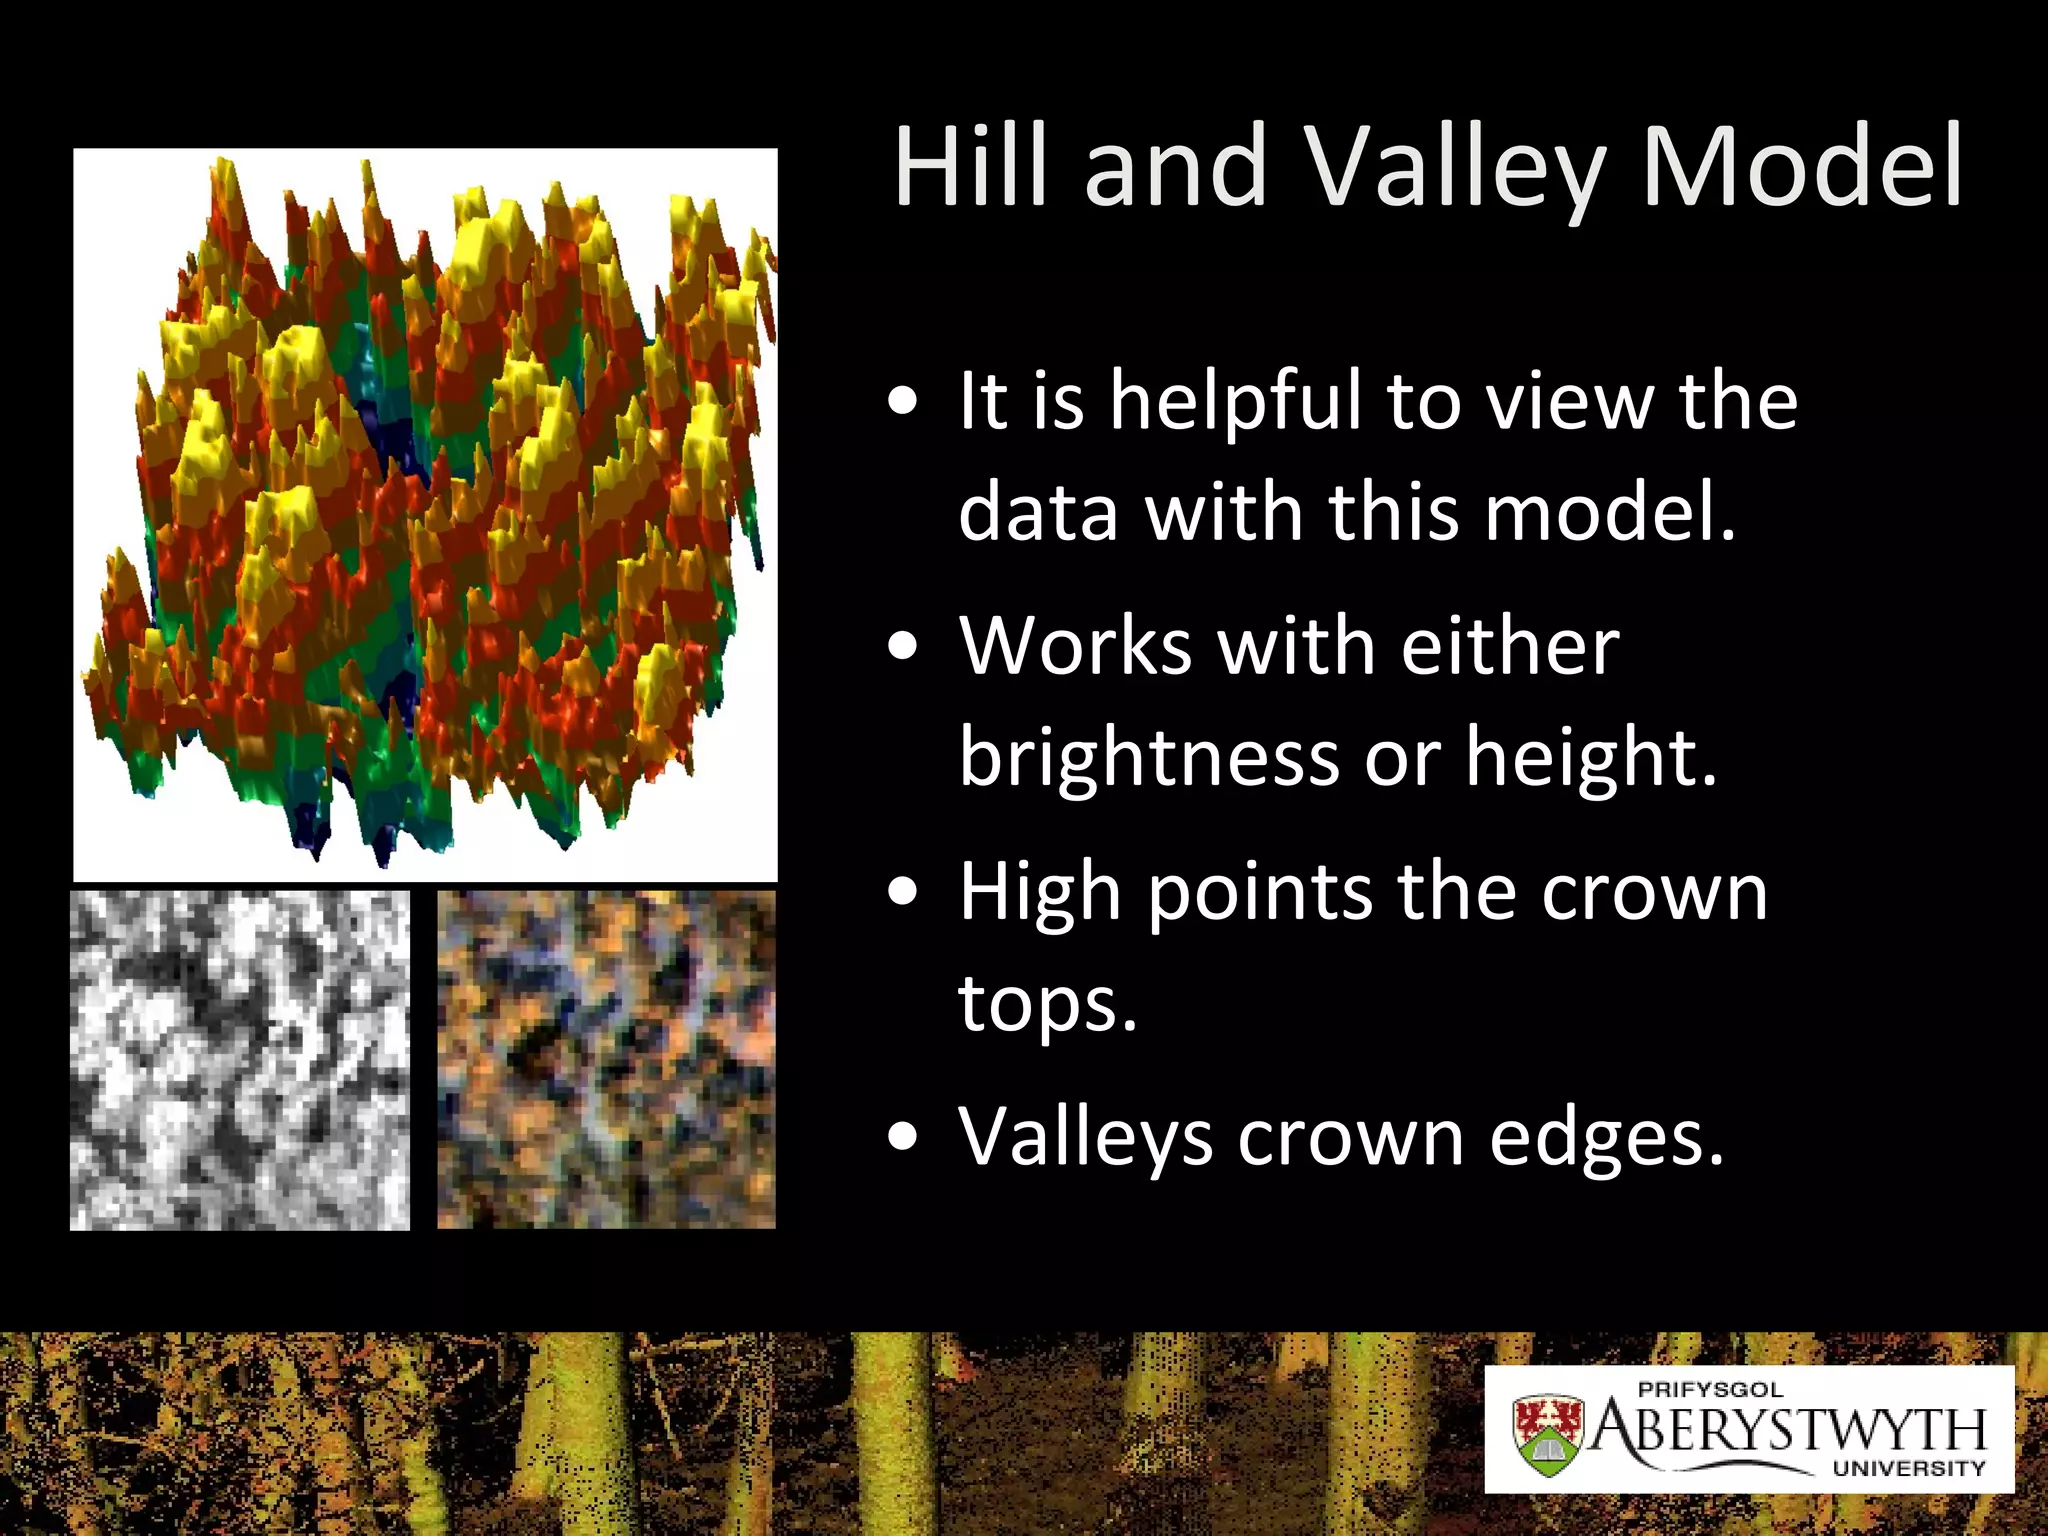
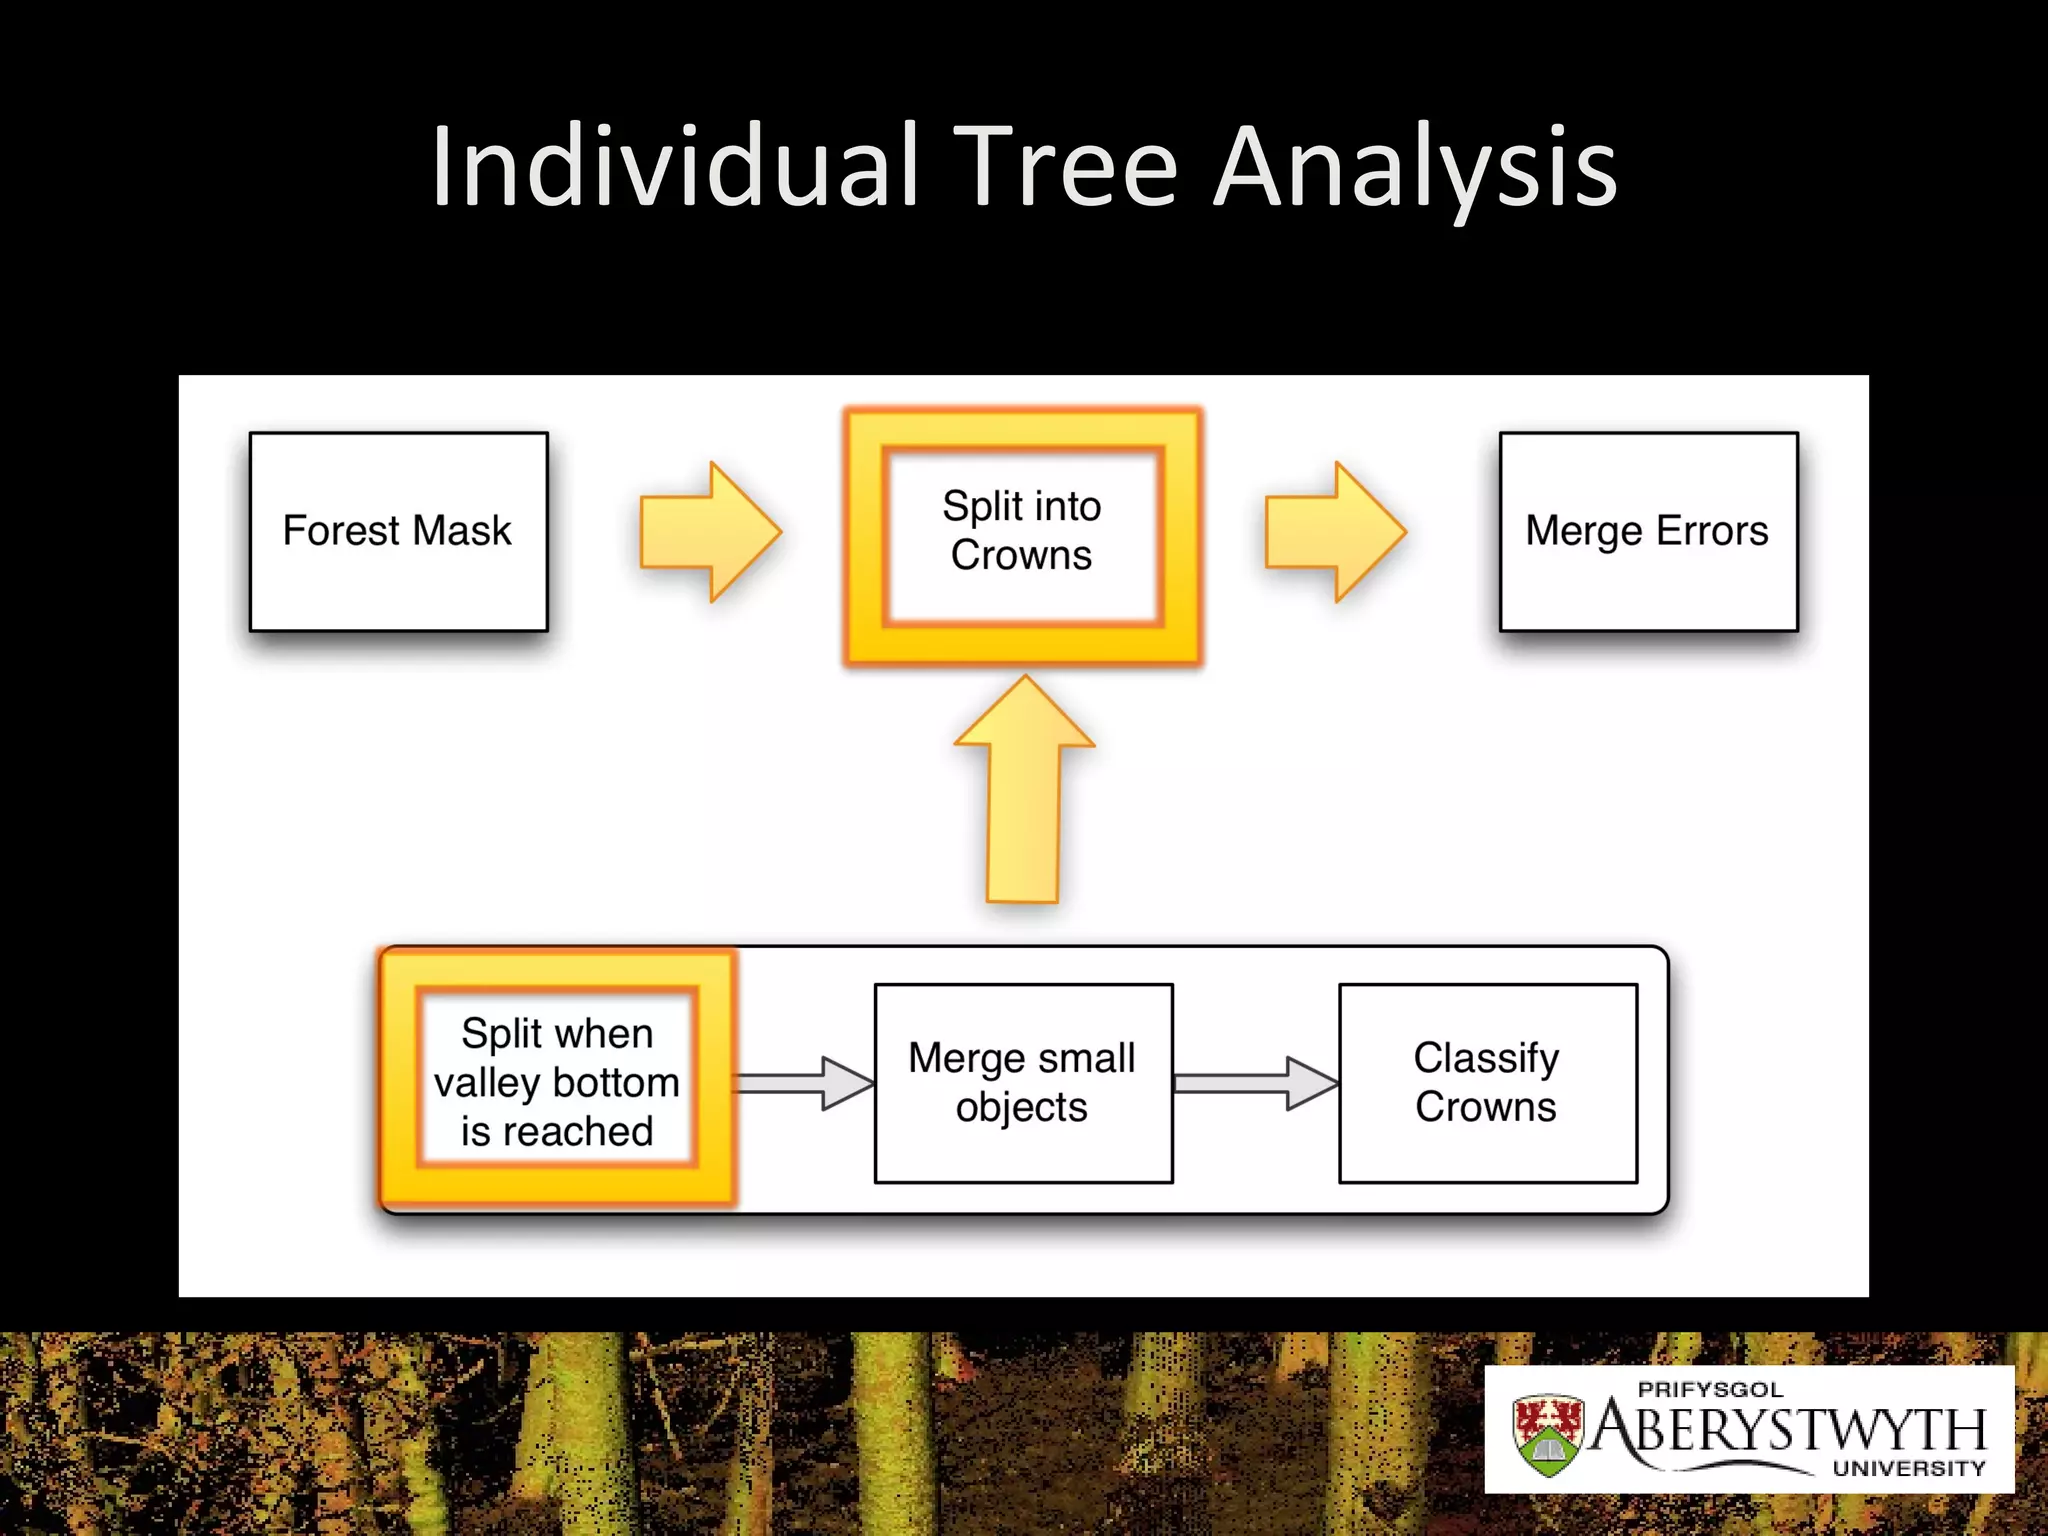
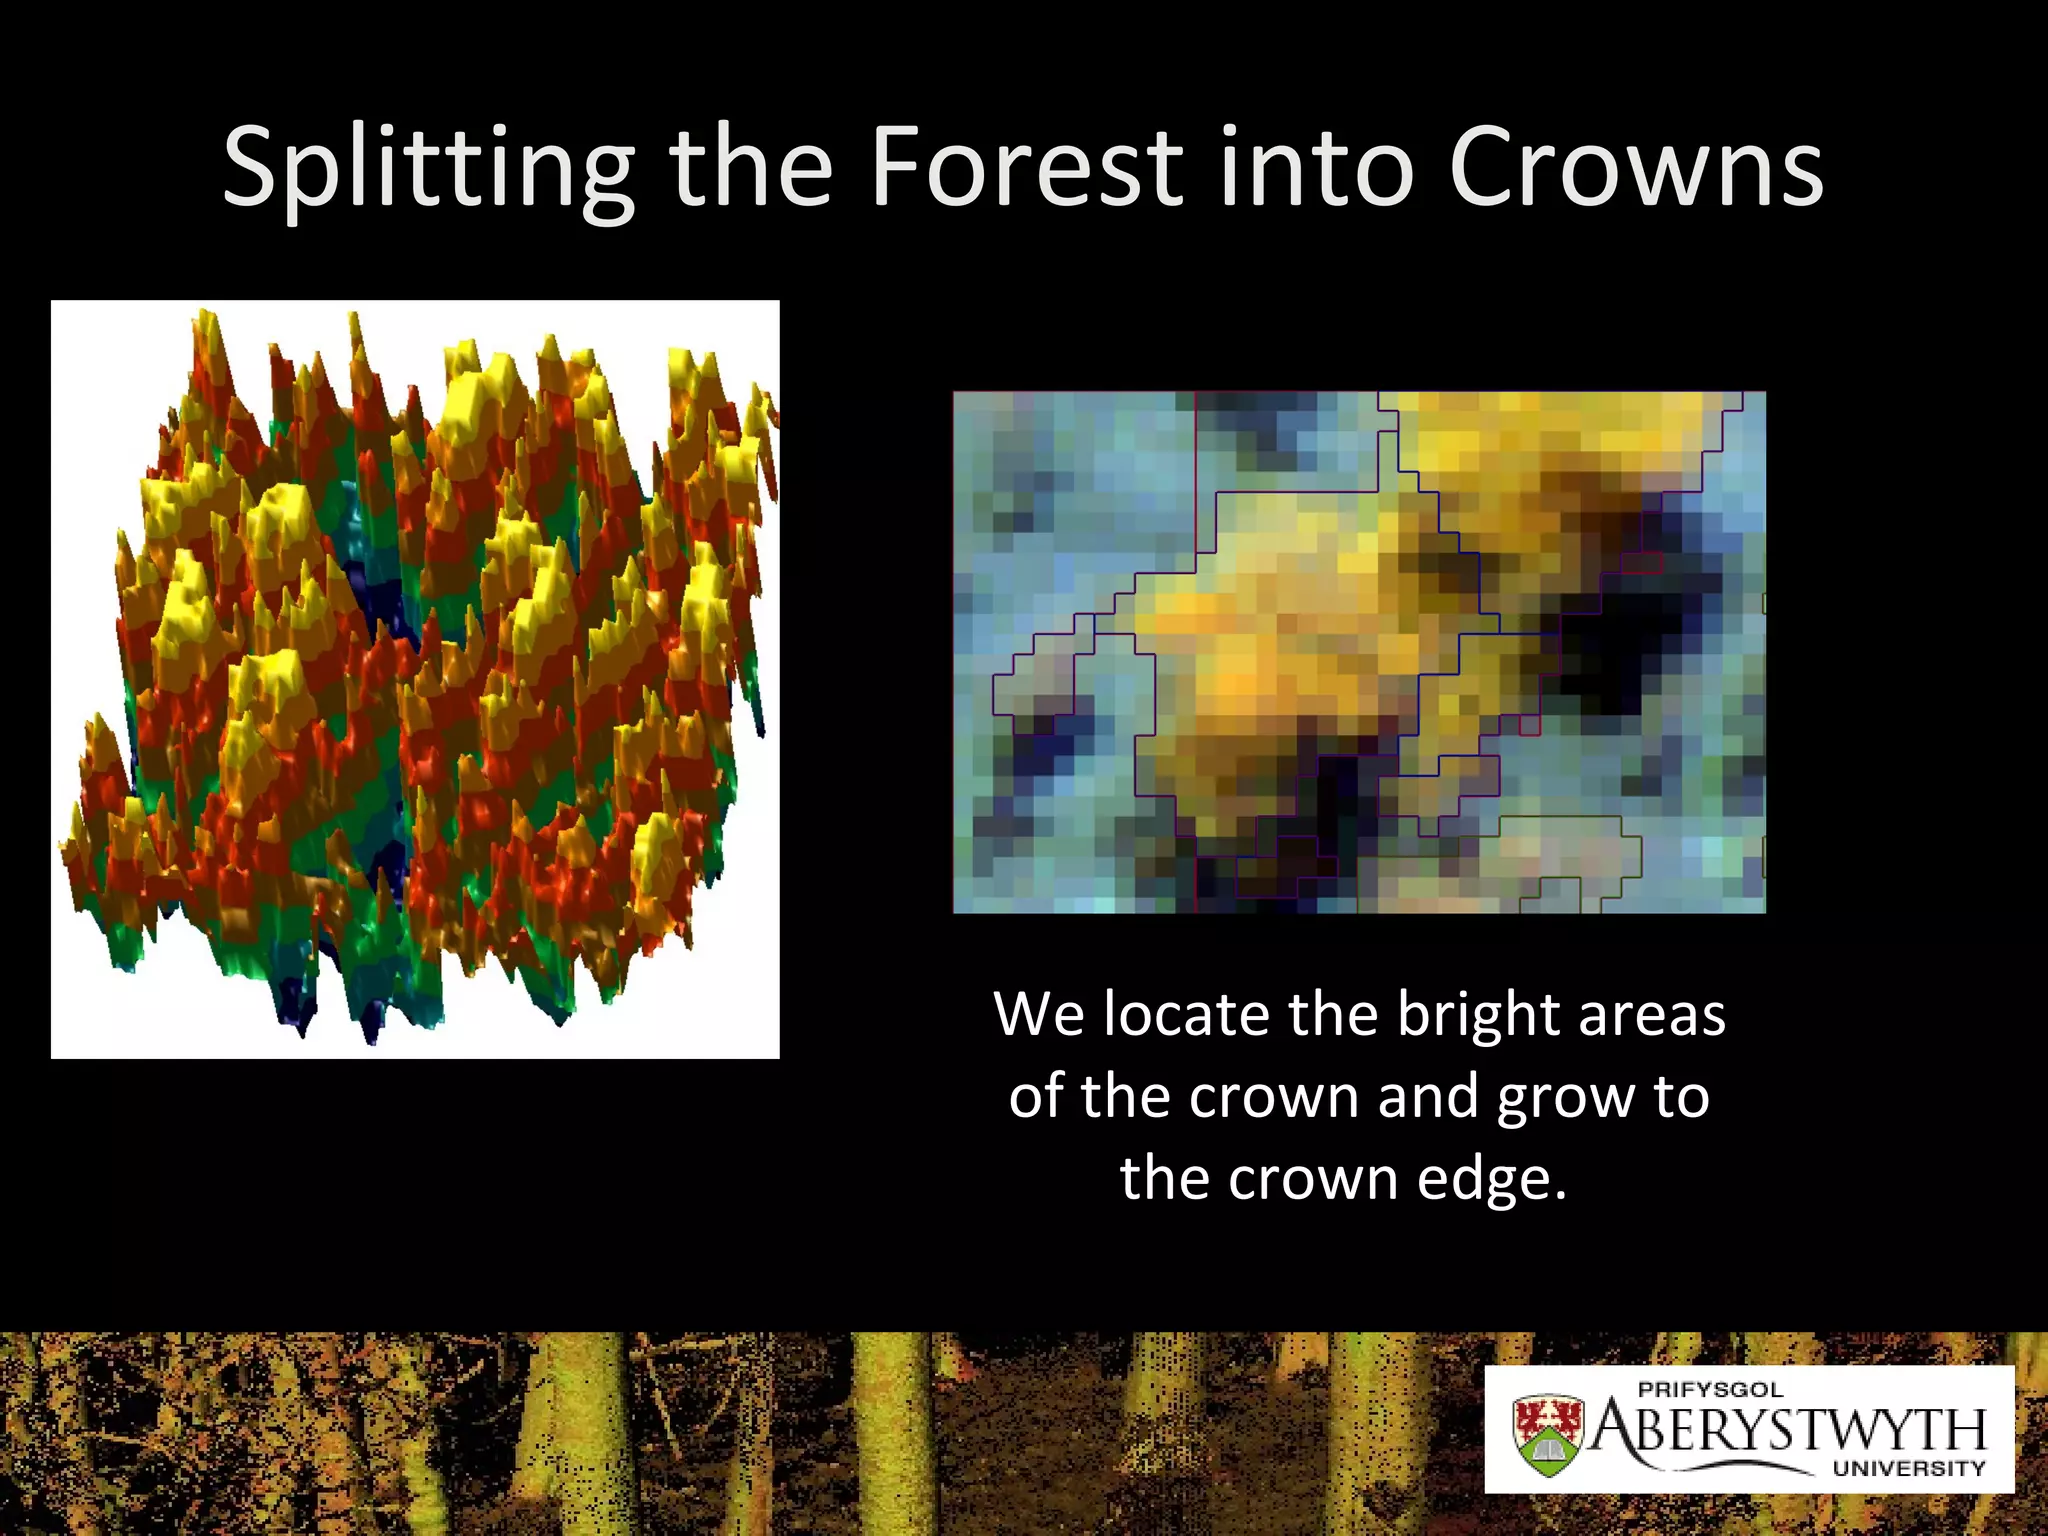
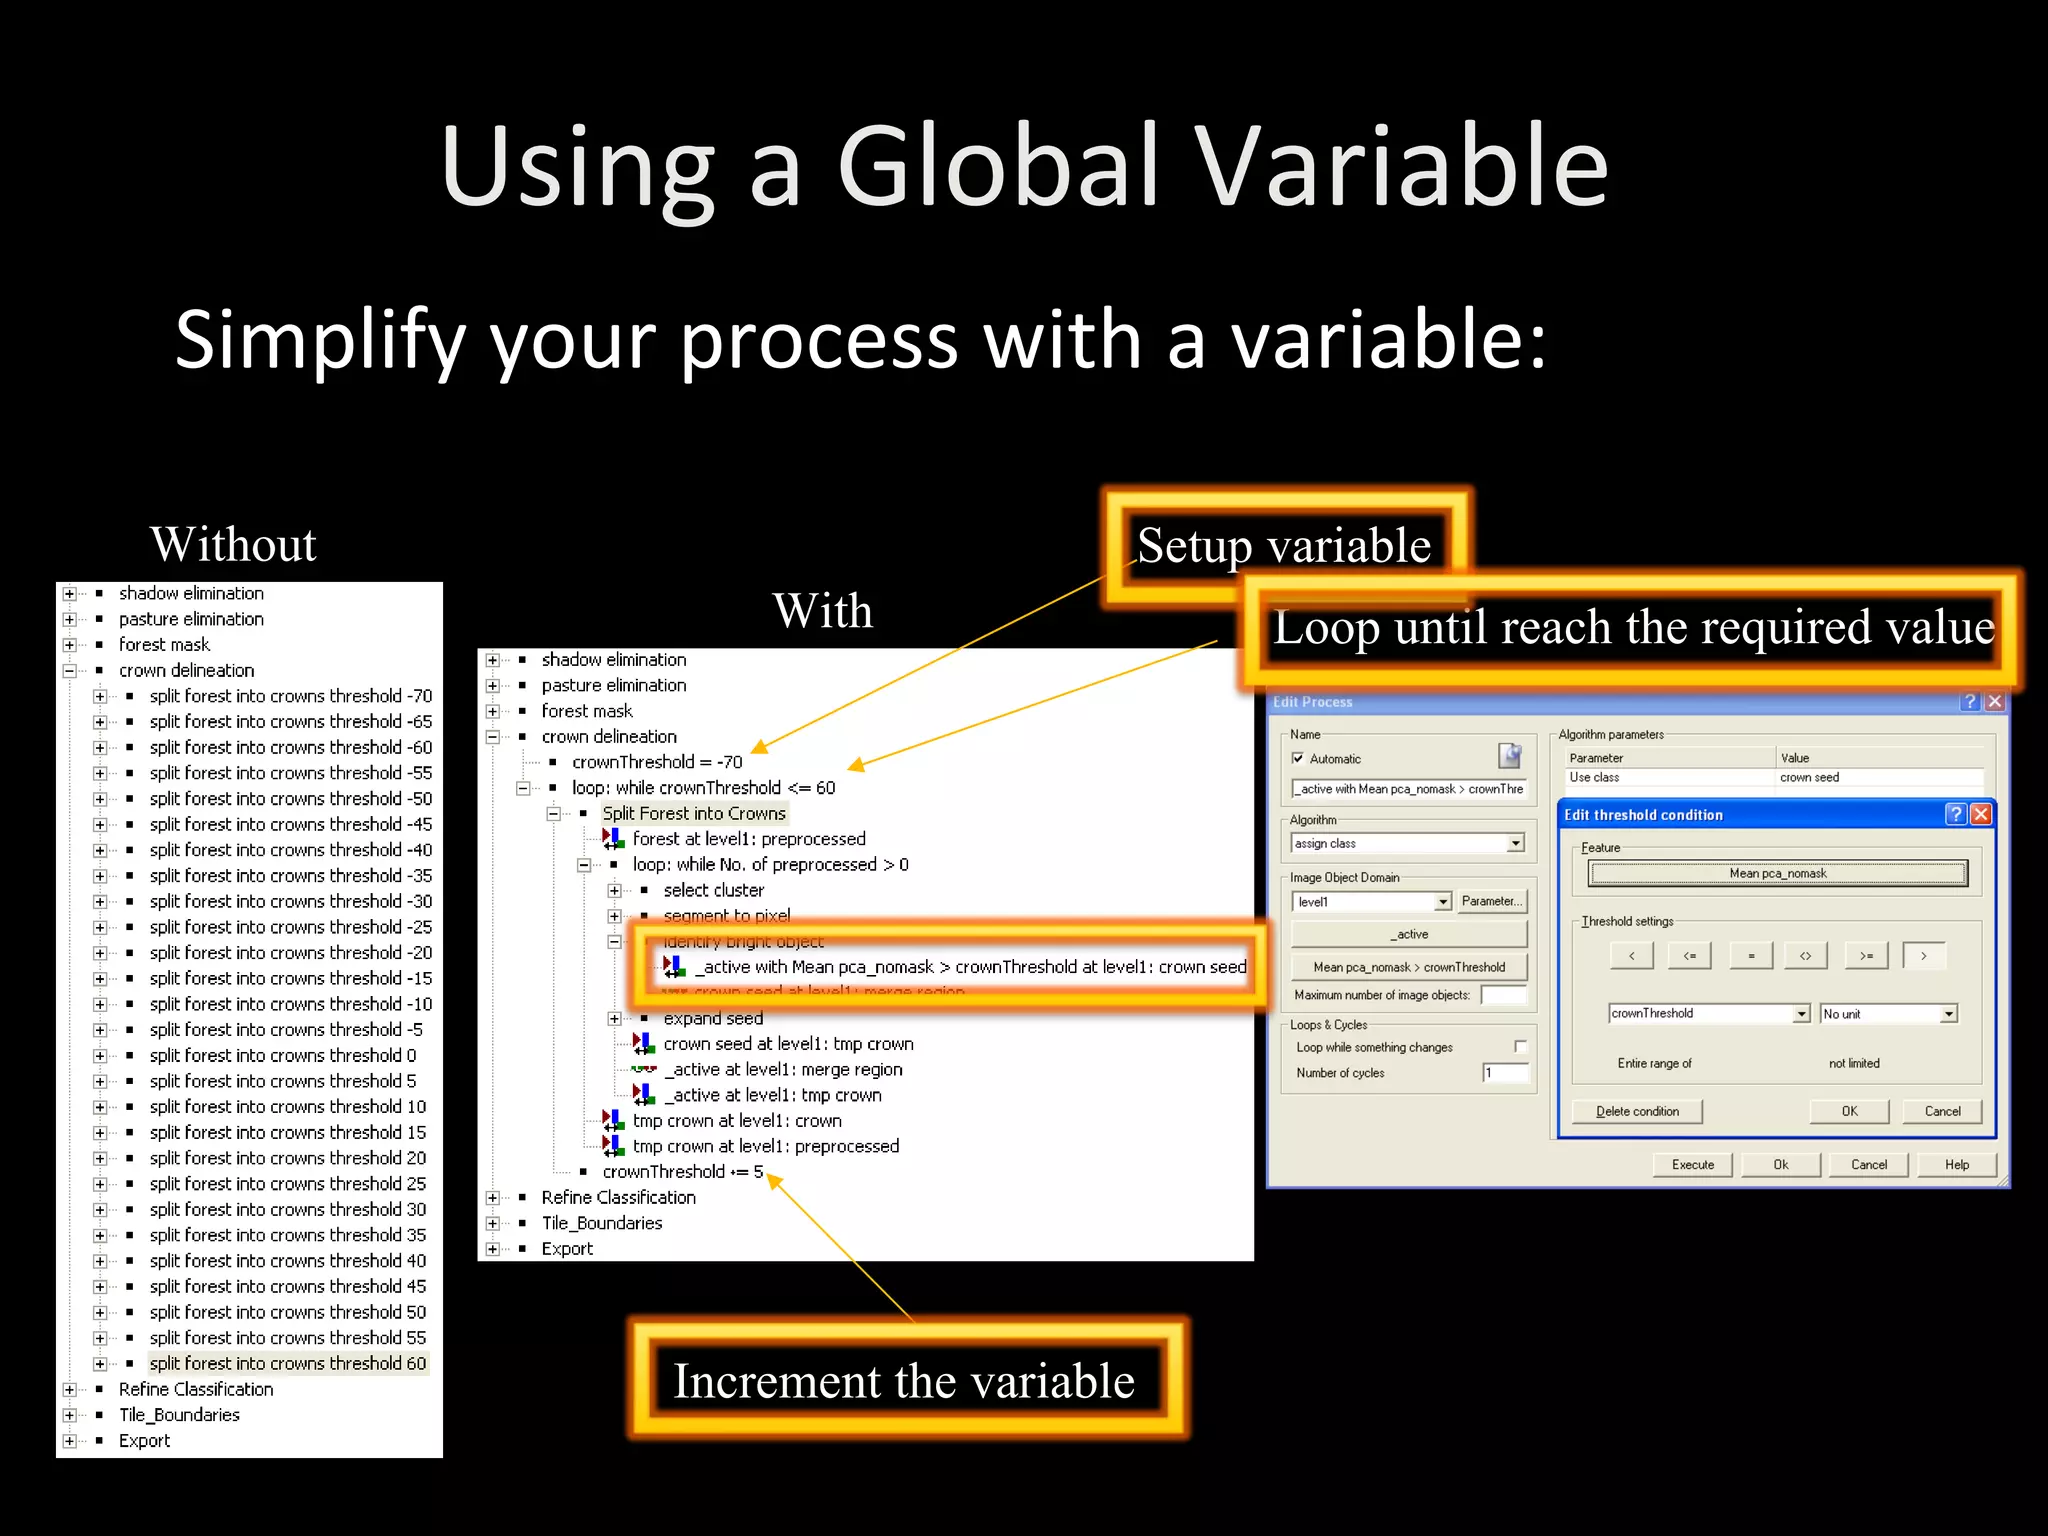
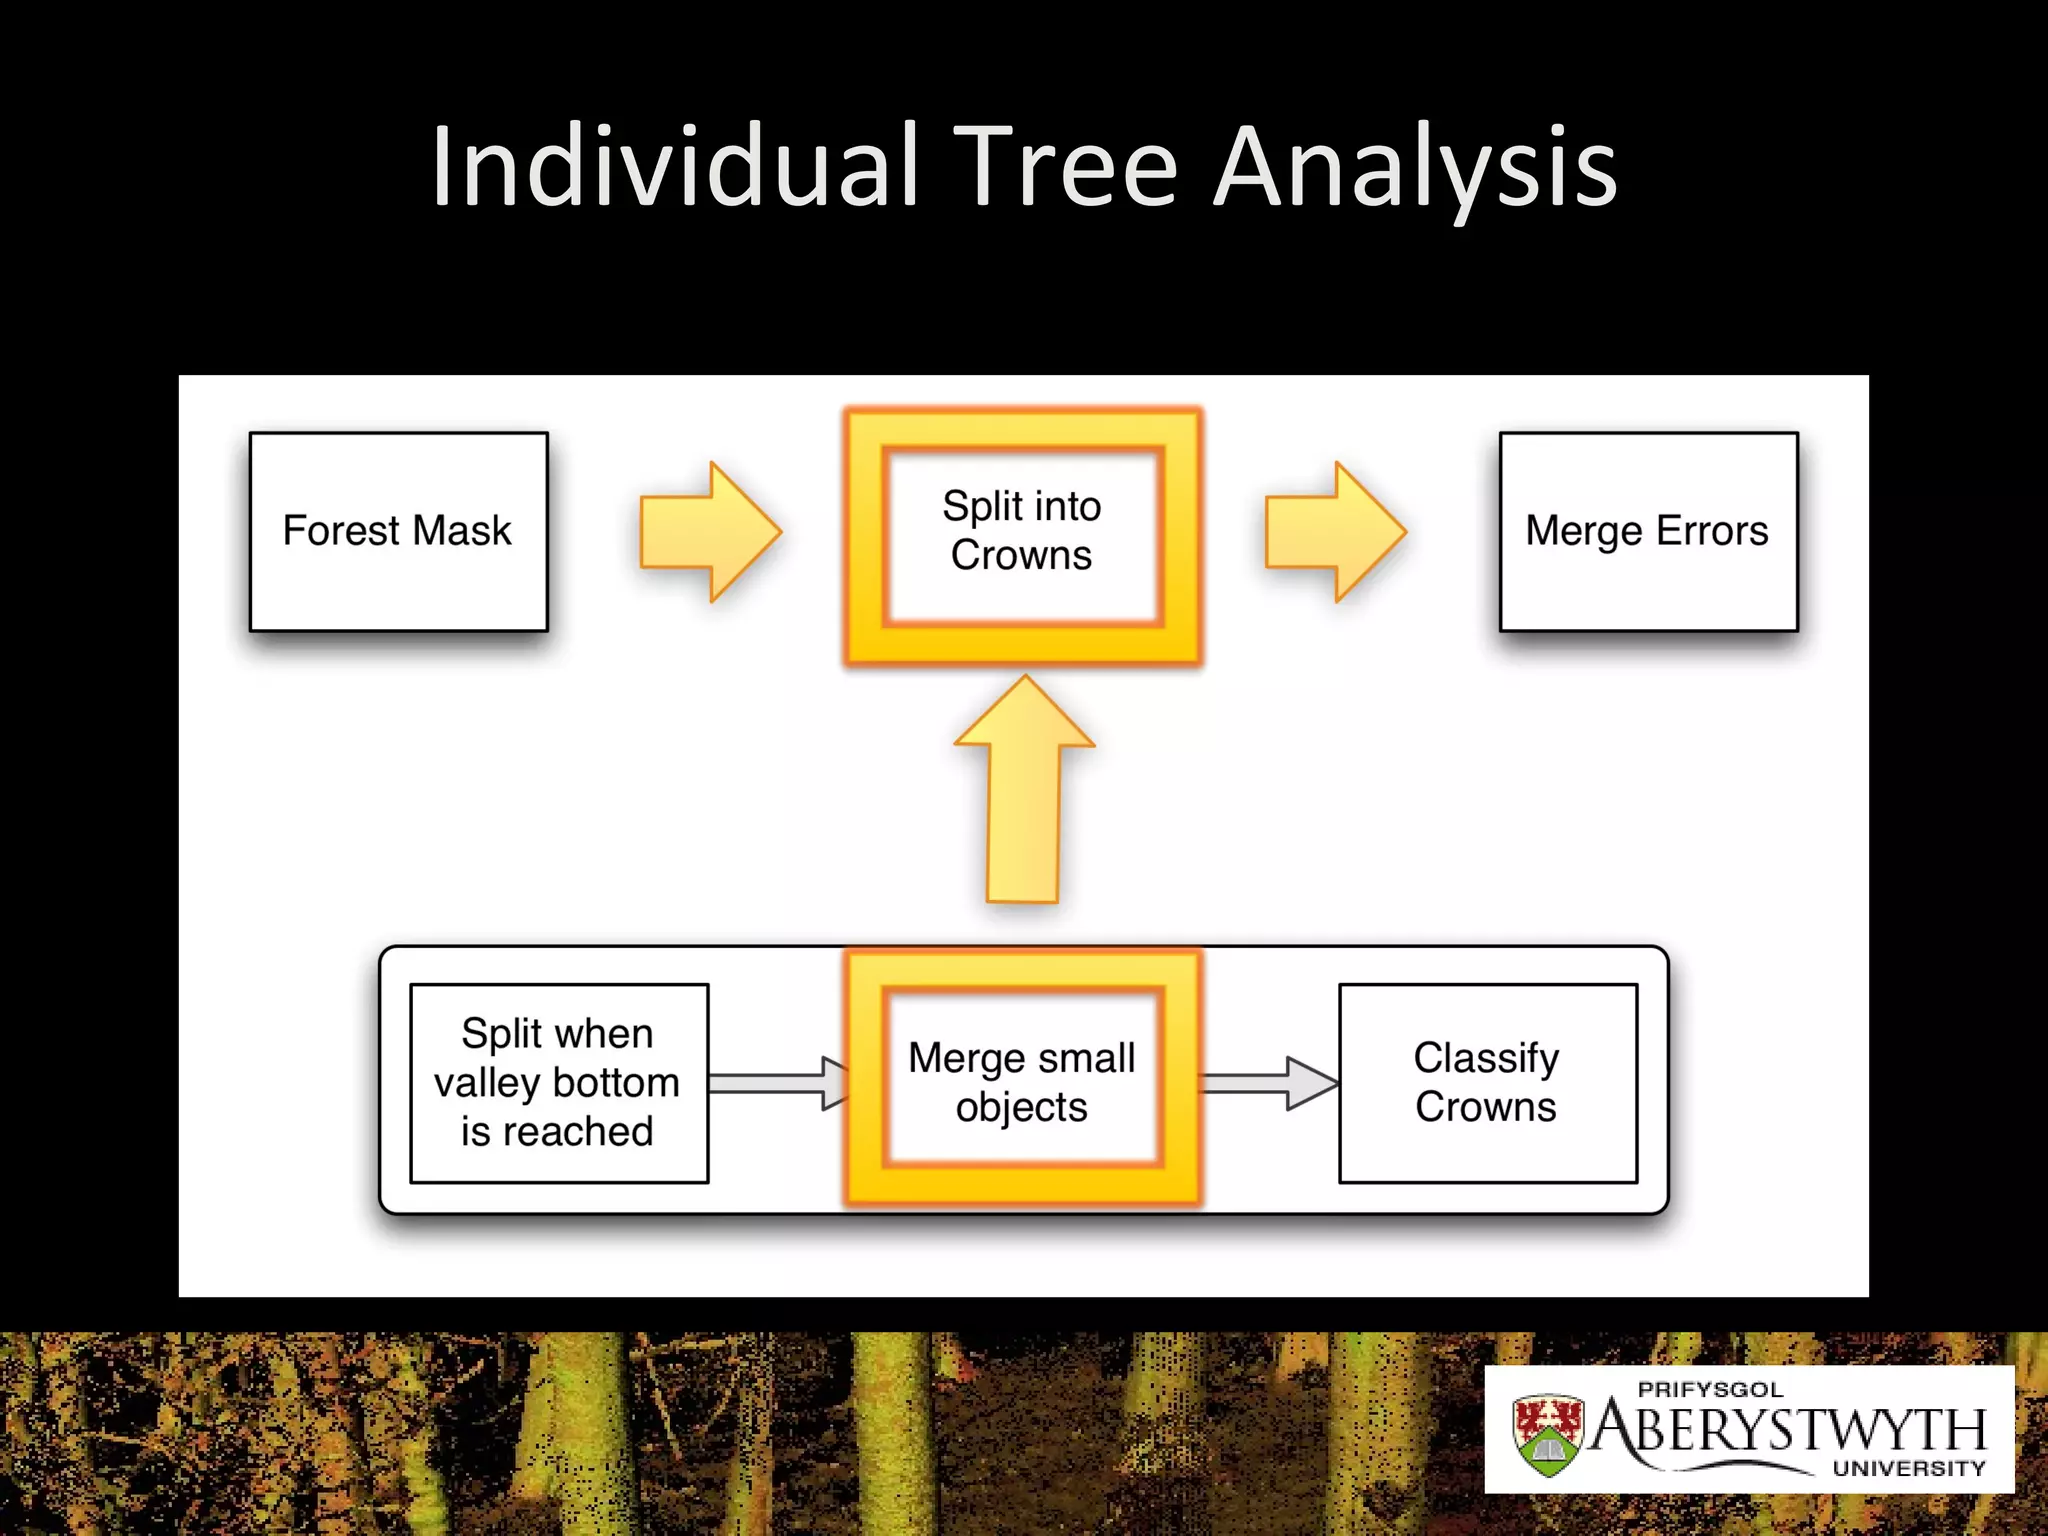
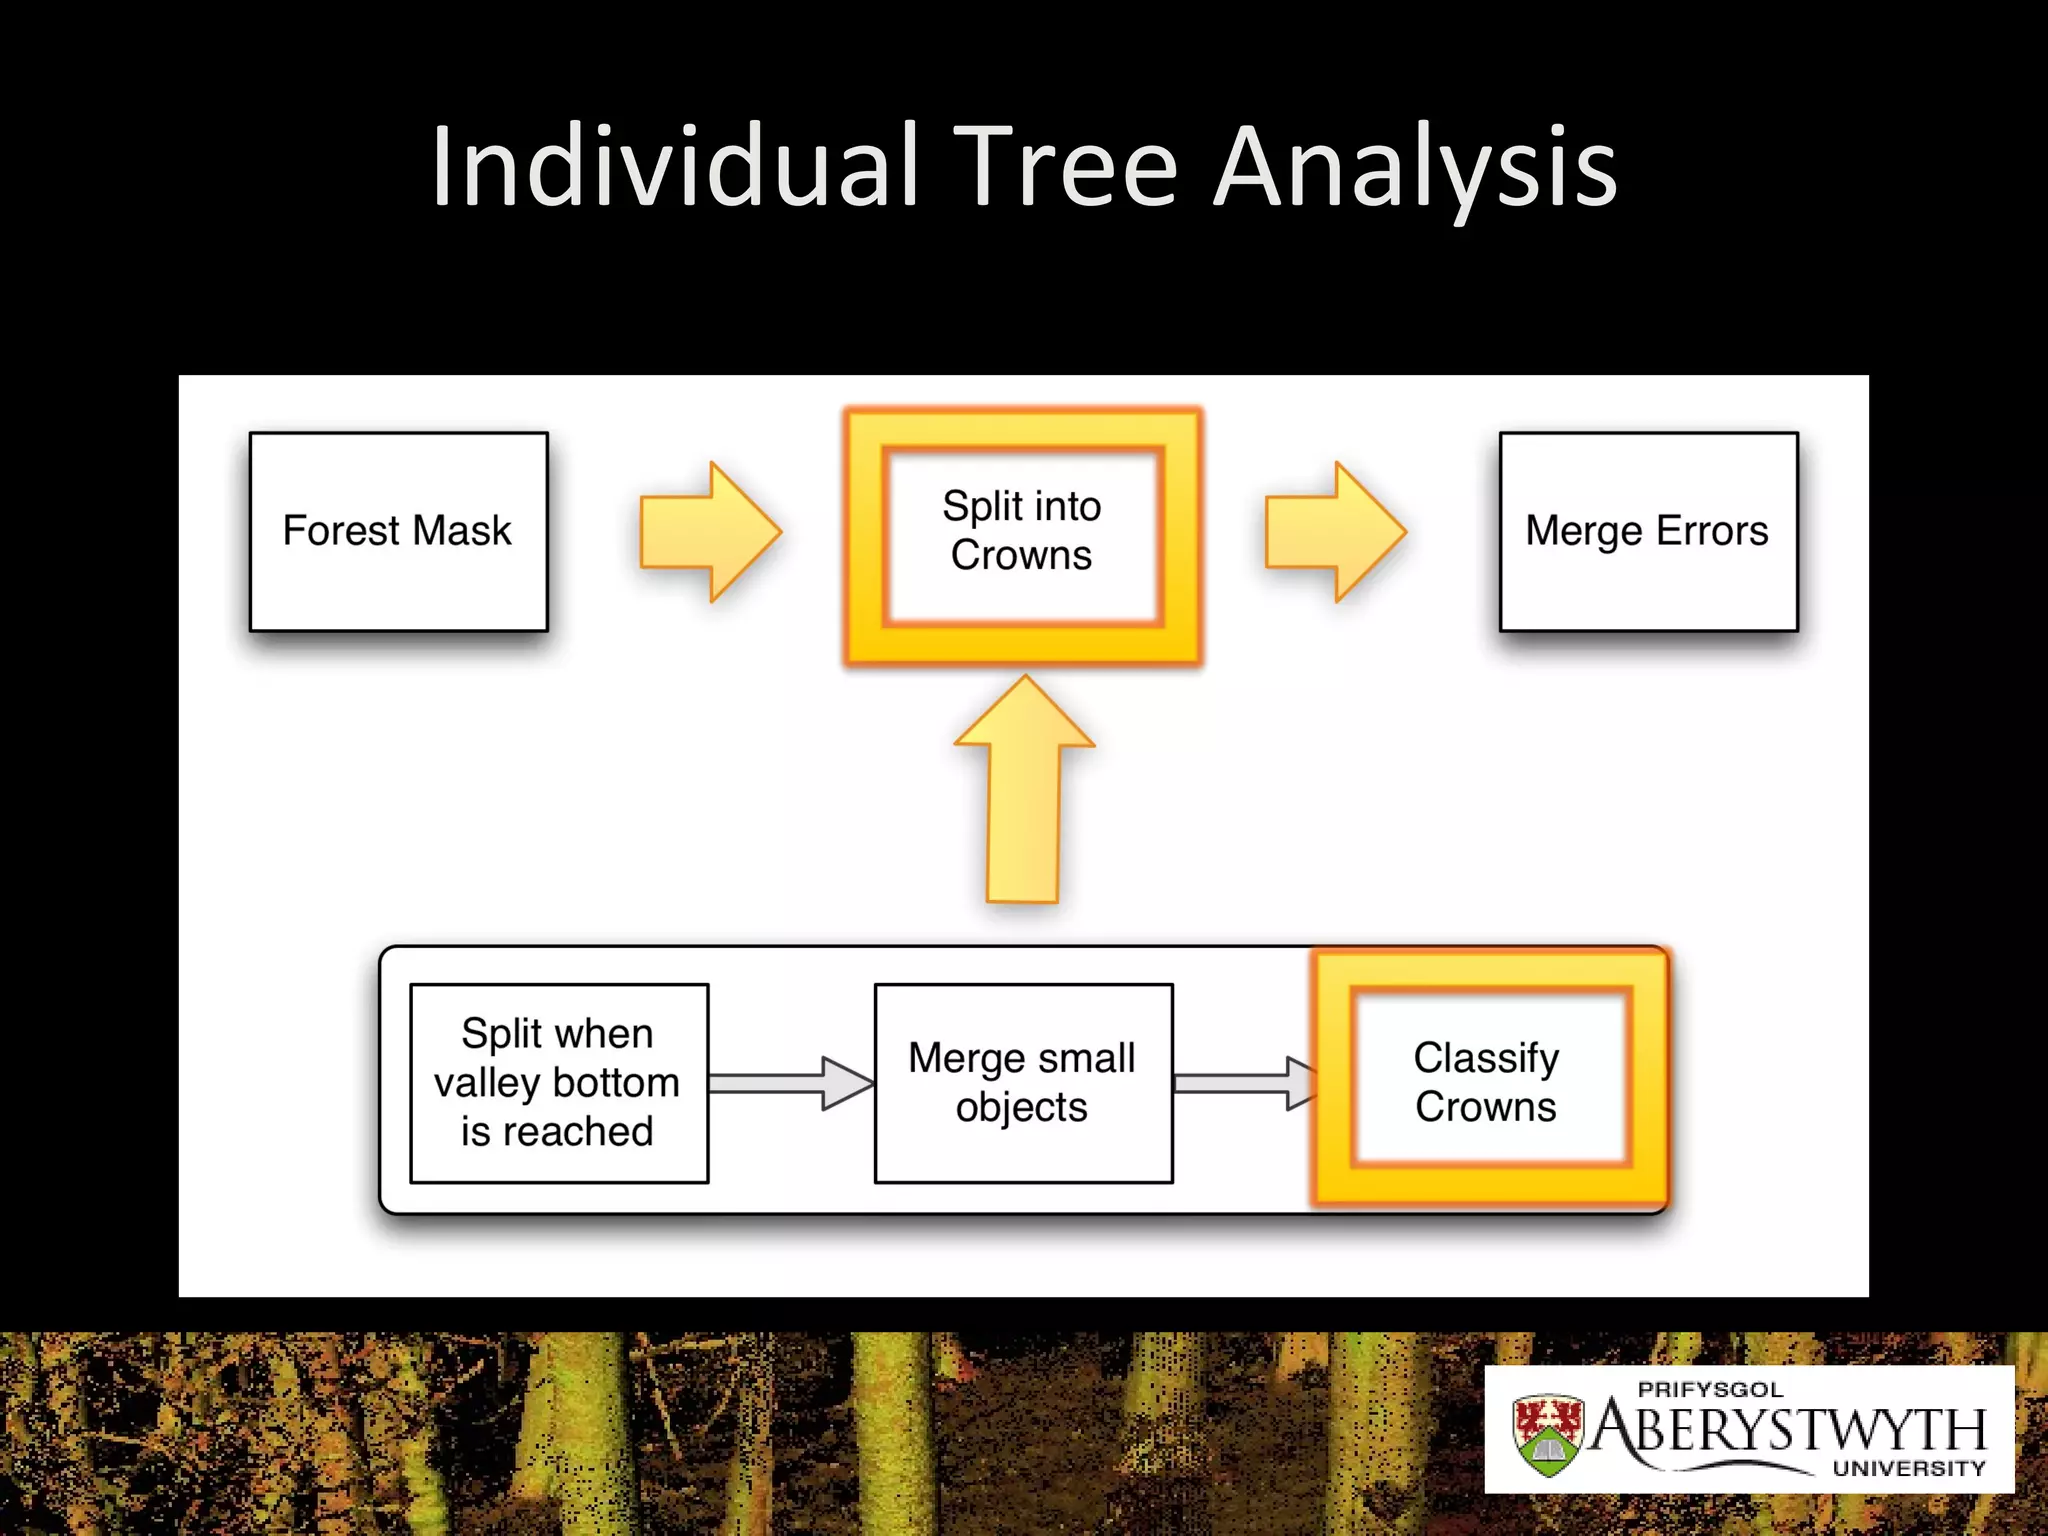
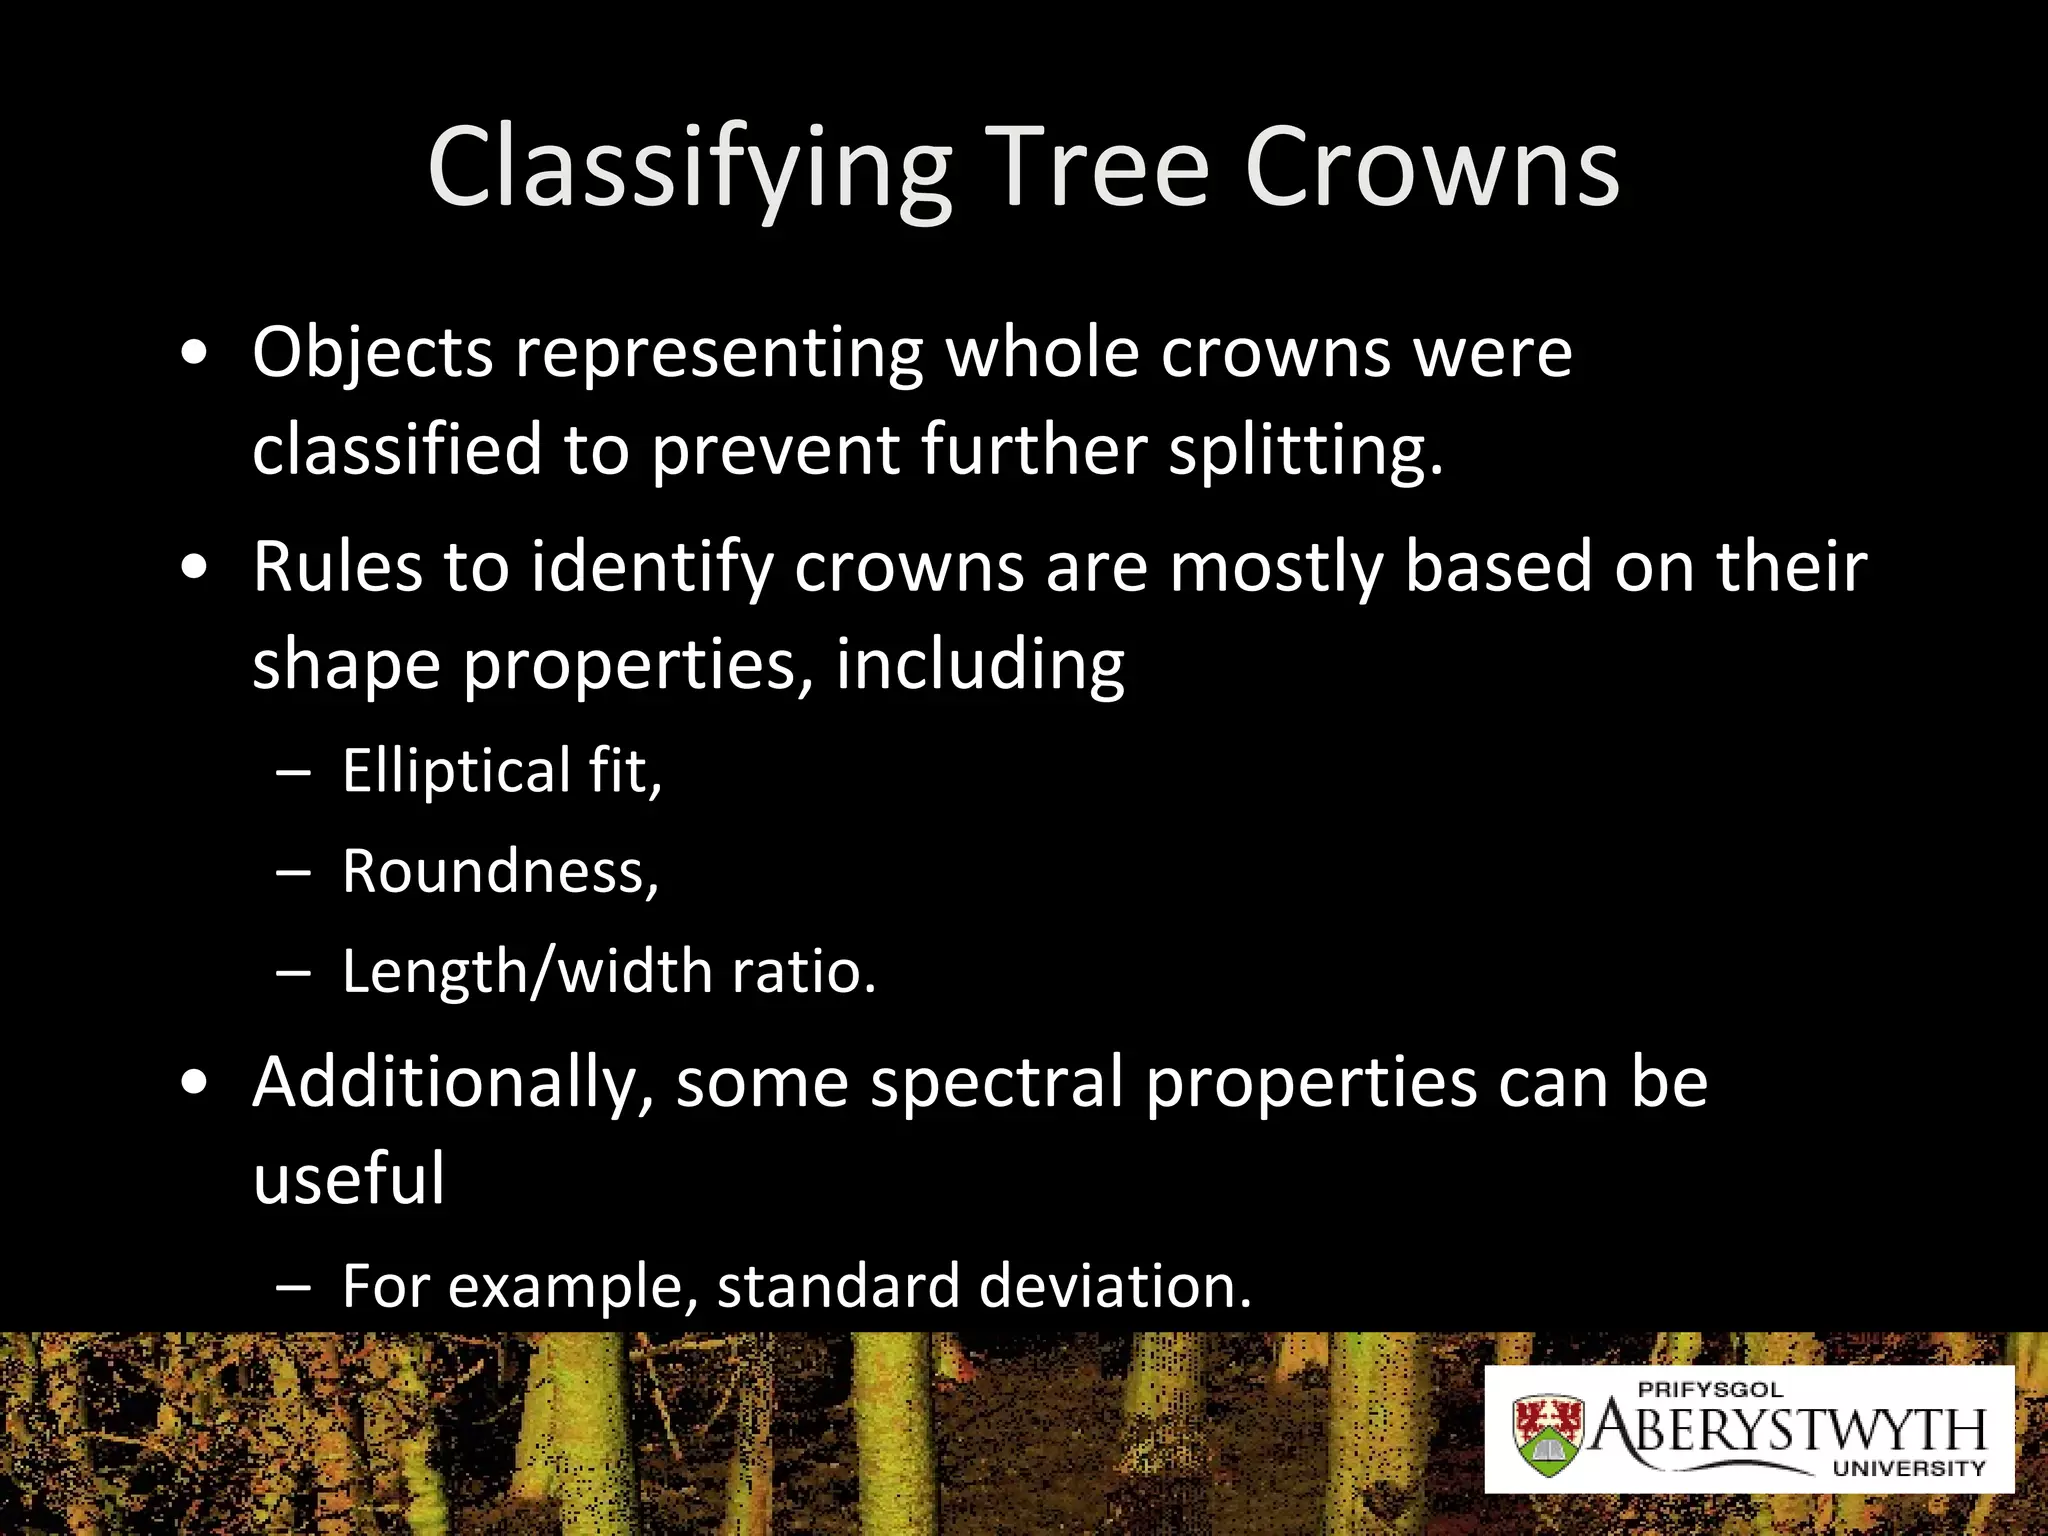
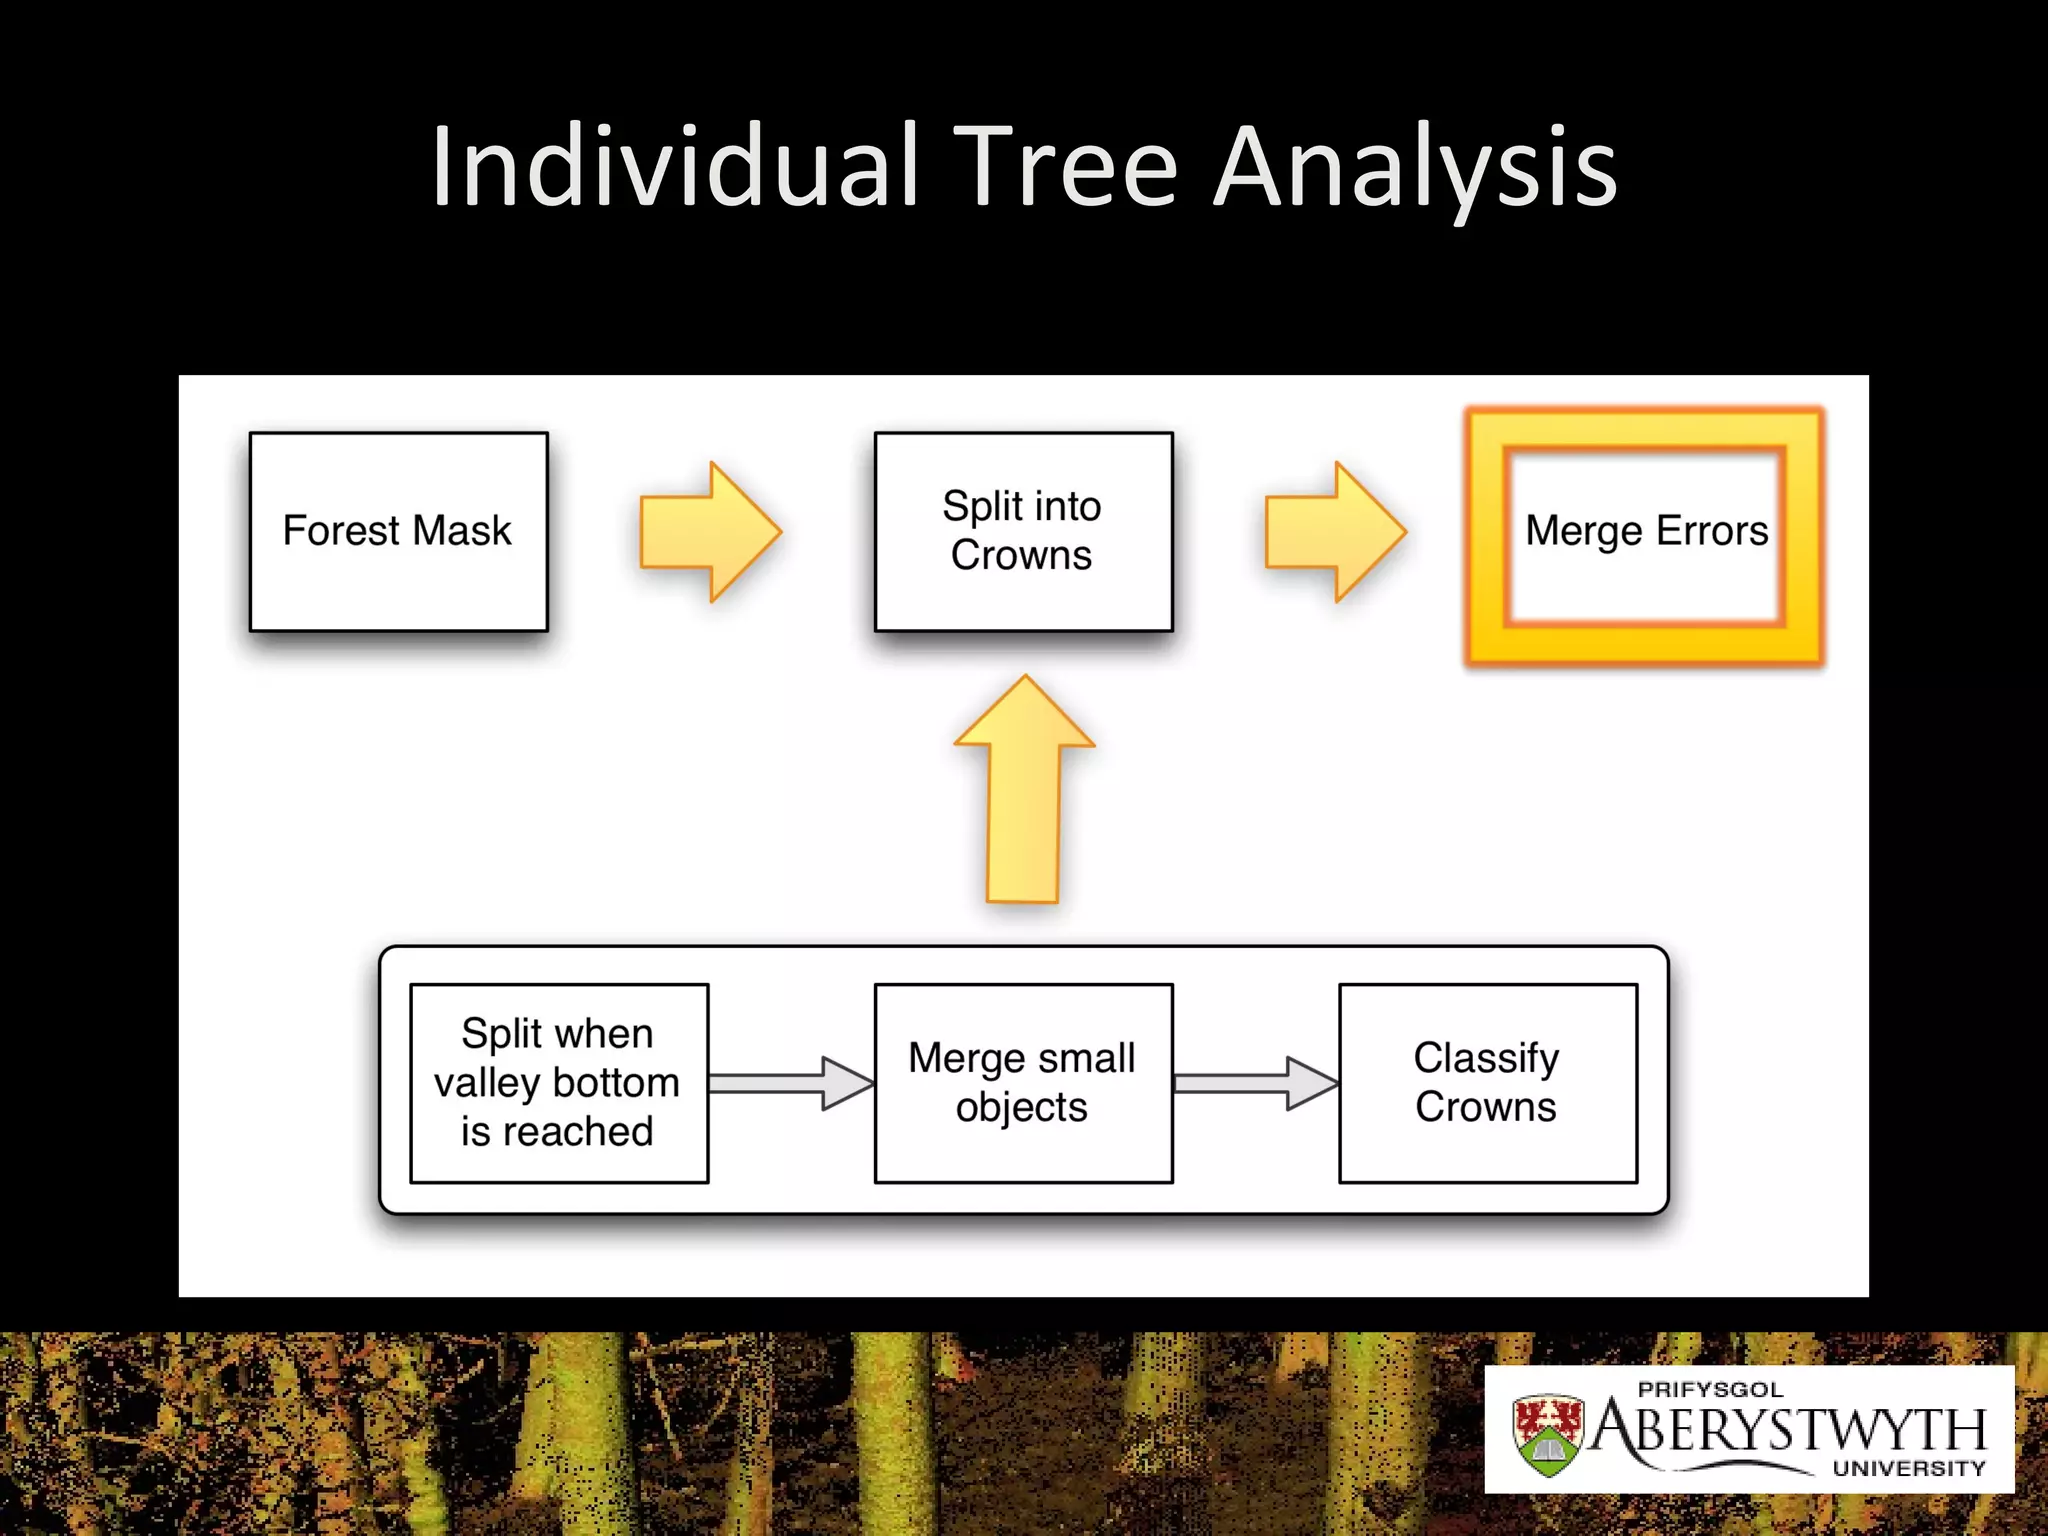
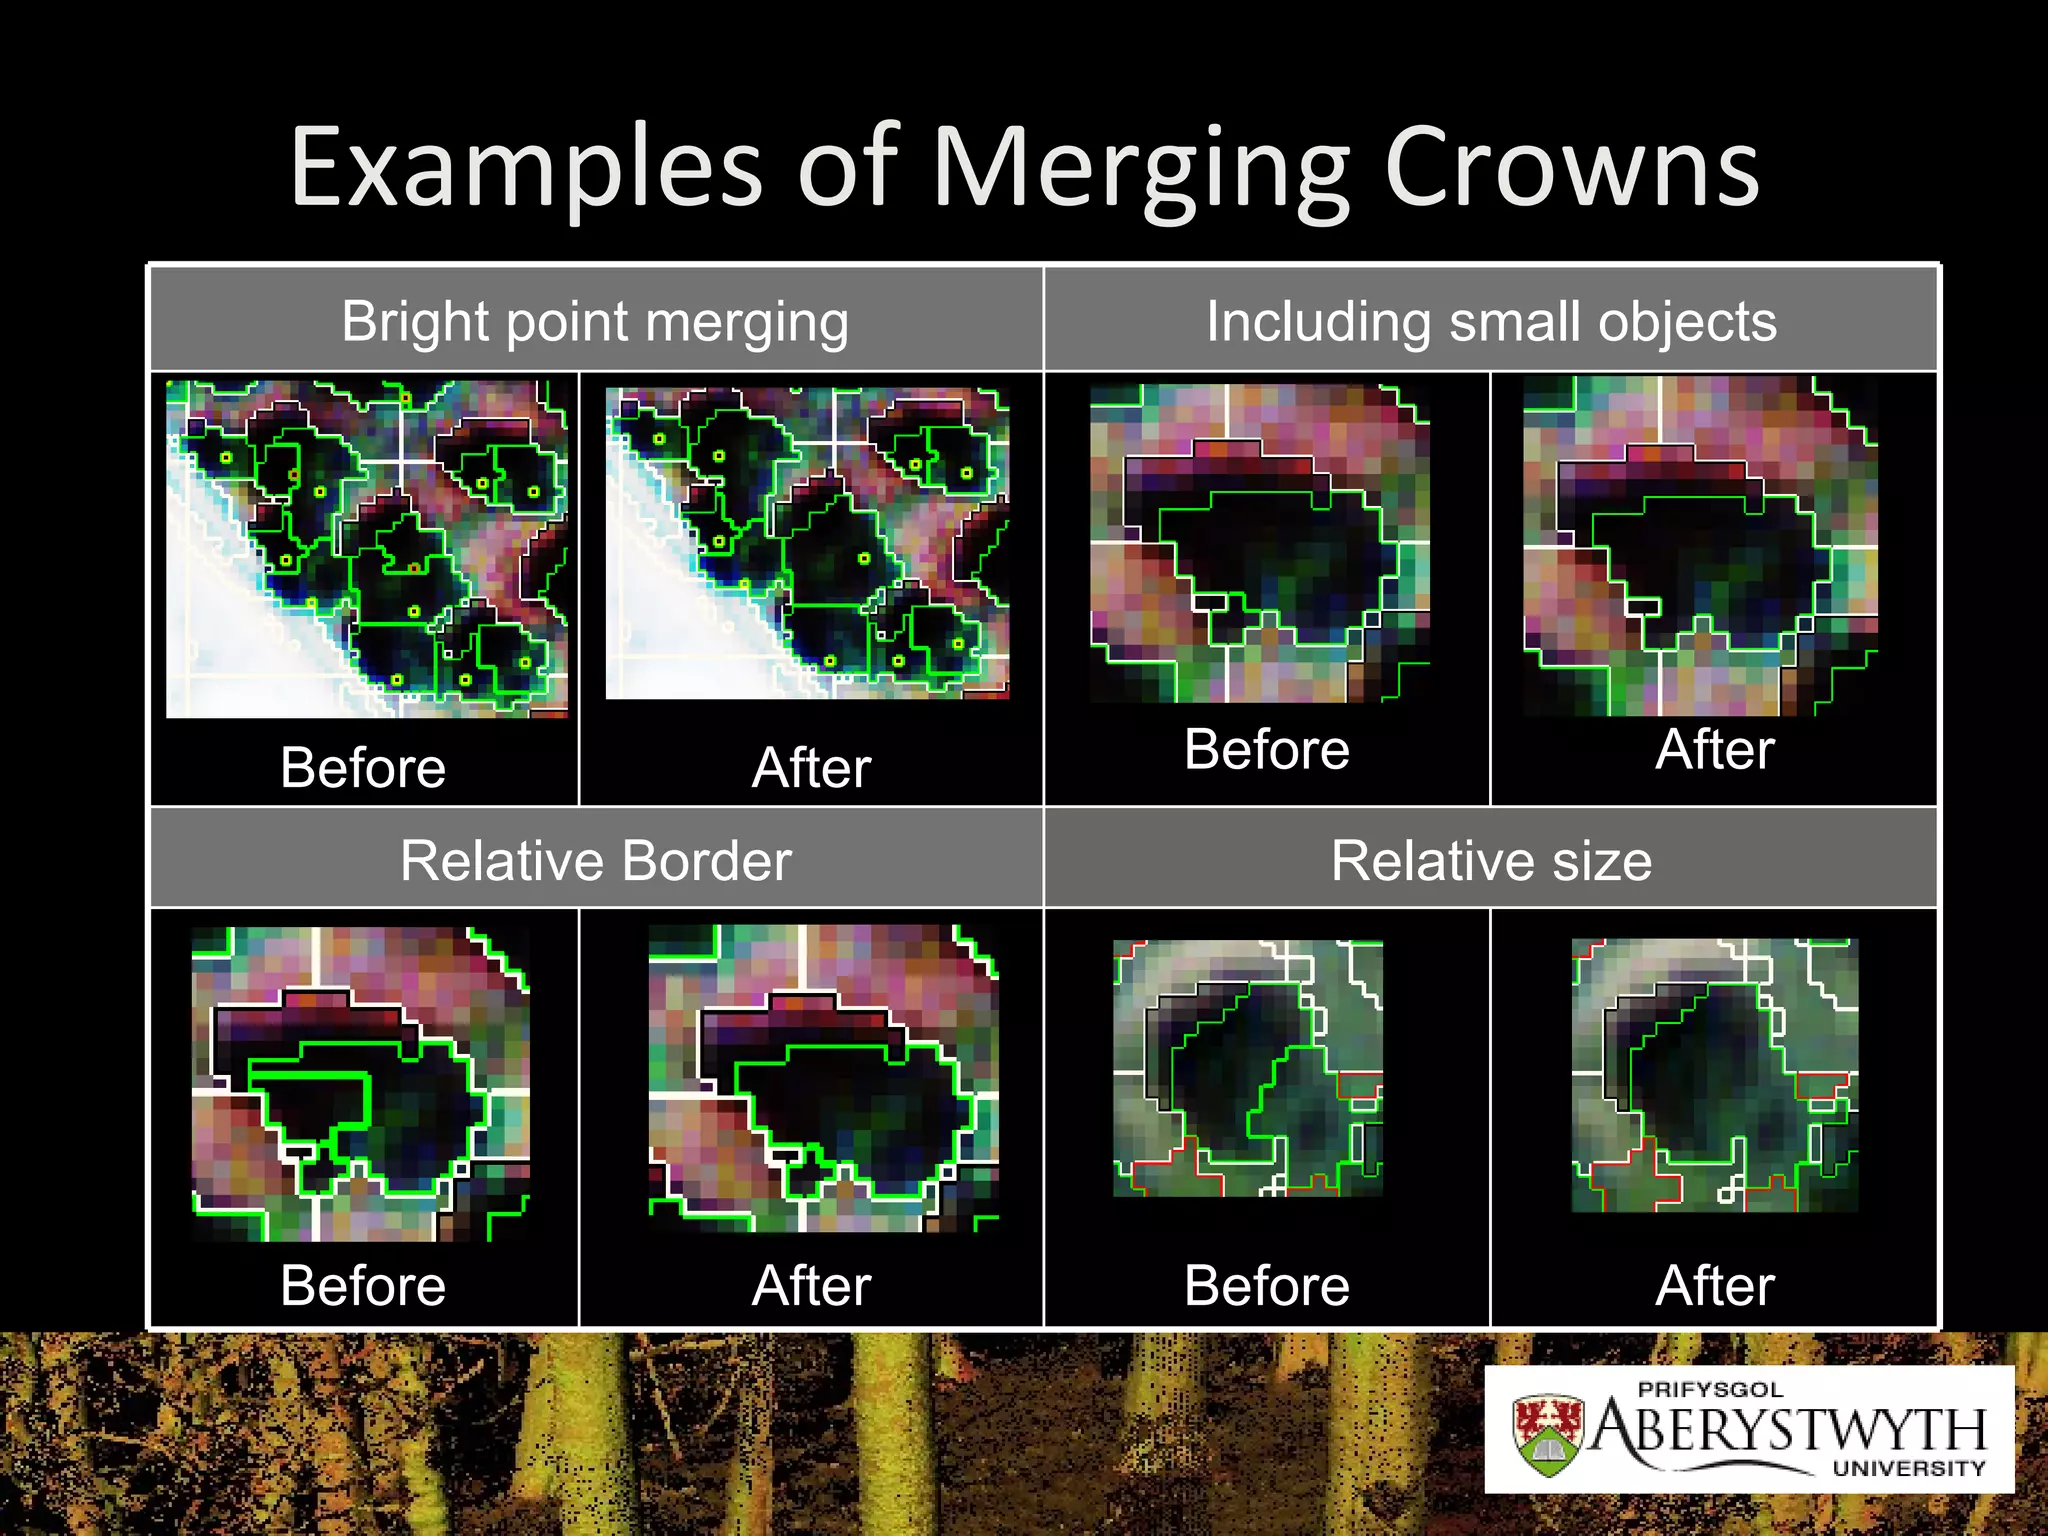
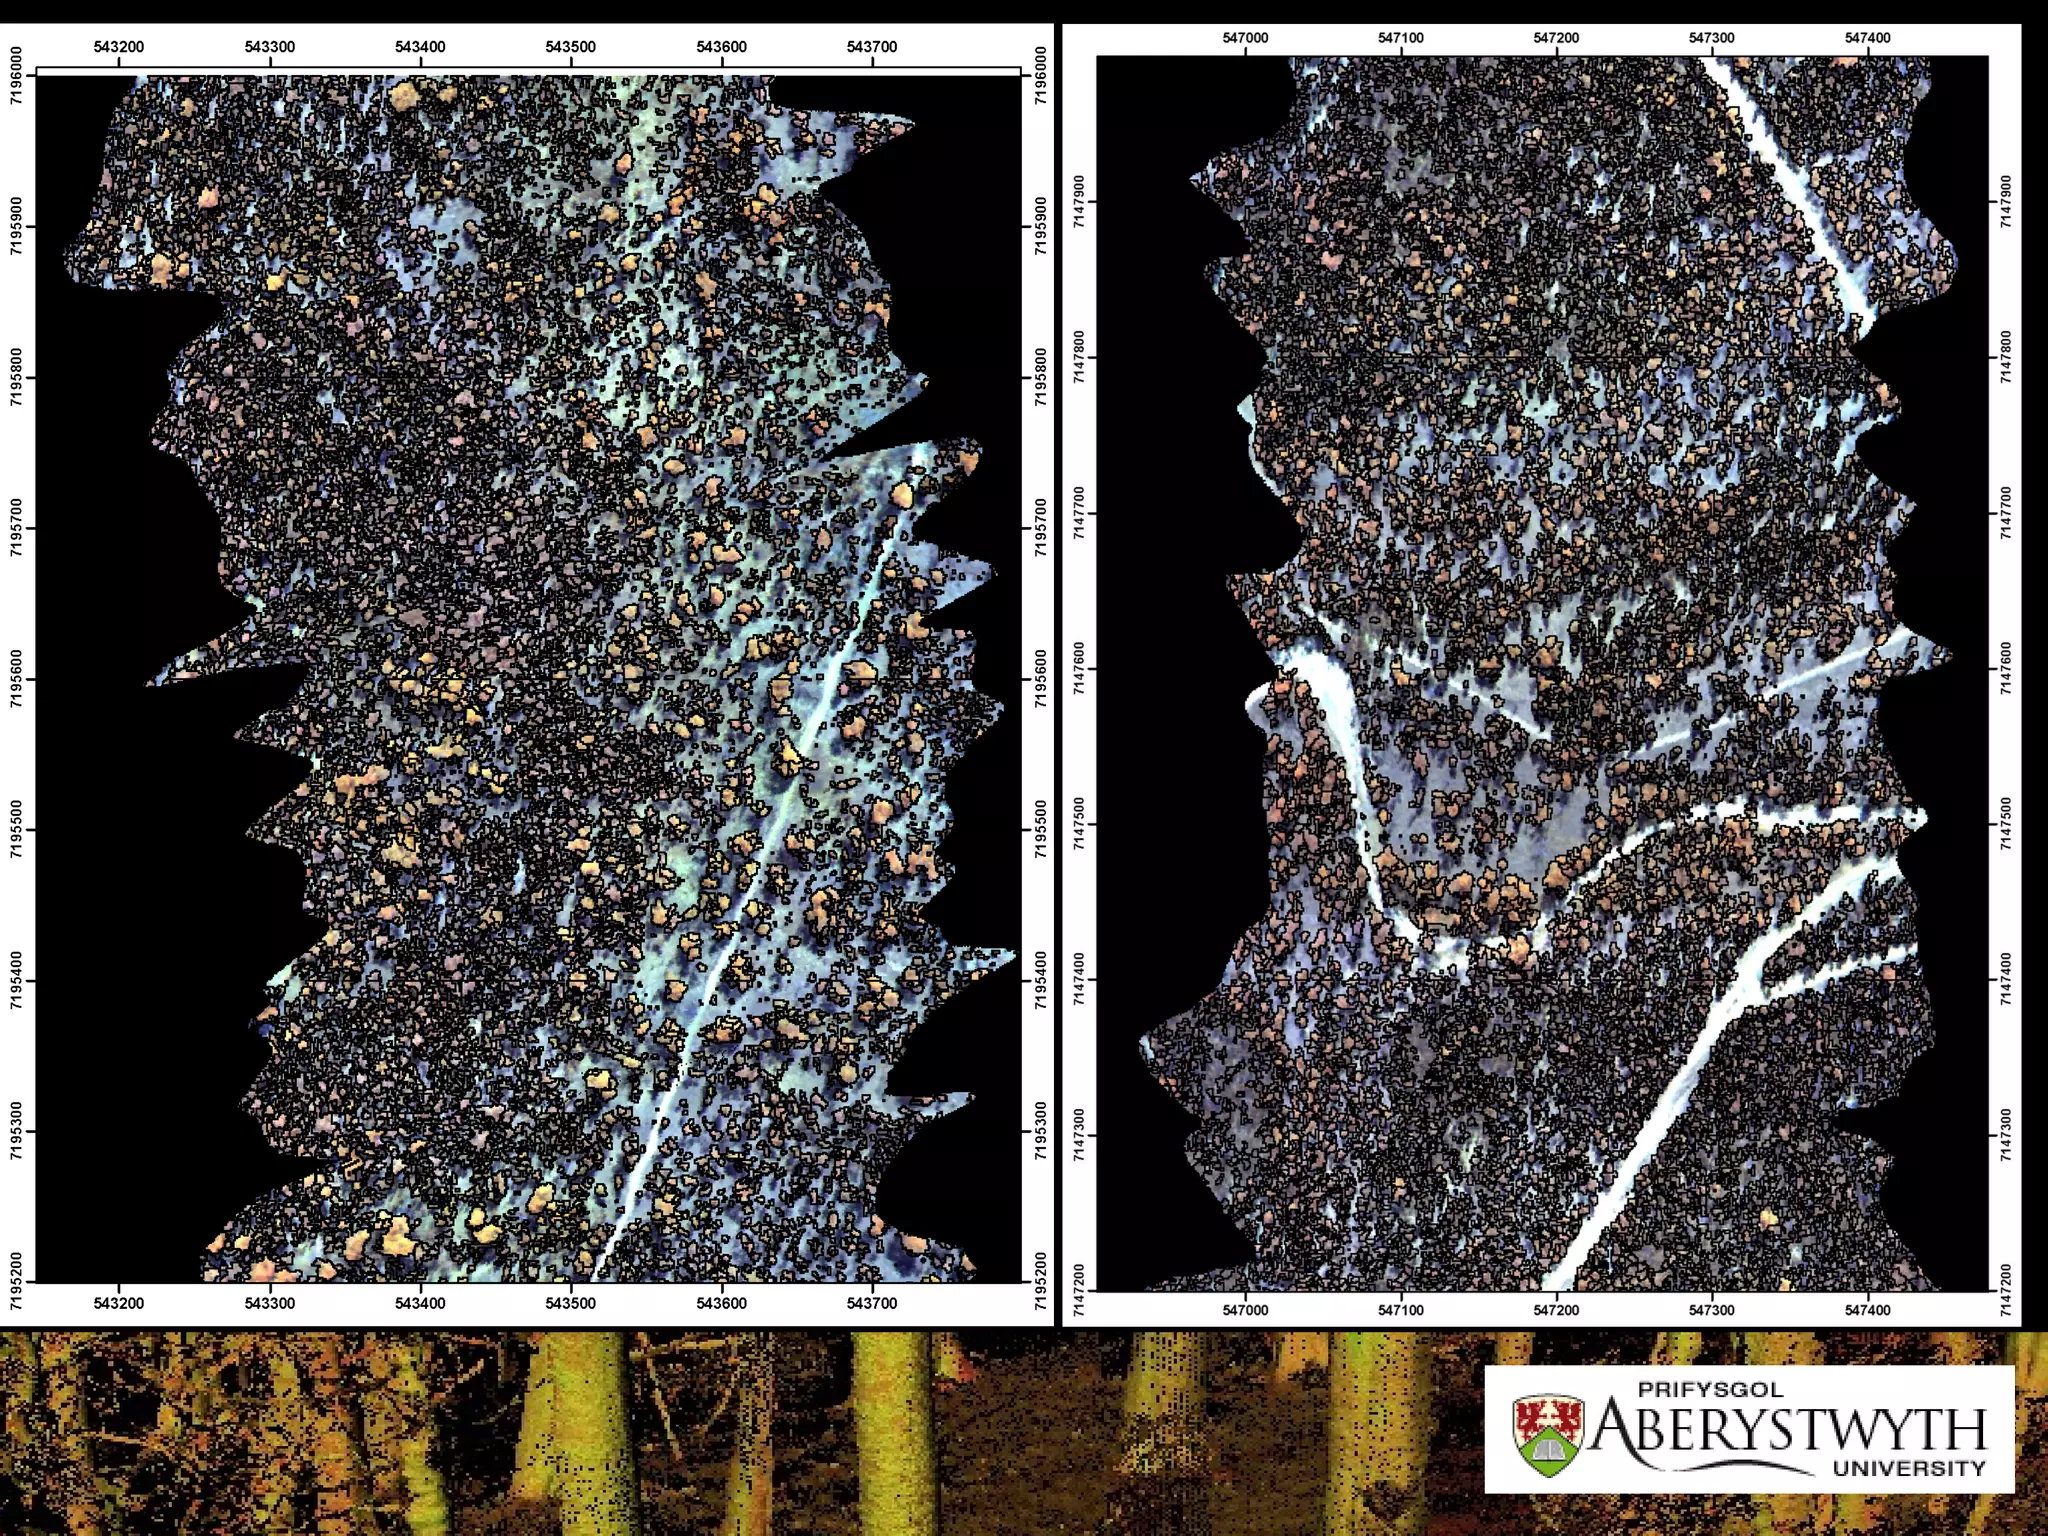
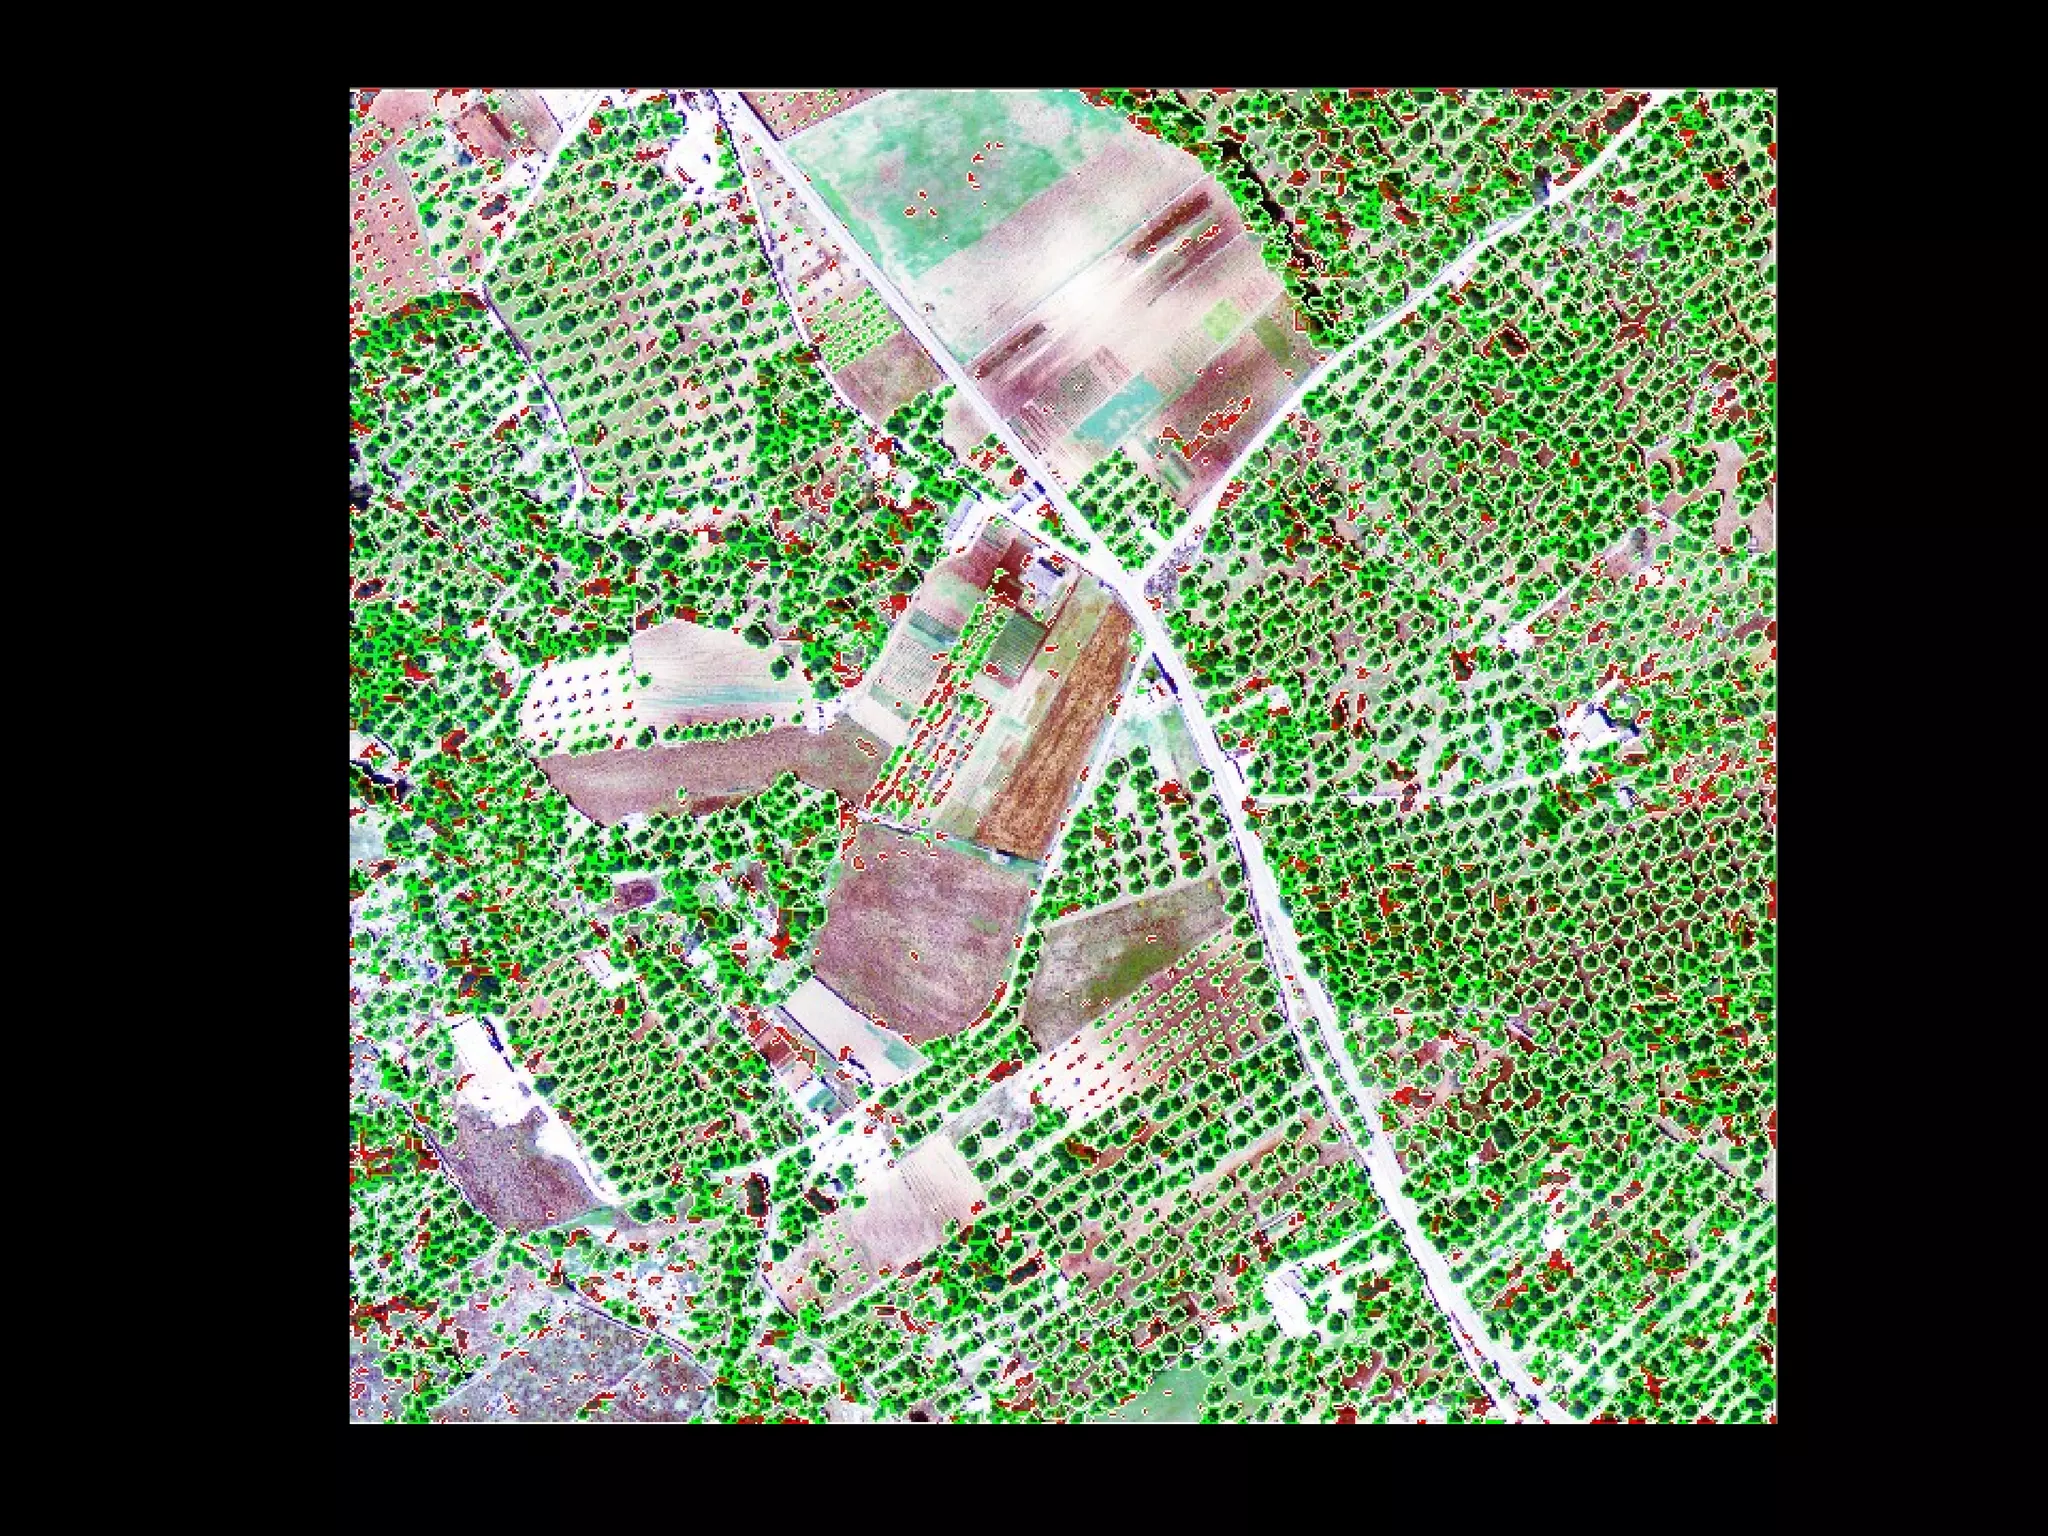
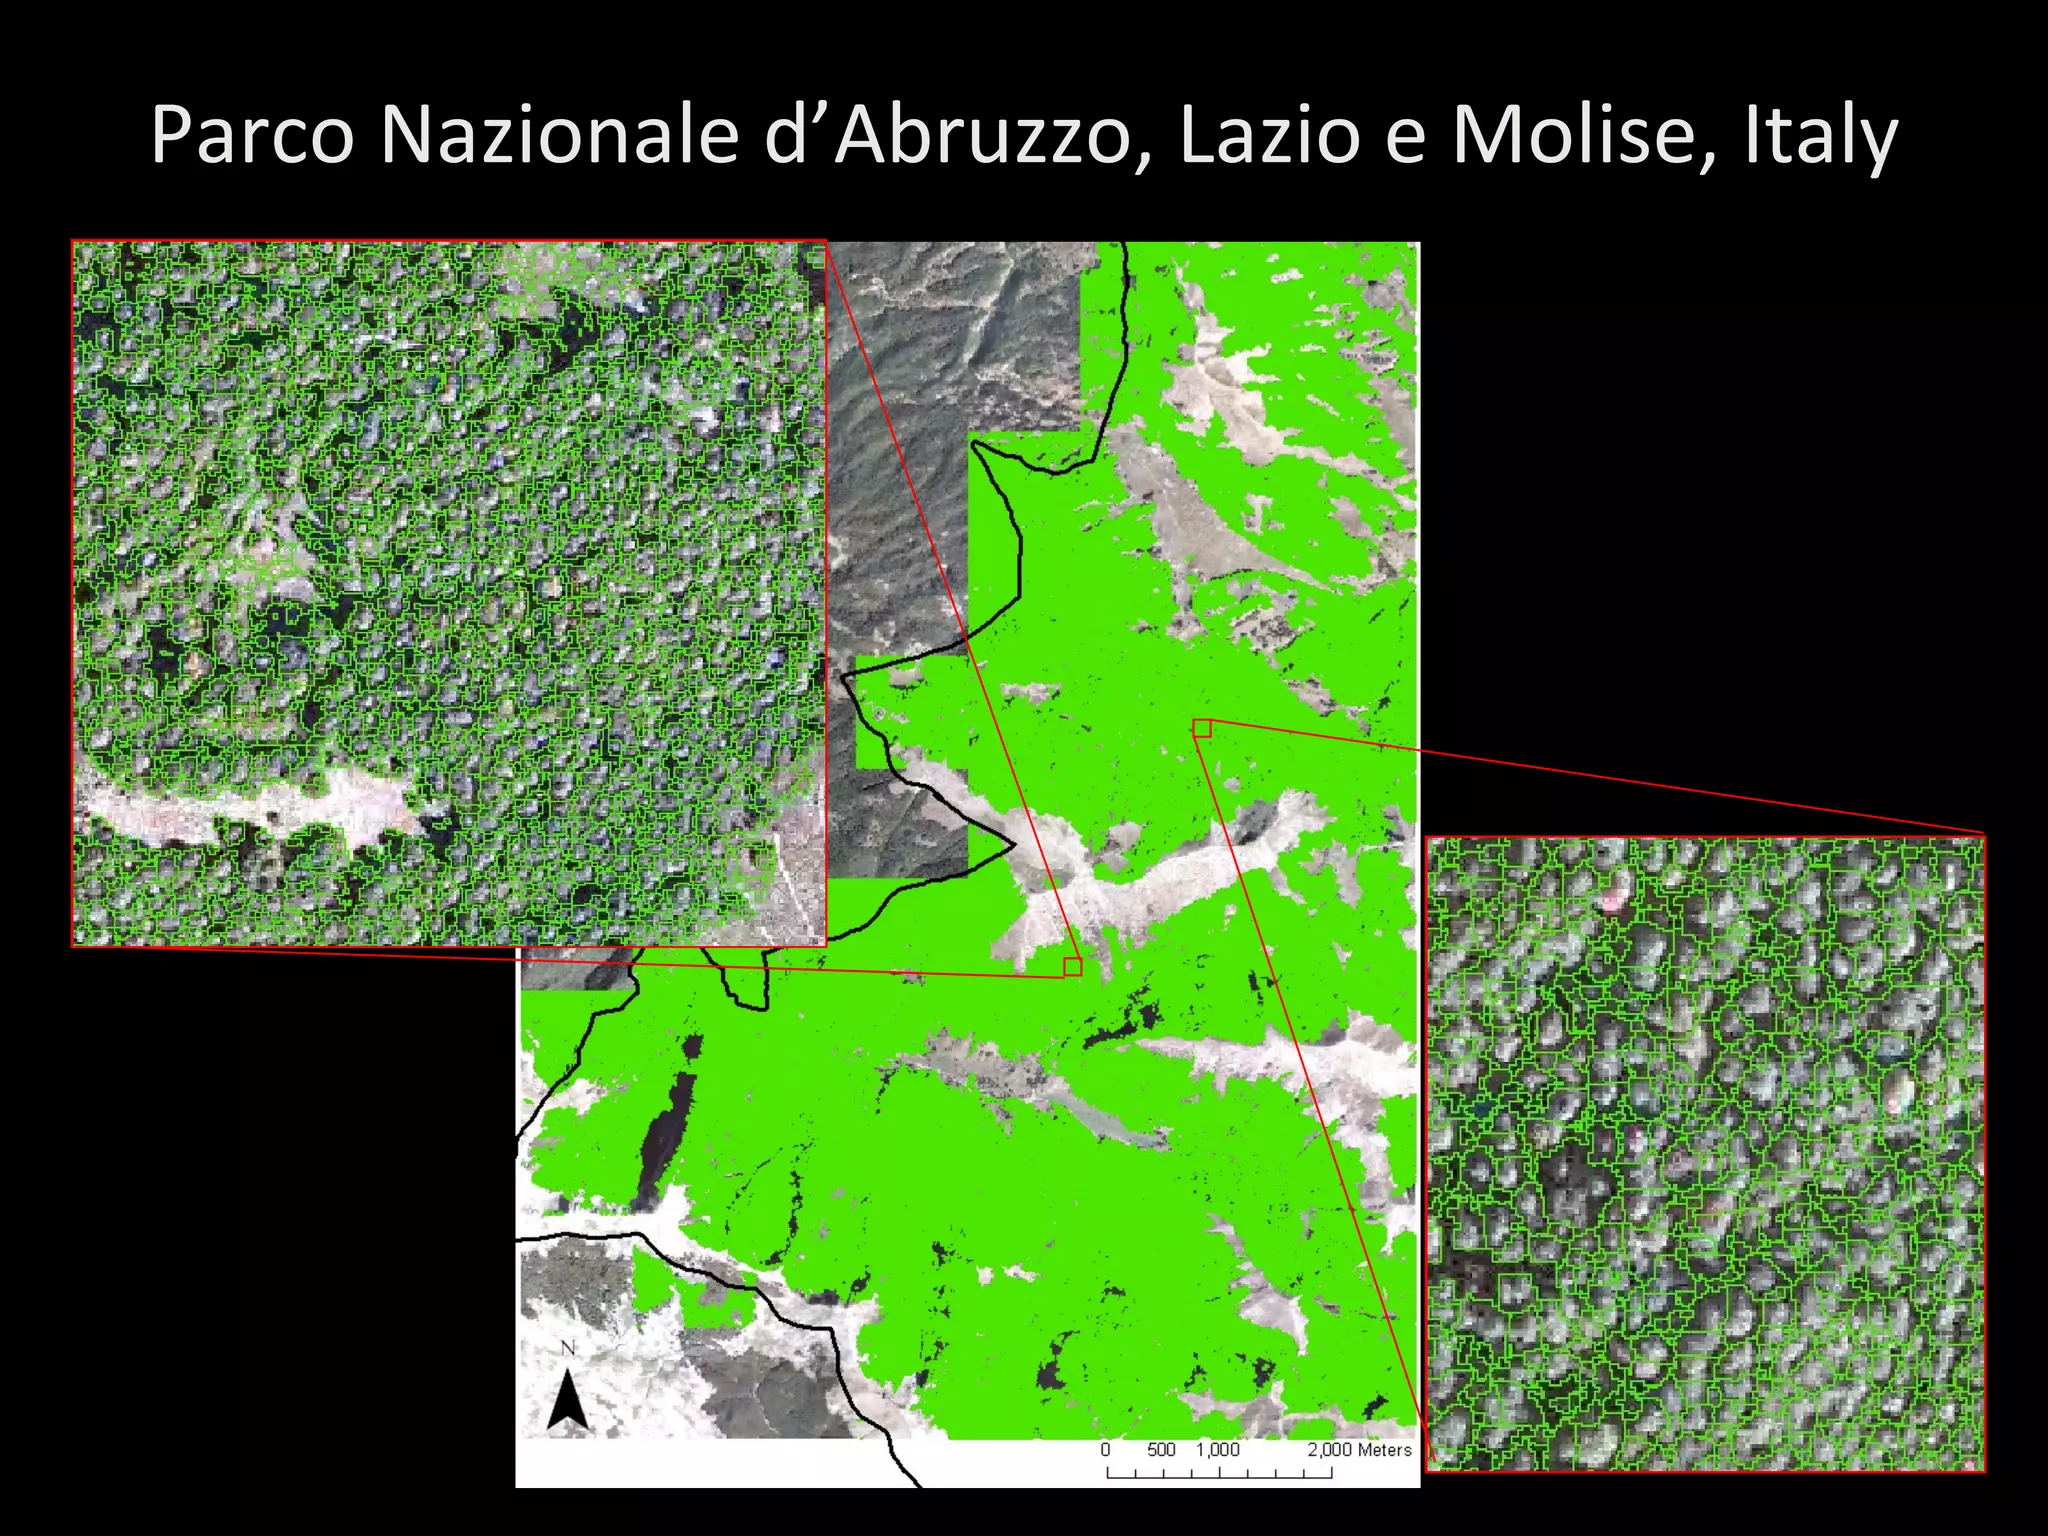
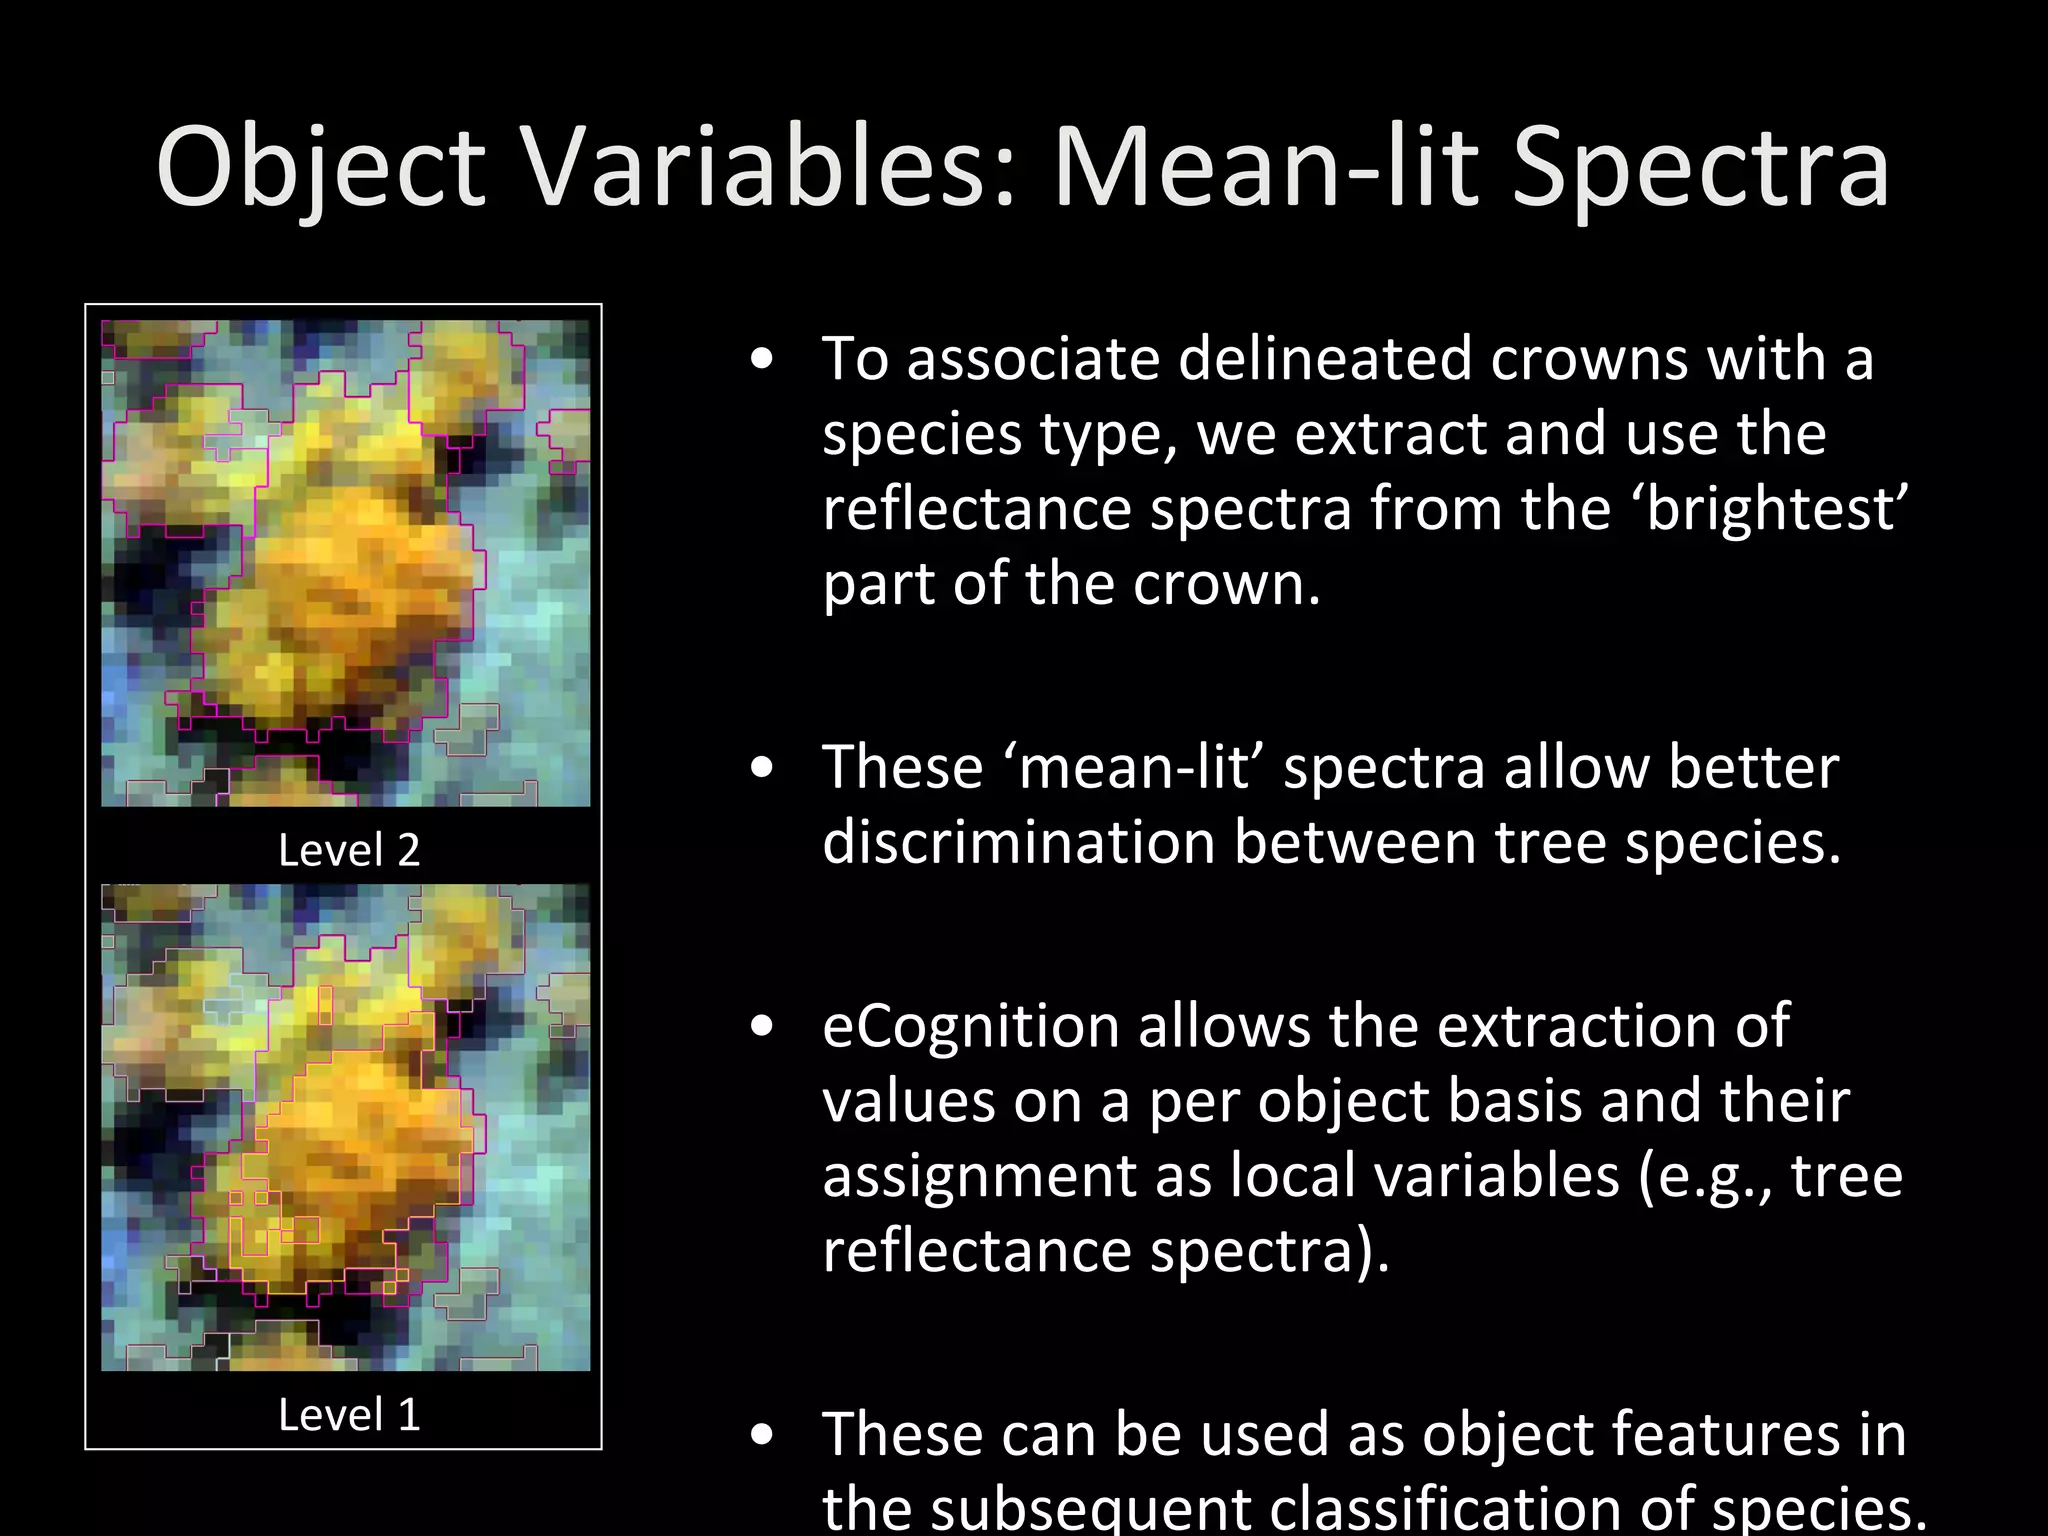
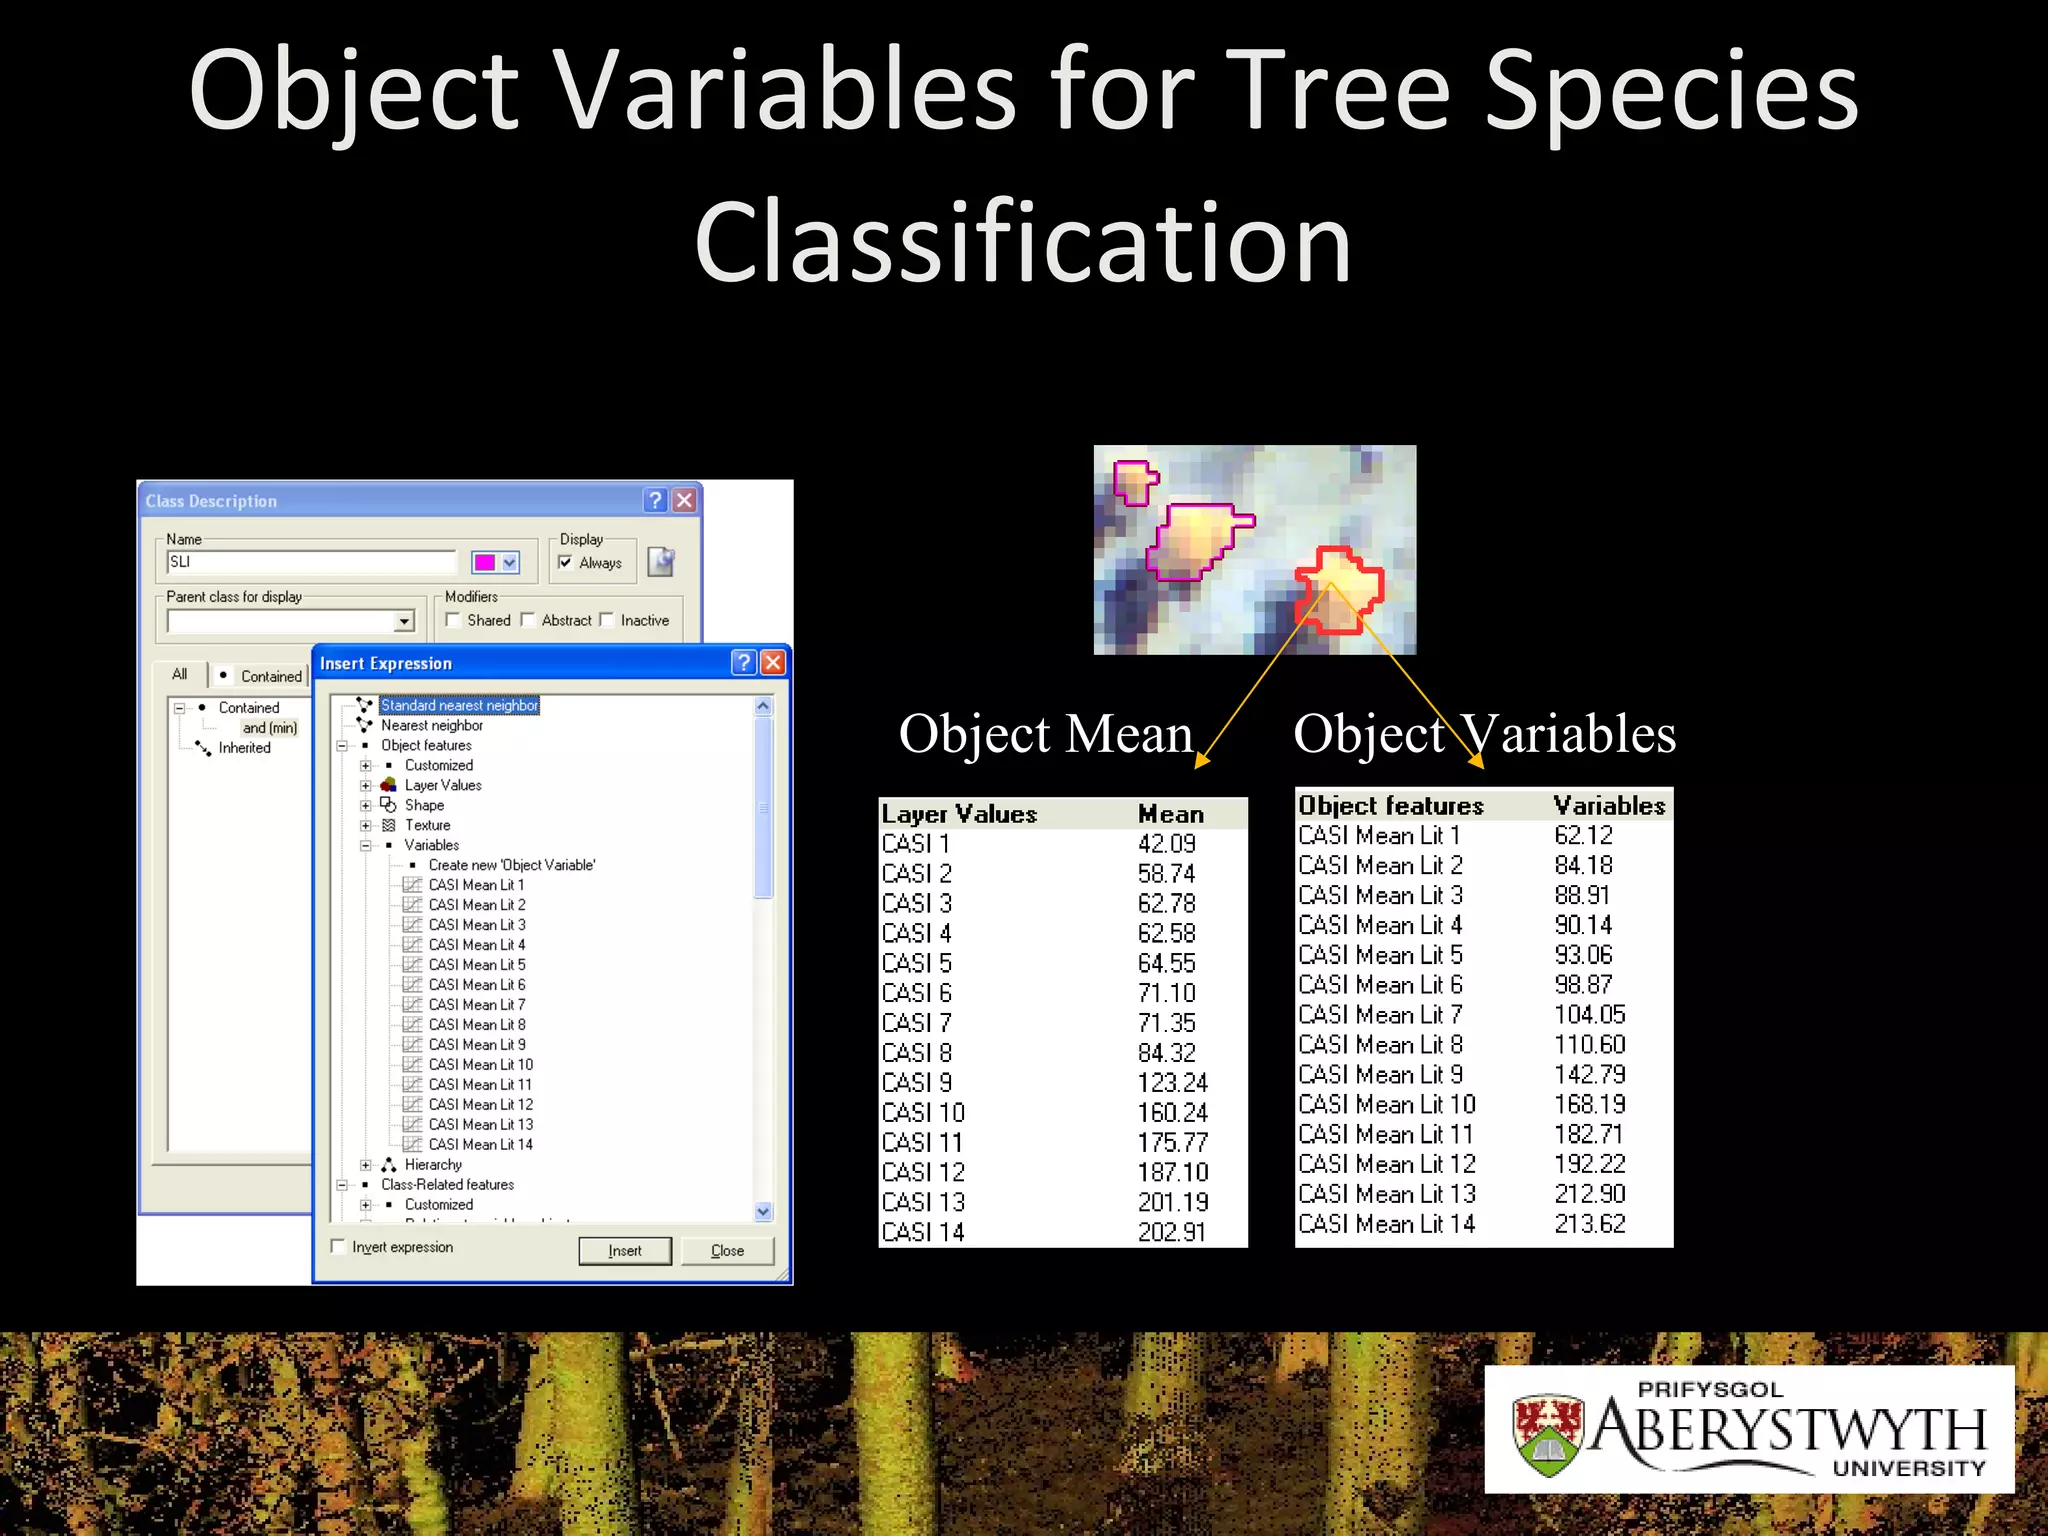
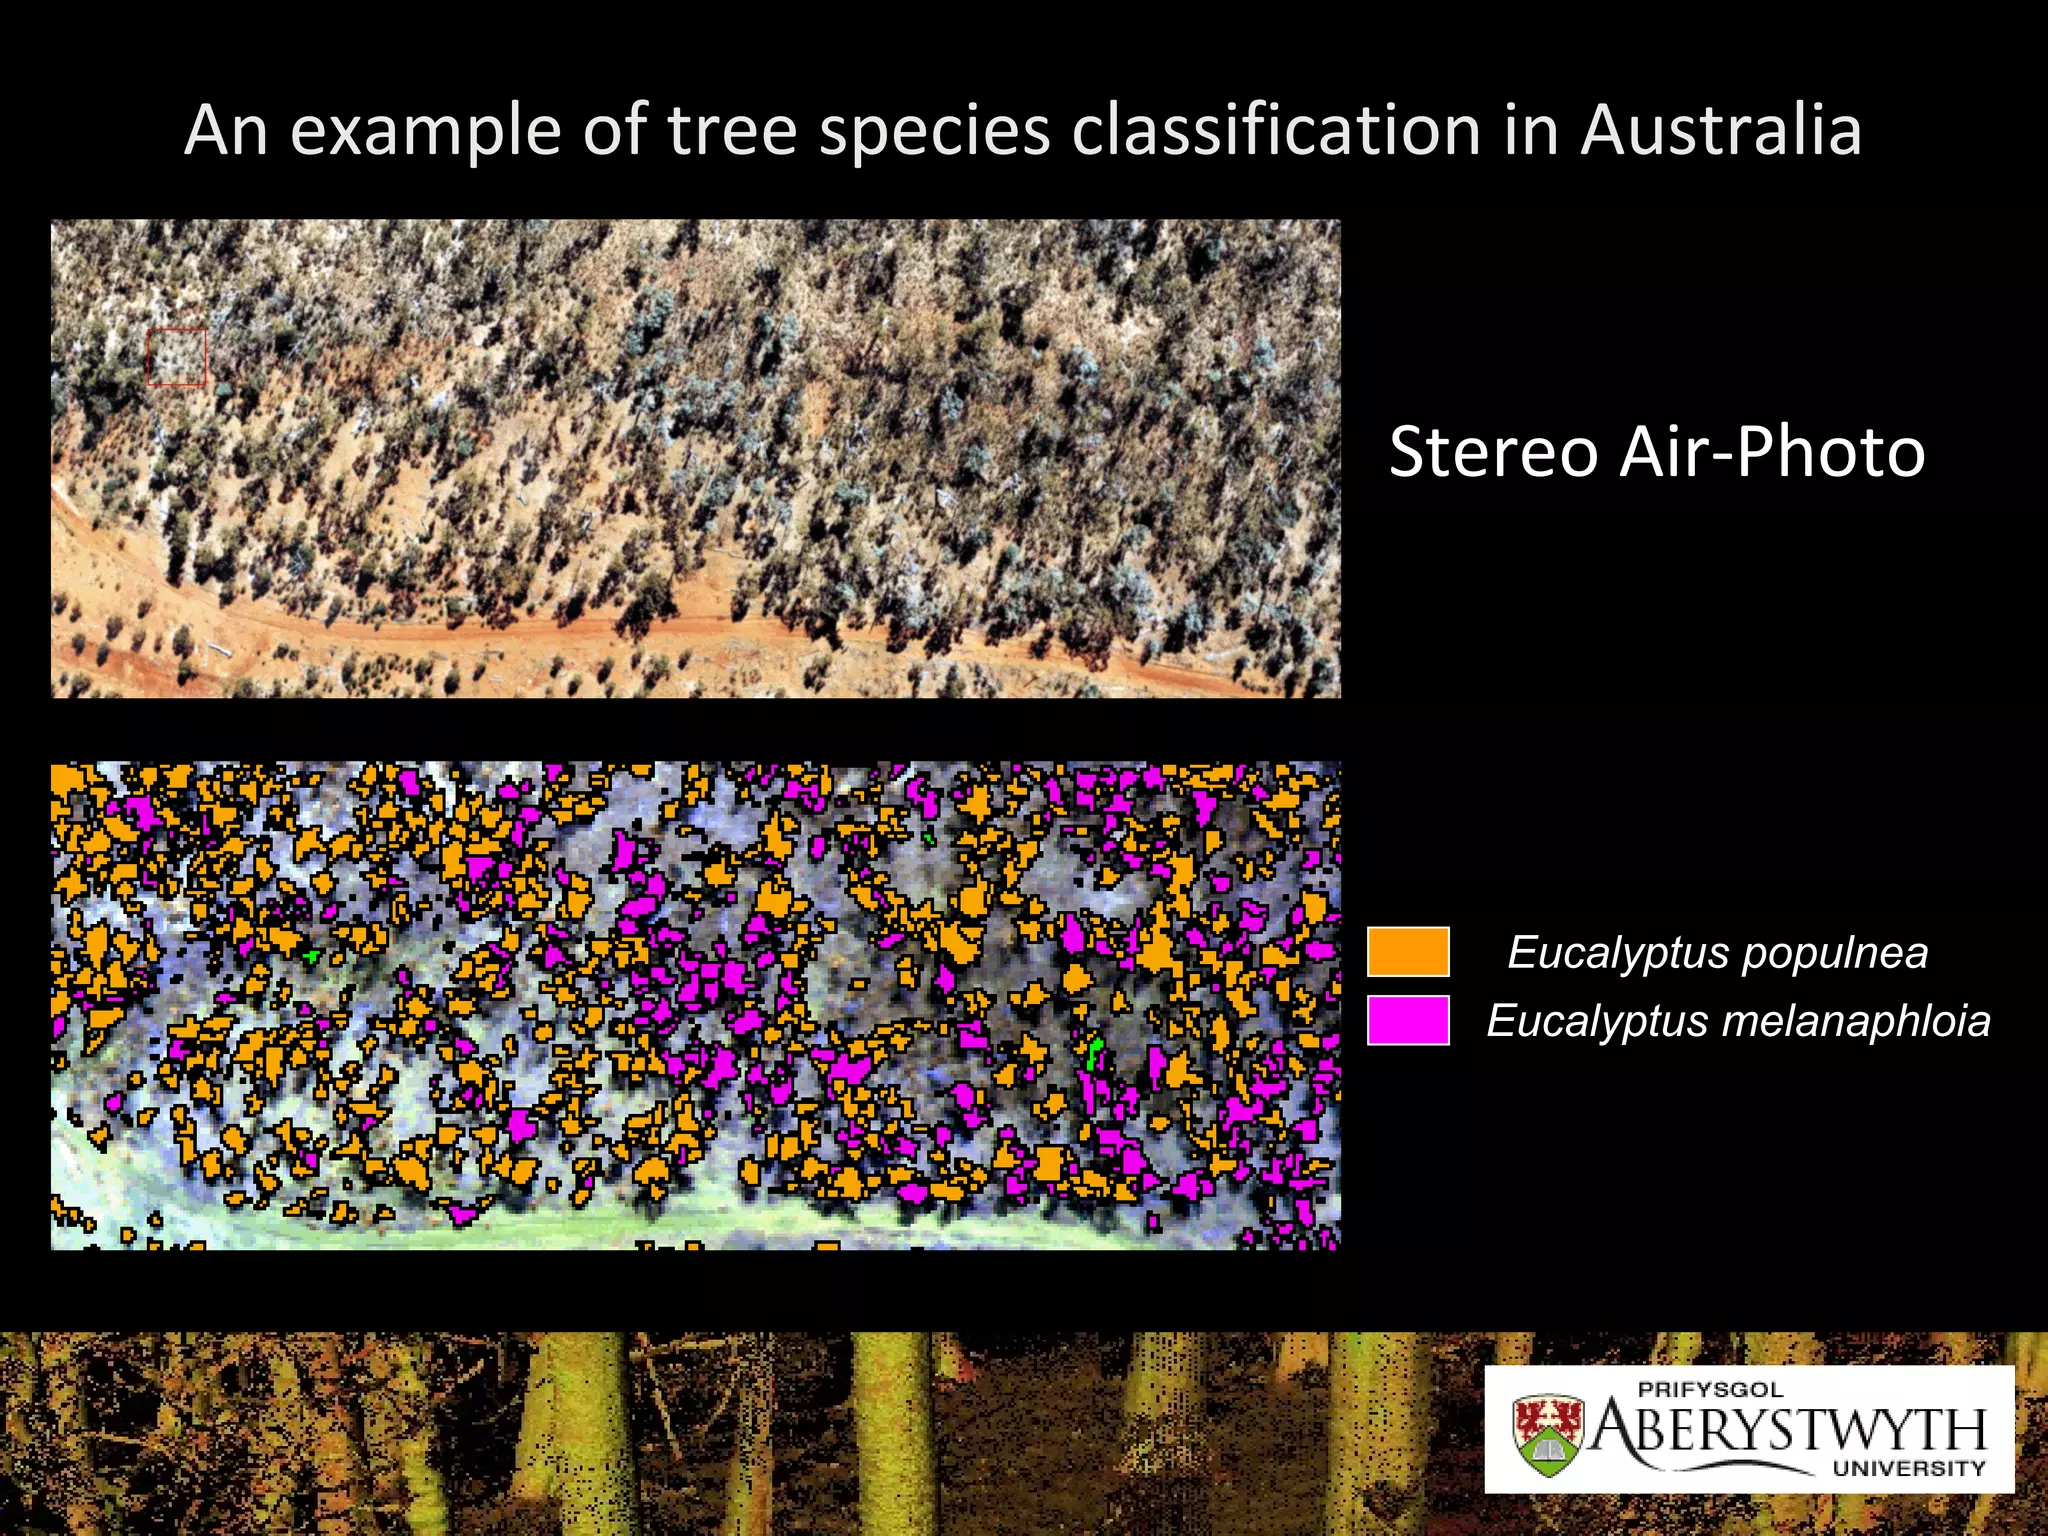
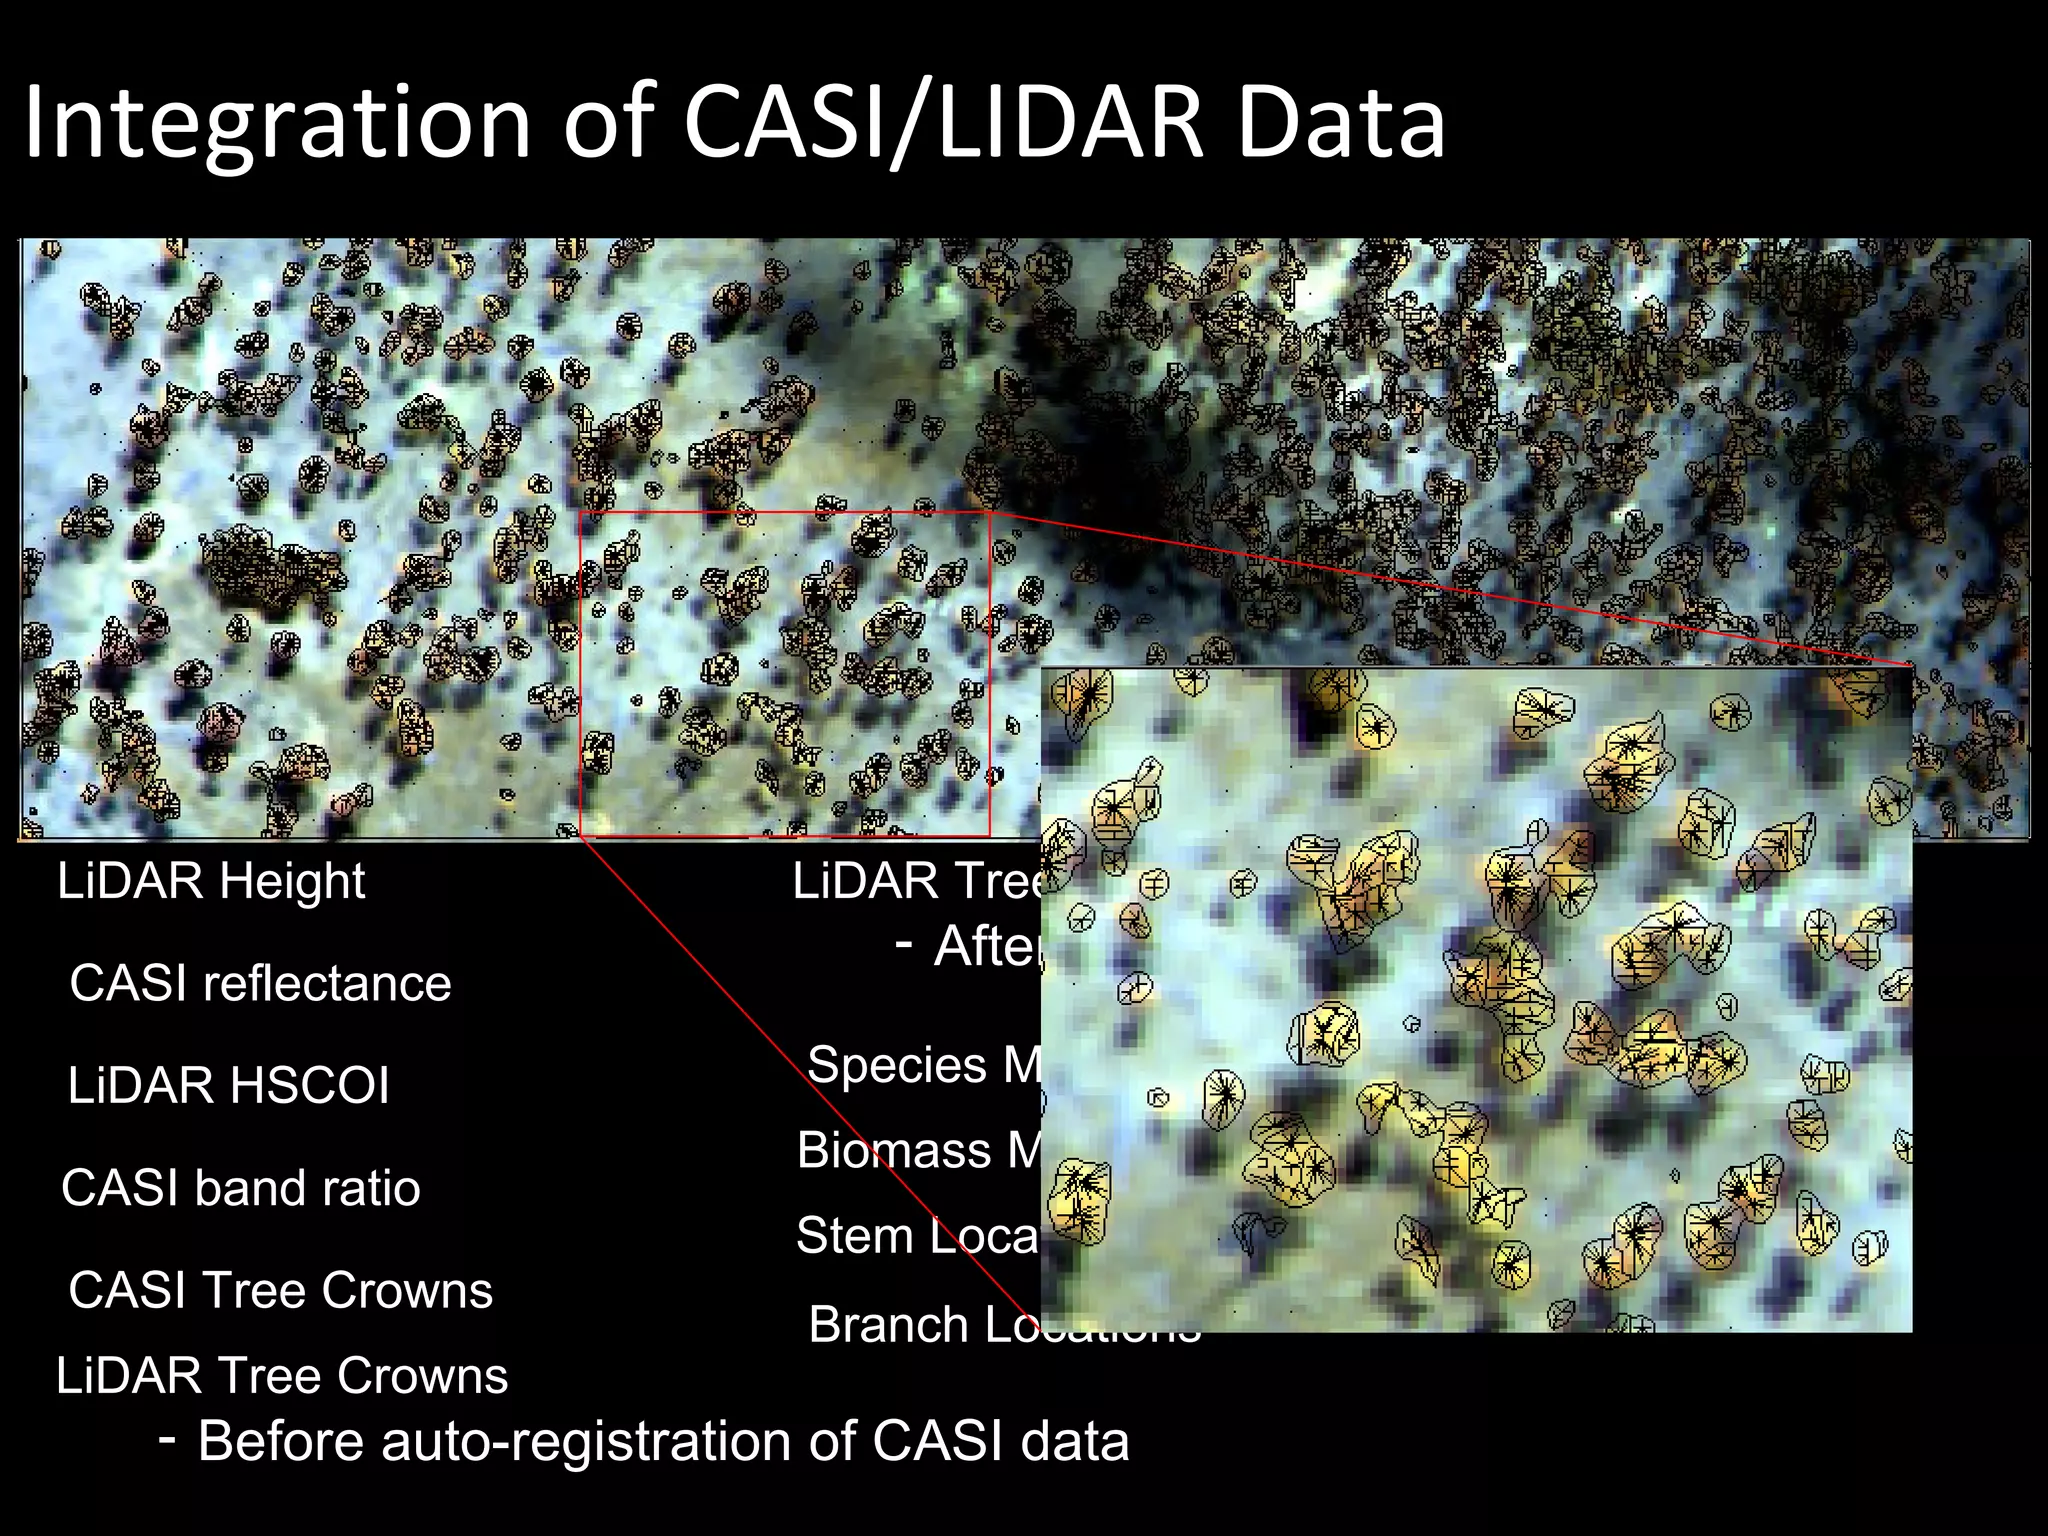
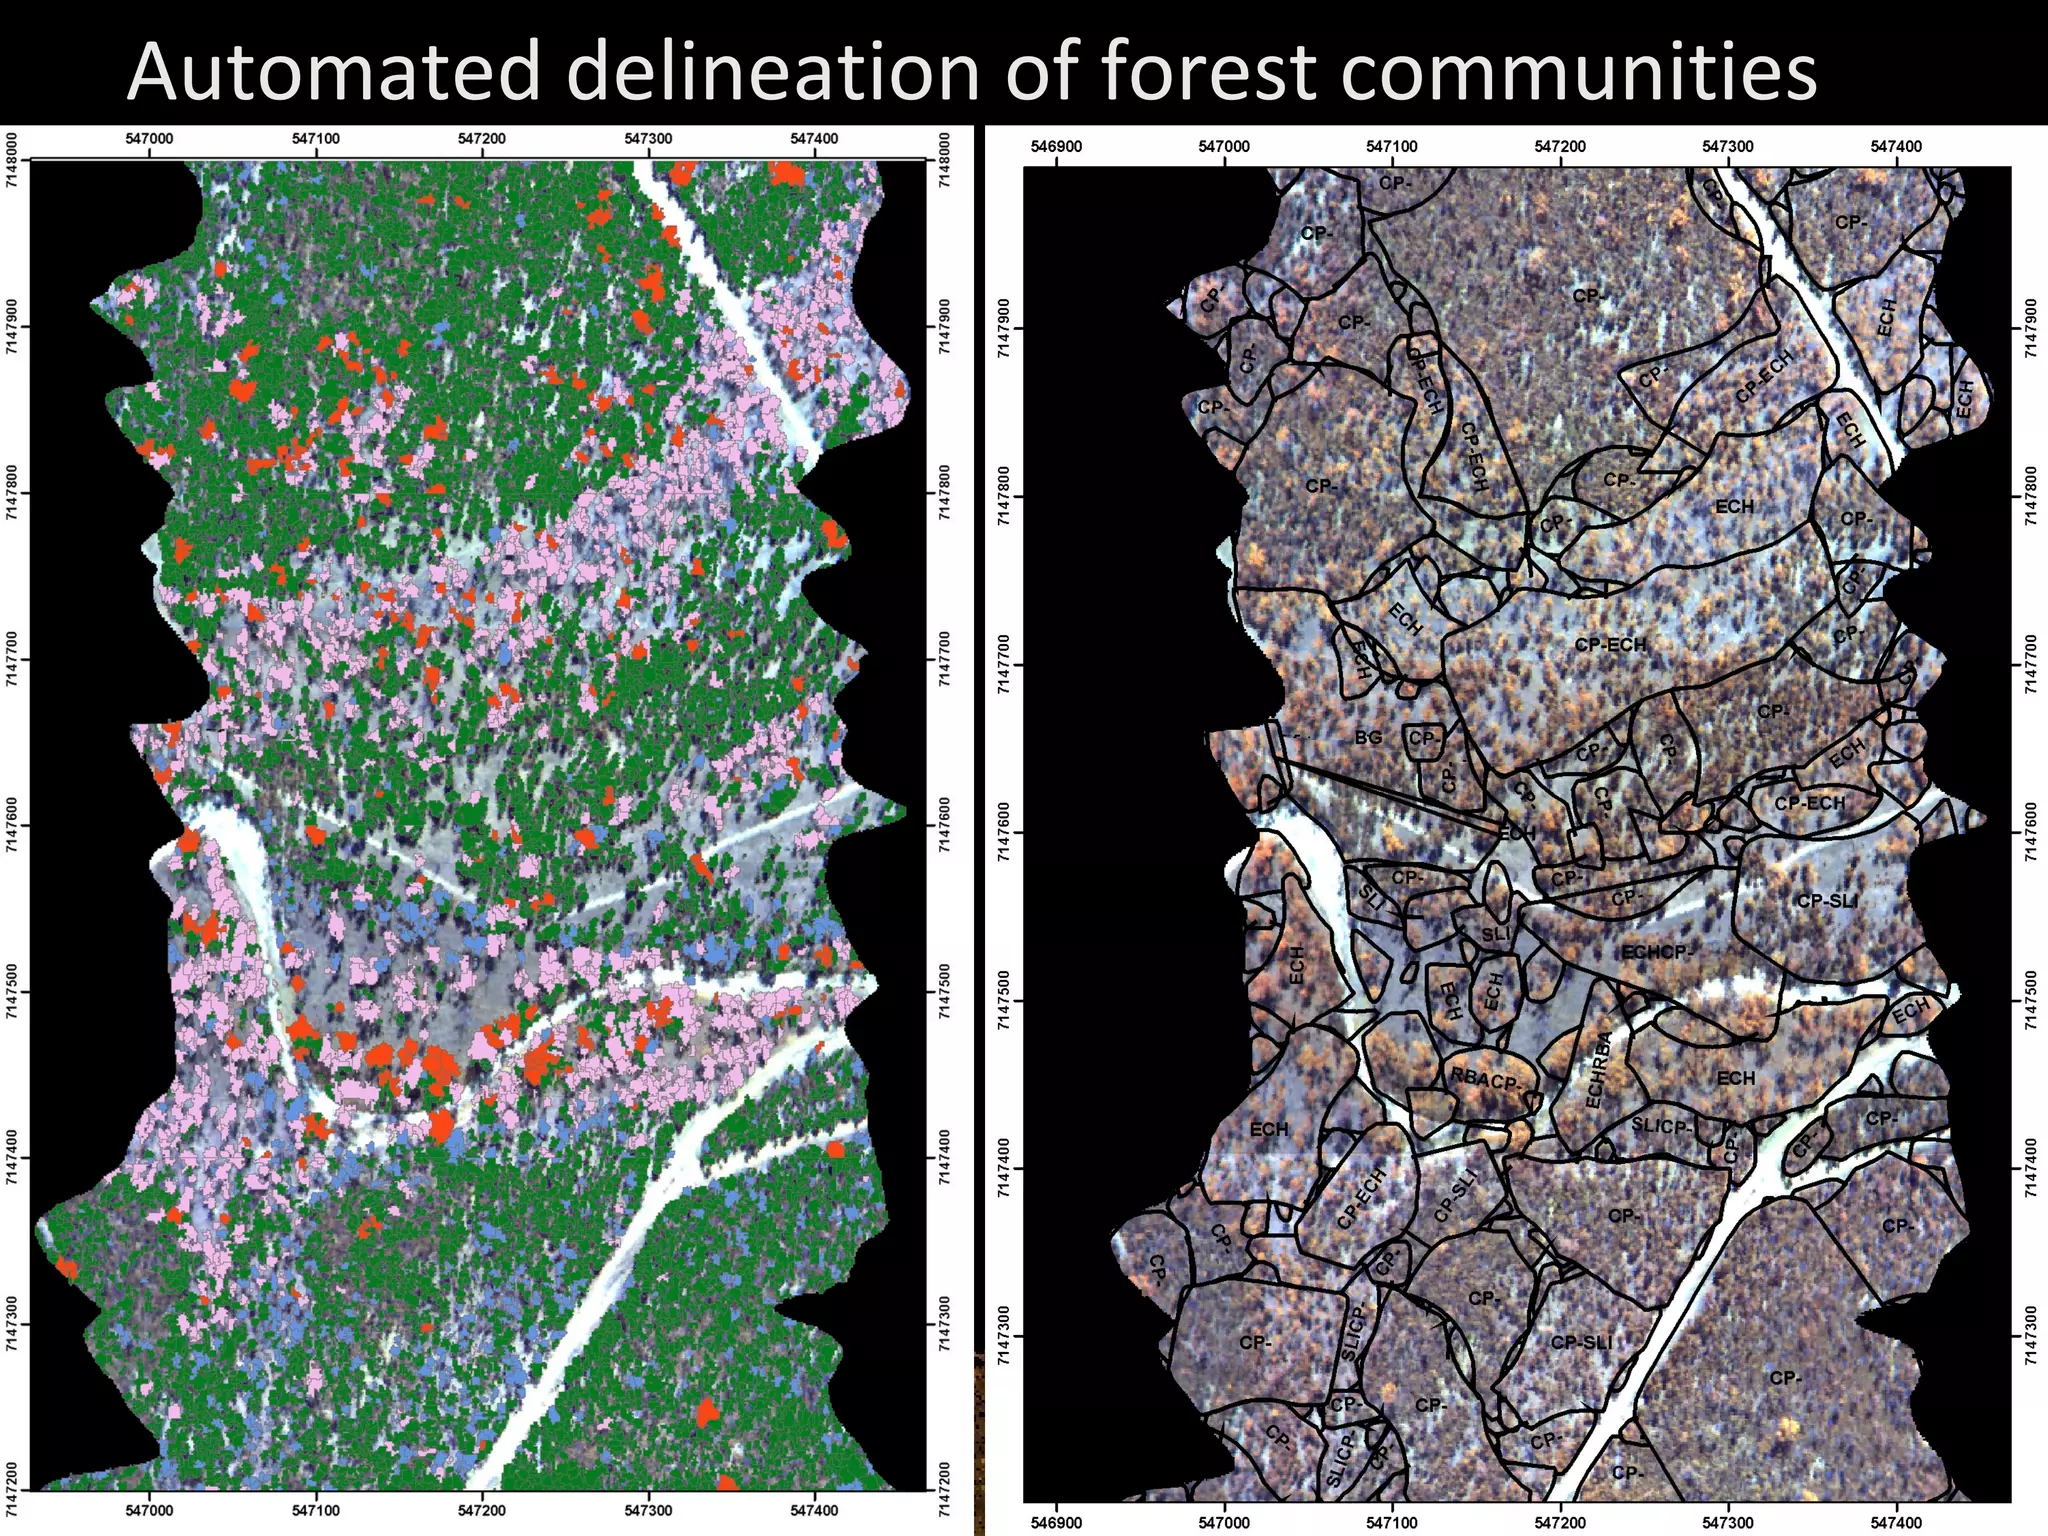
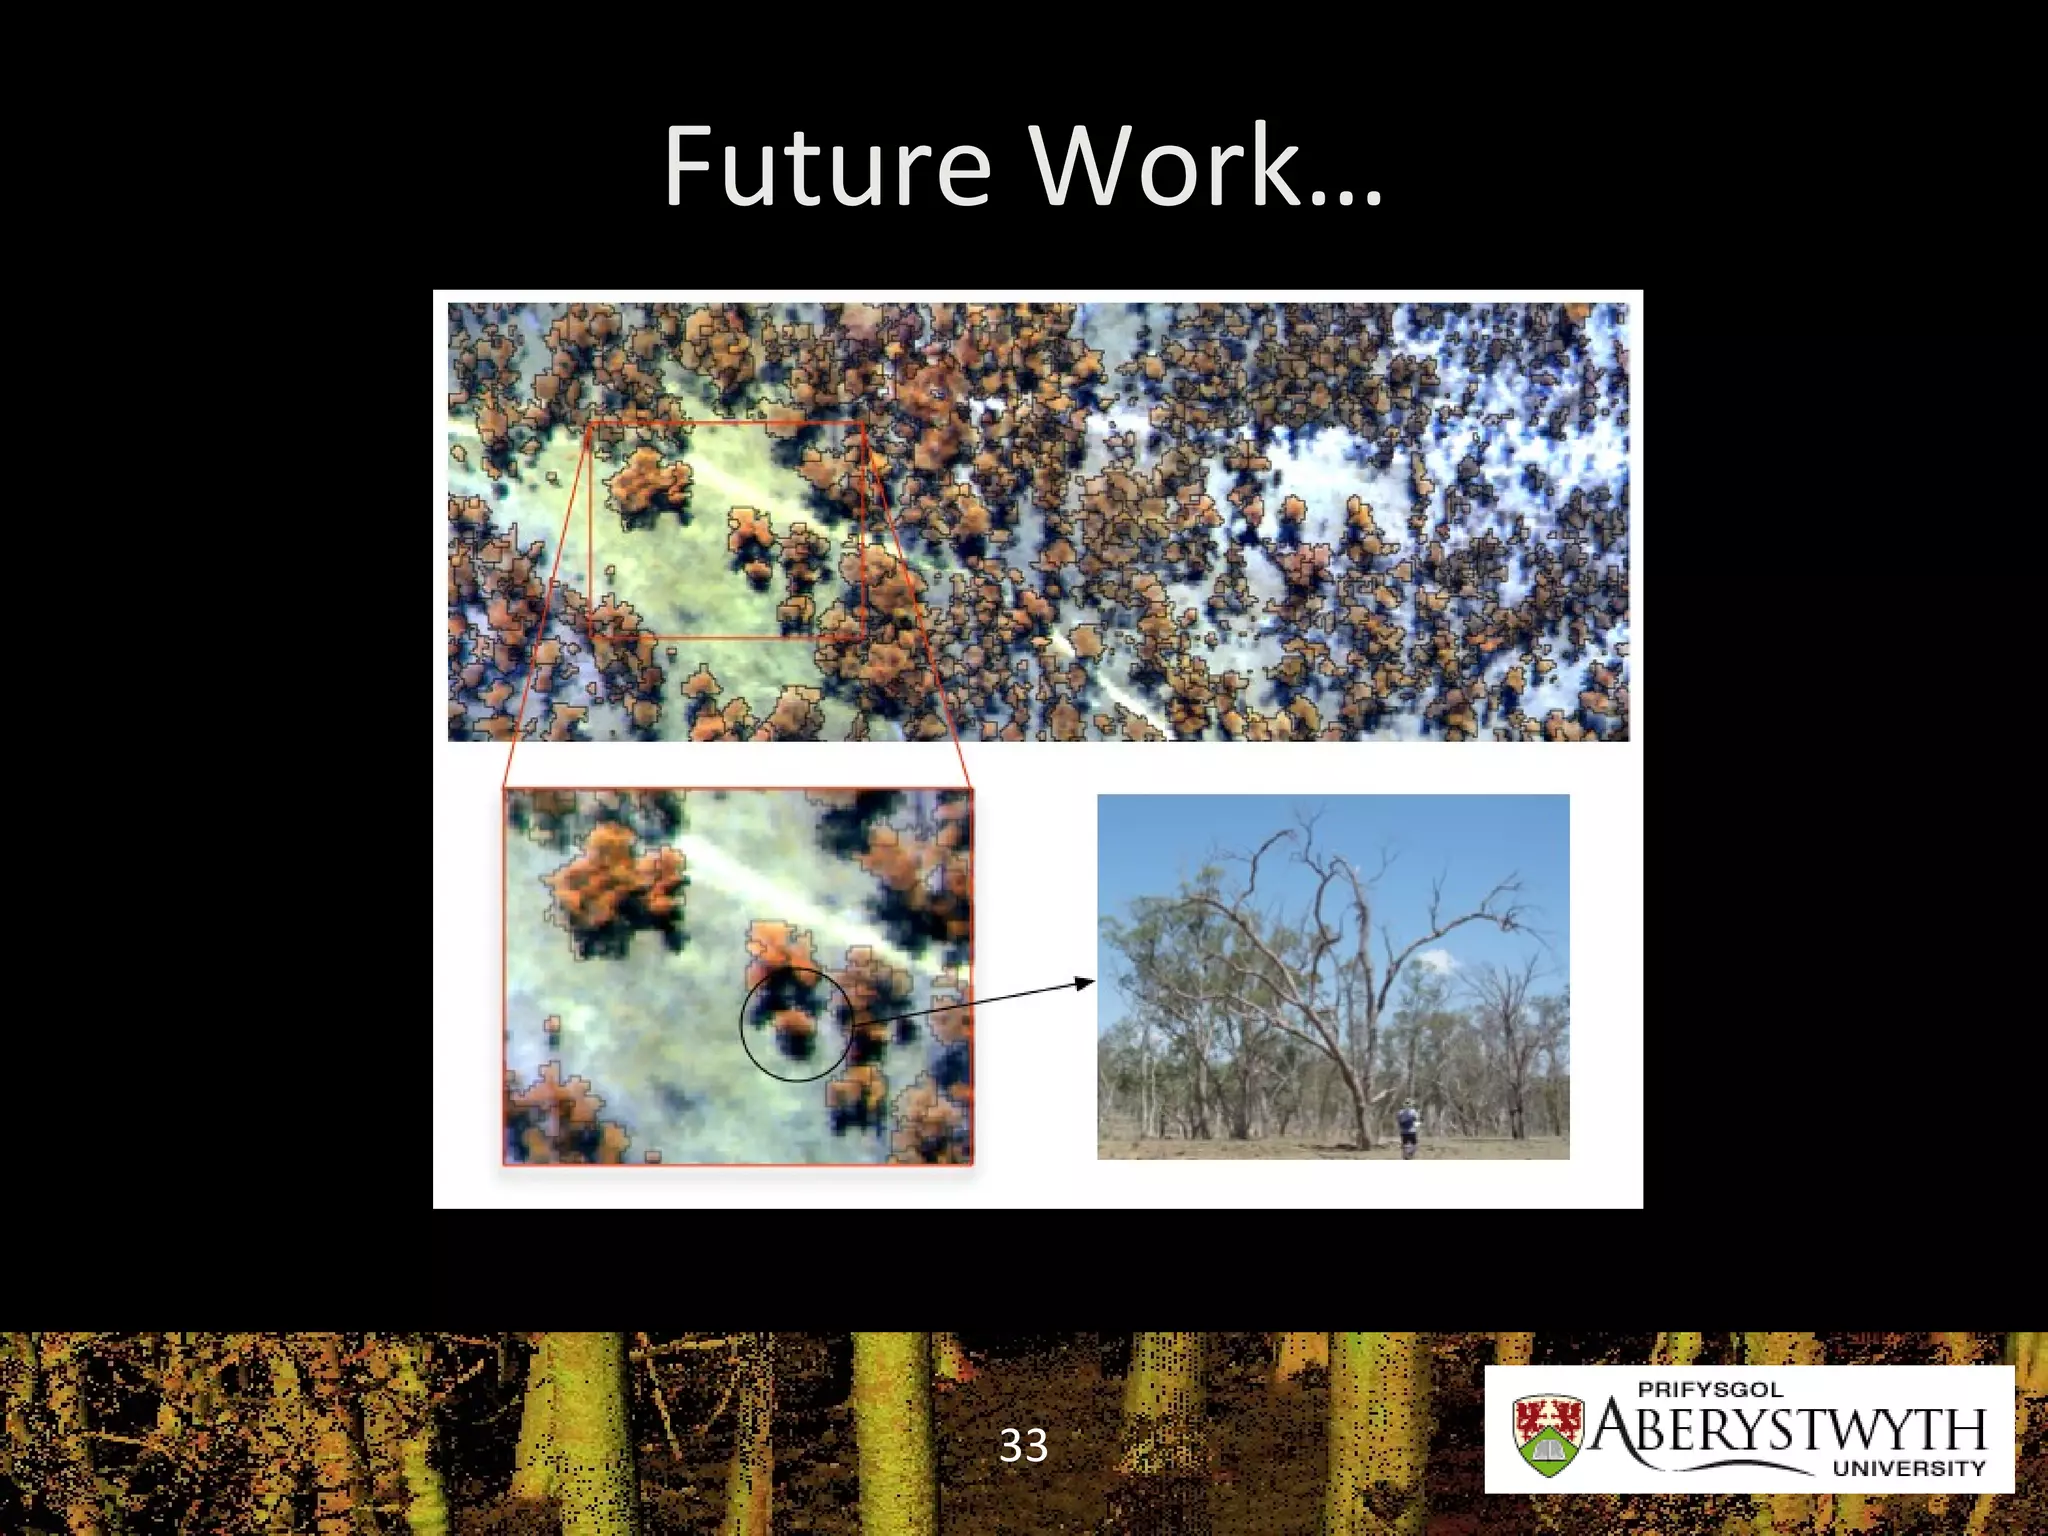
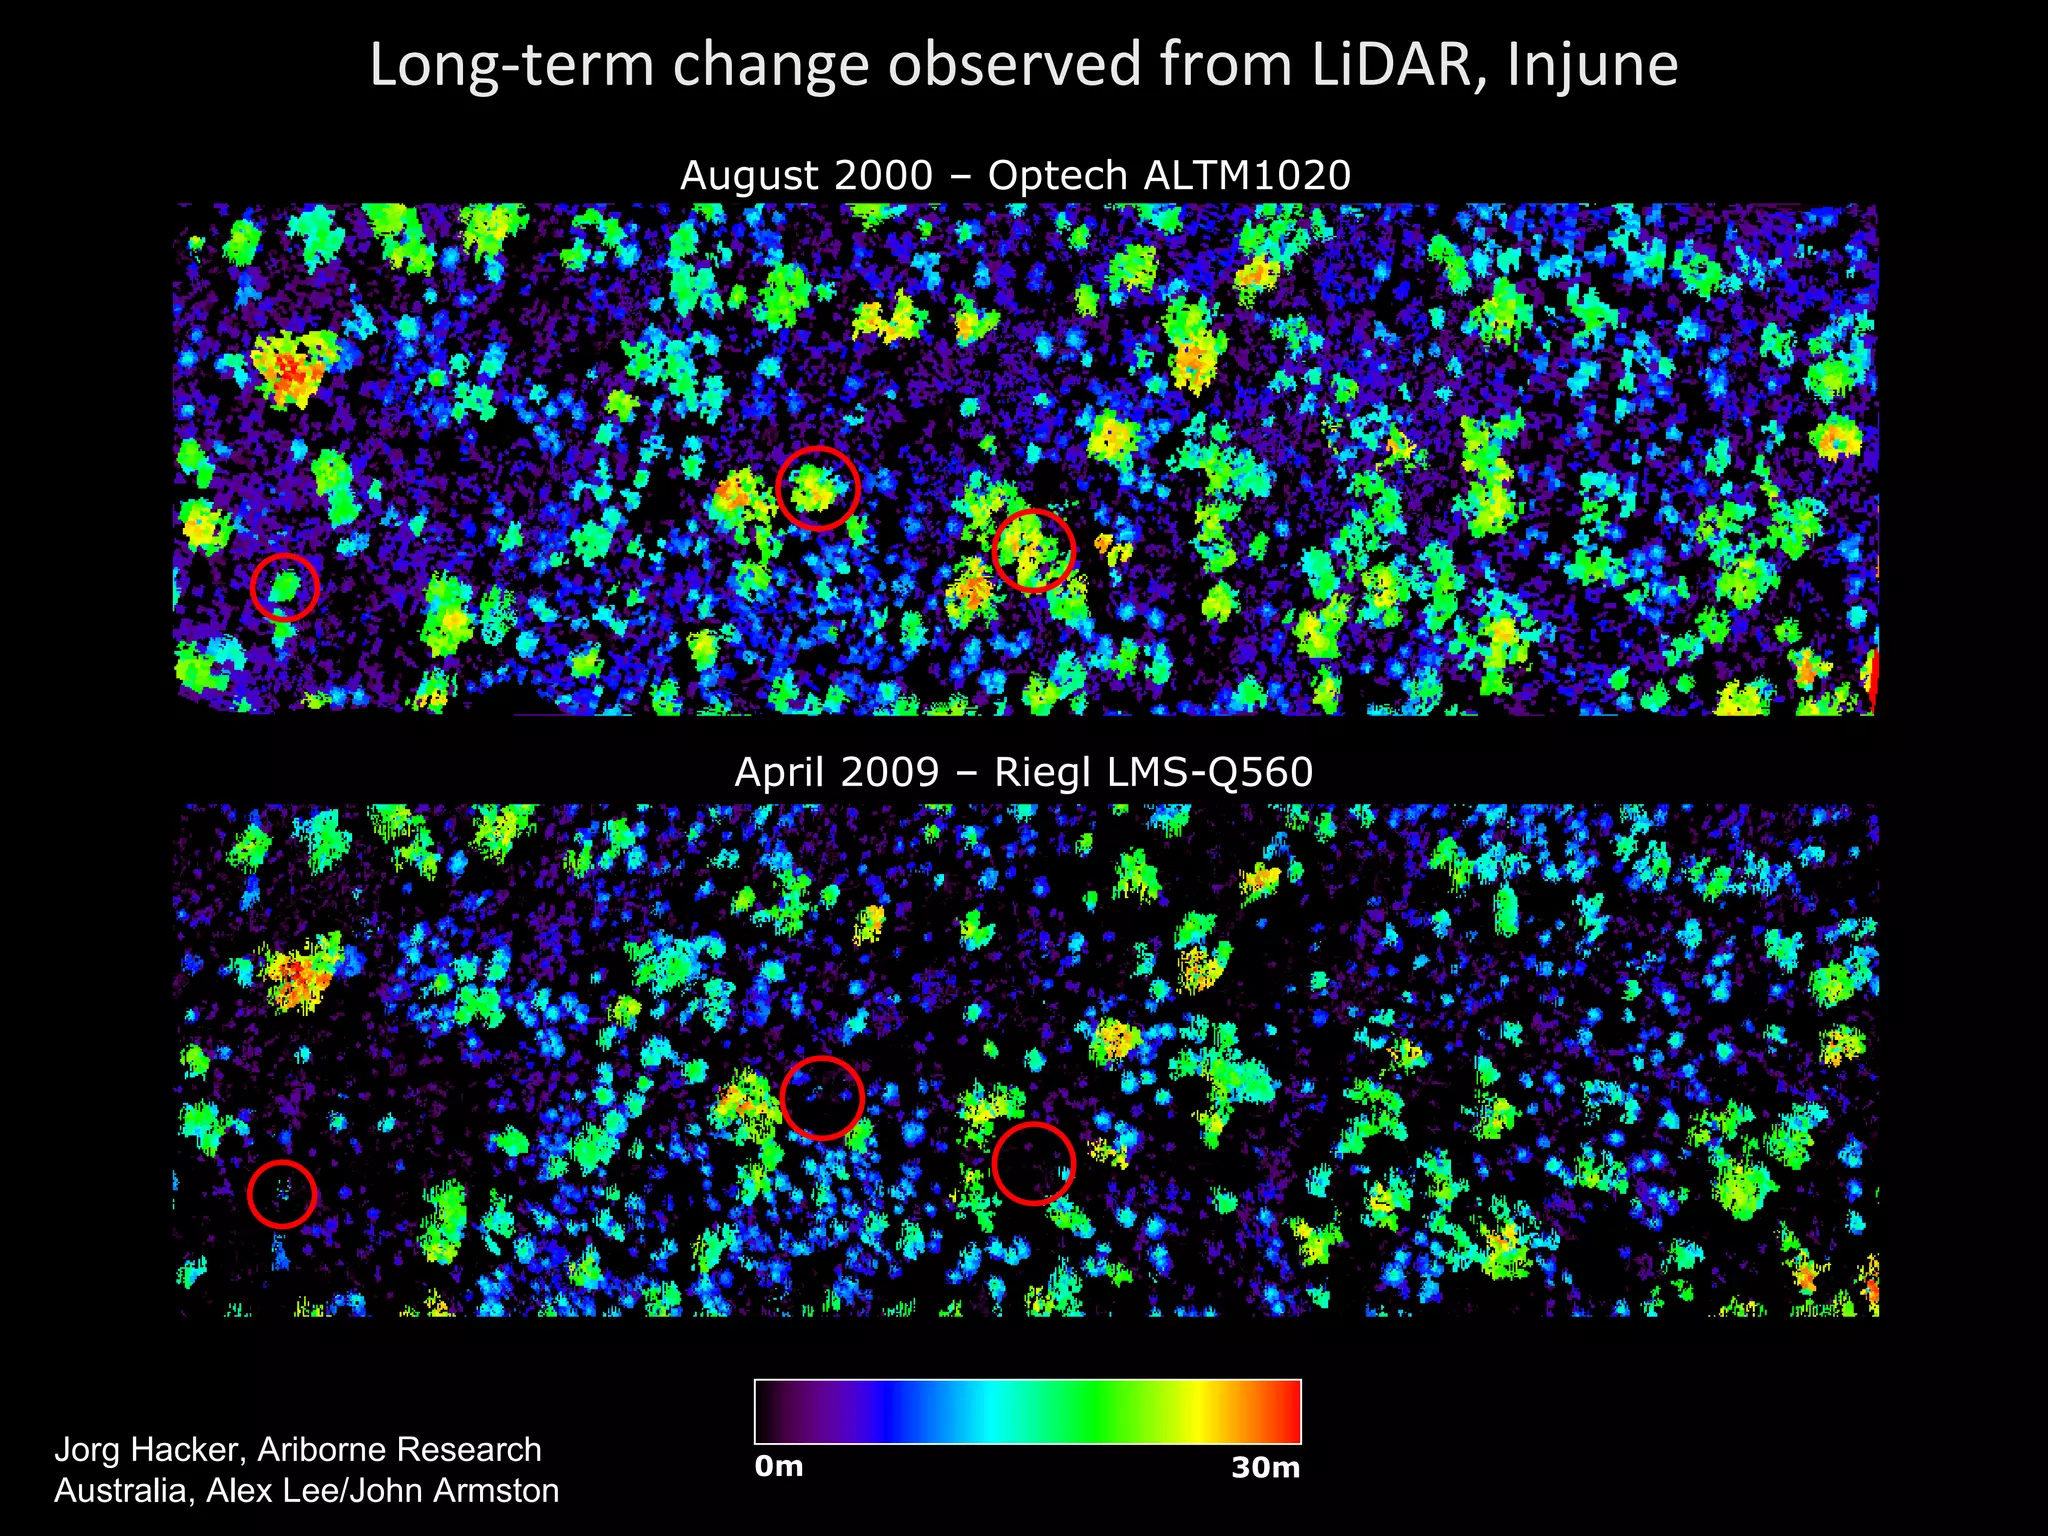
Advances in the use of eCognition for forest research and applications Dr. Pete Bunting
Contents Individual tree analysis High resolution forest mask Delineation Approach Fusing with other high resolution data Scaling to the landscape Future work…
Individual Tree Analysis
Forest Mask To delineate crowns the non-tree areas need to be removed. Otherwise, bright areas (e.g., bare soil) would be delineated as if they were crowns. Unfortunately, there is no single solution to the classification of forest/non-forest from high resolution imagery.  But, there are methodologies which can help.
Indexes and Indices for Forest Discrimination Normalised  Difference Vegetation Index (NDVI). Forest Discrimination Index (FDI) Requires hyper-spectral data over the red edge.
Forest Discrimination Methodology A common problem is the variability in image brightness across the scene.  North/South facing slops Sensor noise Contrast with other ground cover types. Using two levels where the discrimination threshold(s) is varied with respect to the brightness of the upper level.
Forest Discrimination Methodology Image processed in sections (large segments). Do not need to be squares any segmentation will do.
Individual Tree Analysis
Hill and Valley Model It is helpful to view the data with this model. Works with either brightness or height. High points the crown tops. Valleys crown edges.
Individual Tree Analysis
Splitting the Forest into Crowns We locate the bright areas of the crown and grow to the crown edge.
Using a Global Variable Simplify your process with a variable: Without With Setup variable Loop until reach the required value Increment the variable
Individual Tree Analysis
Merging Small Objects During the splitting process small bits of crowns can ‘knocked off’. Following splitting a process which merges small objects (a few pixels in size) with their largest neighbor is executed.
Individual Tree Analysis
Classifying Tree Crowns Objects representing whole crowns were classified to prevent further splitting. Rules to identify crowns are mostly based on their shape properties, including Elliptical fit, Roundness, Length/width ratio. Additionally, some spectral properties can be useful For example, standard deviation.
Individual Tree Analysis
Examples of Merging Crowns Bright point merging Including small objects Before After Before After Relative Border Relative size Before After Before After
 
 
Parco Nazionale d’Abruzzo, Lazio e Molise, Italy www.definiens.com
Object Variables: Mean-lit Spectra To associate delineated crowns with a species type, we extract and use the reflectance spectra from the ‘brightest’ part of the crown. These ‘mean-lit’ spectra allow better discrimination between tree species. eCognition allows the extraction of values on a per object basis and their assignment as local variables (e.g., tree reflectance spectra). These can be used as object features in the subsequent classification of species. Level 2 Level 1
Object Variables for Tree Species Classification Object Mean Object Variables
An example of tree species classification in Australia Stereo Air-Photo Eucalyptus populnea Eucalyptus melanaphloia
LiDAR Height CASI reflectance LiDAR HSCOI CASI band ratio CASI Tree Crowns LiDAR Tree Crowns  Before auto-registration of CASI data LiDAR Tree Crowns  After auto-registration of CASI data Species Map of crowns from CASI data Biomass Map Stem Locations Integration of CASI/LIDAR Data Branch Locations
Automated delineation of forest communities
Landsat / AIRSAR Classification Using grids (at 25 m resolution) and the dominate and co-dominate species Landsat spectral data Landsat FPC AIRSAR LHH and LHV (Available on ALOS-PALSAR) Produce a rulebase object-oriented classification
Comparison to Landsat CASI Species Crown Cover
Identifying thresholds
eCognition Process
Classification of Communities Integration of L-band (HH/HV) SAR and optical Landsat data. Rules identified using communities identified from the high resolution datasets.
Future Work…
Long-term change observed from LiDAR, Injune August 2000 – Optech ALTM1020 April 2009 – Riegl LMS-Q560 0m 30m Height Jorg Hacker, Ariborne Research Australia, Alex Lee/John Armston
LiDAR v TLS
Thank you for listening [email_address]

E Cognition User Summit2009 Pbunting University Wales Forestry

  • 1.
    Advances in theuse of eCognition for forest research and applications Dr. Pete Bunting
  • 2.
    Contents Individual treeanalysis High resolution forest mask Delineation Approach Fusing with other high resolution data Scaling to the landscape Future work…
  • 3.
  • 4.
  • 5.
    Forest Mask Todelineate crowns the non-tree areas need to be removed. Otherwise, bright areas (e.g., bare soil) would be delineated as if they were crowns. Unfortunately, there is no single solution to the classification of forest/non-forest from high resolution imagery. But, there are methodologies which can help.
  • 6.
    Indexes and Indicesfor Forest Discrimination Normalised Difference Vegetation Index (NDVI). Forest Discrimination Index (FDI) Requires hyper-spectral data over the red edge.
  • 7.
    Forest Discrimination MethodologyA common problem is the variability in image brightness across the scene. North/South facing slops Sensor noise Contrast with other ground cover types. Using two levels where the discrimination threshold(s) is varied with respect to the brightness of the upper level.
  • 8.
    Forest Discrimination MethodologyImage processed in sections (large segments). Do not need to be squares any segmentation will do.
  • 9.
  • 10.
    Hill and ValleyModel It is helpful to view the data with this model. Works with either brightness or height. High points the crown tops. Valleys crown edges.
  • 11.
  • 12.
    Splitting the Forestinto Crowns We locate the bright areas of the crown and grow to the crown edge.
  • 13.
    Using a GlobalVariable Simplify your process with a variable: Without With Setup variable Loop until reach the required value Increment the variable
  • 14.
  • 15.
    Merging Small ObjectsDuring the splitting process small bits of crowns can ‘knocked off’. Following splitting a process which merges small objects (a few pixels in size) with their largest neighbor is executed.
  • 16.
  • 17.
    Classifying Tree CrownsObjects representing whole crowns were classified to prevent further splitting. Rules to identify crowns are mostly based on their shape properties, including Elliptical fit, Roundness, Length/width ratio. Additionally, some spectral properties can be useful For example, standard deviation.
  • 18.
  • 19.
    Examples of MergingCrowns Bright point merging Including small objects Before After Before After Relative Border Relative size Before After Before After
  • 20.
  • 21.
  • 22.
    Parco Nazionale d’Abruzzo,Lazio e Molise, Italy www.definiens.com
  • 23.
    Object Variables: Mean-litSpectra To associate delineated crowns with a species type, we extract and use the reflectance spectra from the ‘brightest’ part of the crown. These ‘mean-lit’ spectra allow better discrimination between tree species. eCognition allows the extraction of values on a per object basis and their assignment as local variables (e.g., tree reflectance spectra). These can be used as object features in the subsequent classification of species. Level 2 Level 1
  • 24.
    Object Variables forTree Species Classification Object Mean Object Variables
  • 25.
    An example oftree species classification in Australia Stereo Air-Photo Eucalyptus populnea Eucalyptus melanaphloia
  • 26.
    LiDAR Height CASIreflectance LiDAR HSCOI CASI band ratio CASI Tree Crowns LiDAR Tree Crowns Before auto-registration of CASI data LiDAR Tree Crowns After auto-registration of CASI data Species Map of crowns from CASI data Biomass Map Stem Locations Integration of CASI/LIDAR Data Branch Locations
  • 27.
    Automated delineation offorest communities
  • 28.
    Landsat / AIRSARClassification Using grids (at 25 m resolution) and the dominate and co-dominate species Landsat spectral data Landsat FPC AIRSAR LHH and LHV (Available on ALOS-PALSAR) Produce a rulebase object-oriented classification
  • 29.
    Comparison to LandsatCASI Species Crown Cover
  • 30.
  • 31.
  • 32.
    Classification of CommunitiesIntegration of L-band (HH/HV) SAR and optical Landsat data. Rules identified using communities identified from the high resolution datasets.
  • 33.
  • 34.
    Long-term change observedfrom LiDAR, Injune August 2000 – Optech ALTM1020 April 2009 – Riegl LMS-Q560 0m 30m Height Jorg Hacker, Ariborne Research Australia, Alex Lee/John Armston
  • 35.
  • 36.
    Thank you forlistening [email_address]

Editor's Notes

  • #30 Species, cover, shannon, Simpson
  • #34 8% decrease in rainfall..