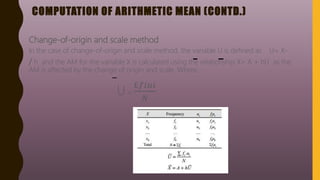
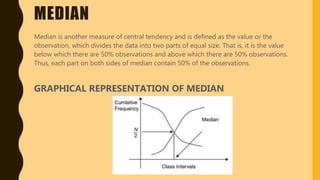
PRESENTATION OF
STATISTICAL QUALITY
CONTROL
CONTENTS
INTRODUCTION OF THE CENTRAL TENDENCY
MEASURE OF CENTRAL TENDENCY
ARITHMETIC MEAN
COMPUTATION OF ARITHMETIC MEAN
MEDIAN
COMPUTATION OF MEDIAN
MODE
COMPUTATION OF MODE
CONCLUSION
MEASURES OF
CENTRAL
TENDENCY
INTRODUCTION OF THE CENTRAL TENDENCY
We have seen that in order to understand the data collected in
statistics, the data can be classified and represented graphically. What next?
After classifying the data, their central tendency can be studied. Generally
in statistics, the observations of the data collected are concentrated around
the central value of the data. This tendency of the observations toward the
central value is called the central tendency. If this central tendency of the data
is quantified or measured, then it can be treated as the representative of the
data and can be used for the comparison of the central tendency of the data.
For example, if a textile engineer makes 10 count tests on the same yarn, he
will get 10 different values. What conclusion should he come to about the
count of the yarn? But if all the 10 results are observed carefully, then they
will be concentrated around some value that can be measured and can be
representative.
MEASURE OF CENTRAL TENDENCY
Any numeric figure or the value, which gives idea regarding the
central tendency of the data, is called the measure of central
tendency. In practice, it is also called an “average.” There are
several measures of central tendency, and each of them has
some advantages and disadvantages. Arithmetic mean (AM),
median, mode, weighted AM, harmonic mean, and geometric
mean are some of the main average
ARITHMETIC MEAN
This is the most popular and commonly used measure of central tendency,
as it is based on all observations and is simple by its definition. It can also be
used for further mathematical calculations. The AM is defined as follows:
Arithmetic Mean =
𝑇𝑜𝑡𝑎𝑙 𝑜𝑓 𝑎𝑙𝑙 𝑜𝑏𝑠𝑒𝑟𝑣𝑎𝑡𝑖𝑜𝑛𝑠
𝑇𝑜𝑡𝑎𝑙 𝑛𝑜.𝑜𝑓 𝑜𝑏𝑠𝑒𝑟𝑣𝑎𝑡𝑖𝑜𝑛𝑠
In particular,
Suppose X is the variable of the data. The AM of the variable X will be
denoted by X and will be define as follows:
Case I : If the data contain only ‘n’ observations x1, x2 …, xn of the variable X,
then the AM is defined as follows:
ARITHMETIC MEAN (CONTD.)
Case II : If the data are in the ungrouped frequency distribution form with x1, x2, …, xk as the
possible values and f1,f2, …, fk as the frequencies, then the AM of the data is defined as follows:
Case III If the data are in the grouped frequency distribution form with x1,x2, …, xk as the mid-
points of the class intervals and f1, f2, …,f k v as the class frequencies, then the AM of the data is
defined as follows
PROPERTIES OF AM
1.If X1 is the AM of first data of n1 observations and X2 is the AM of second data of n2 observations,
then the mean of the combined data of n1+ n2 observations can be given as follows:
2. AM is affected by change of origin as well as the scale.
COMPUTATION OF ARITHMETIC MEAN
1.Direct method
In this case, AM is calculated directly using the formula and by preparing a table such as :
COMPUTATION OF ARITHMETIC MEAN (CONTD.)
2.Indirect method
In this case, AM is calculated indirectly by transforming the variable X in to another variable
There are two ways of transforming the variable X into the variable U.
Change-of-origin method
In the case of change-of-origin method, the variable is defined as U=X−A and the AM for
variable X is calculated using the relationship as X = A + U the AM is affected by the change
origin. Where,
In addition, the AM is calculated by preparing a table and by using the above formulae as
follows:
COMPUTATION OF ARITHMETIC MEAN (CONTD.)
Change-of-origin and scale method
In the case of change-of-origin and scale method, the variable U is defined as U= X-
/ h and the AM for the variable X is calculated using the relationship X= A + hU as the
AM is affected by the change of origin and scale. Where,
U =
£𝑓𝑖𝑢𝑖
𝑁
MEDIAN
Median is another measure of central tendency and is defined as the value or the
observation, which divides the data into two parts of equal size. That is, it is the value
below which there are 50% observations and above which there are 50% observations.
Thus, each part on both sides of median contain 50% of the observations.
GRAPHICAL REPRESENTATION OF MEDIAN
COMPUTATION OF MEDIAN
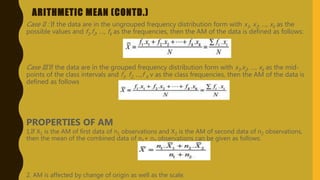
Case I : If the data contain only ‘n’ observations x1, x2, ,…, xn of the variable X, then after arranging
the observations in the increasing/decreasing order of magnitude
Median = [
𝑛+1
2
]th value
Case II If the data are in the ungrouped frequency distribution form with x1,x2 ,…, xk as the possible
values and f1, f2, …, fk as the frequencies, then
Median = [
𝑁+1
2
] th value ,where N = total no. of observations.
Case III If the data are in the grouped frequency distribution form with x1, x2, …, xk as the mid-
points of the class intervals and f1, f2, …, fk as the class frequencies, then
Median = [
𝑁
2
]th value
COMPUTATION OF MEDIAN(CONTD.)
In this case, median that is [
𝑁
2
]th value can be obtained using following steps:
Step 1 Convert the classes into exclusive type (continuous), if they are not of
exclusive.
Step 2 Determine the class interval containing median (median class) by using the
value [
𝑁
2
] and the cumulative frequencies of less than type.
Step 3 Determine median using the formula
where, “L” is the lower boundary of the median class; “h” is the class width
of the median class, ‘f ’is the frequency of the median class and CF(p) is the
cumulative frequency of premedian class.
MODE
This is also one of the important measures of central tendency, which is used widely in
real life. It is defined as the value or the observation of the data, which occurs maximum
number of times, that is, which has maximum frequency, or maximum frequency density
around it.
GRAPHICAL REPRESENTATION OF MODE
COMPUTATION OF MODE
Case I : If the data contain only ‘n’ observations x1, x2, …, x2 of the variable X, then the mode is
the observation, which occurs maximum number of times.
Case II If the data are in the ungrouped frequency distribution form with x1,x2, …, xk as the
possible values and f1, f2, …, fk as the frequencies, then mode is the observation with
frequency
Case III If the data are in the grouped frequency distribution form with x1,x2, …, xk as the mid-
points of the class intervals and f1, f2, …, fk as the class frequencies, then mode is the
observation with maximum frequency density. The mode in this case can be determined
the following steps:
COMPUTATION OF MODE (CONTD.)
Step 1 Convert the classes into the exclusive type (continuous type),if they are not exclusive.
Step 2 Determine the class interval containing mode (Modal class) according to the maximum
frequency.
Step 3 Determine the mode using the following formula
Where,
L represents lower boundary of the modal class, h represents width of the modal class; fm
represents frequency of modal class, f0 represents frequency of premodal class, and fl
represents frequency of postmodal class interval.
CONCLUSION
By performing the presentation on Measures of central tendency ,we have known about
the various forms of calculating the main points of the given data table through
Arithmetic mean ,Median , Mode. Thus, we know to take the tone of a given data set and
prepare a detailed analysis of it.
THANK YOU

Presentation of Statistical Quality Control

  • 1.
  • 2.
    CONTENTS INTRODUCTION OF THECENTRAL TENDENCY MEASURE OF CENTRAL TENDENCY ARITHMETIC MEAN COMPUTATION OF ARITHMETIC MEAN MEDIAN COMPUTATION OF MEDIAN MODE COMPUTATION OF MODE CONCLUSION
  • 3.
  • 4.
    INTRODUCTION OF THECENTRAL TENDENCY We have seen that in order to understand the data collected in statistics, the data can be classified and represented graphically. What next? After classifying the data, their central tendency can be studied. Generally in statistics, the observations of the data collected are concentrated around the central value of the data. This tendency of the observations toward the central value is called the central tendency. If this central tendency of the data is quantified or measured, then it can be treated as the representative of the data and can be used for the comparison of the central tendency of the data. For example, if a textile engineer makes 10 count tests on the same yarn, he will get 10 different values. What conclusion should he come to about the count of the yarn? But if all the 10 results are observed carefully, then they will be concentrated around some value that can be measured and can be representative.
  • 5.
    MEASURE OF CENTRALTENDENCY Any numeric figure or the value, which gives idea regarding the central tendency of the data, is called the measure of central tendency. In practice, it is also called an “average.” There are several measures of central tendency, and each of them has some advantages and disadvantages. Arithmetic mean (AM), median, mode, weighted AM, harmonic mean, and geometric mean are some of the main average
  • 6.
    ARITHMETIC MEAN This isthe most popular and commonly used measure of central tendency, as it is based on all observations and is simple by its definition. It can also be used for further mathematical calculations. The AM is defined as follows: Arithmetic Mean = 𝑇𝑜𝑡𝑎𝑙 𝑜𝑓 𝑎𝑙𝑙 𝑜𝑏𝑠𝑒𝑟𝑣𝑎𝑡𝑖𝑜𝑛𝑠 𝑇𝑜𝑡𝑎𝑙 𝑛𝑜.𝑜𝑓 𝑜𝑏𝑠𝑒𝑟𝑣𝑎𝑡𝑖𝑜𝑛𝑠 In particular, Suppose X is the variable of the data. The AM of the variable X will be denoted by X and will be define as follows: Case I : If the data contain only ‘n’ observations x1, x2 …, xn of the variable X, then the AM is defined as follows:
  • 7.
    ARITHMETIC MEAN (CONTD.) CaseII : If the data are in the ungrouped frequency distribution form with x1, x2, …, xk as the possible values and f1,f2, …, fk as the frequencies, then the AM of the data is defined as follows: Case III If the data are in the grouped frequency distribution form with x1,x2, …, xk as the mid- points of the class intervals and f1, f2, …,f k v as the class frequencies, then the AM of the data is defined as follows PROPERTIES OF AM 1.If X1 is the AM of first data of n1 observations and X2 is the AM of second data of n2 observations, then the mean of the combined data of n1+ n2 observations can be given as follows: 2. AM is affected by change of origin as well as the scale.
  • 8.
    COMPUTATION OF ARITHMETICMEAN 1.Direct method In this case, AM is calculated directly using the formula and by preparing a table such as :
  • 9.
    COMPUTATION OF ARITHMETICMEAN (CONTD.) 2.Indirect method In this case, AM is calculated indirectly by transforming the variable X in to another variable There are two ways of transforming the variable X into the variable U. Change-of-origin method In the case of change-of-origin method, the variable is defined as U=X−A and the AM for variable X is calculated using the relationship as X = A + U the AM is affected by the change origin. Where, In addition, the AM is calculated by preparing a table and by using the above formulae as follows:
  • 10.
    COMPUTATION OF ARITHMETICMEAN (CONTD.) Change-of-origin and scale method In the case of change-of-origin and scale method, the variable U is defined as U= X- / h and the AM for the variable X is calculated using the relationship X= A + hU as the AM is affected by the change of origin and scale. Where, U = £𝑓𝑖𝑢𝑖 𝑁
  • 11.
    MEDIAN Median is anothermeasure of central tendency and is defined as the value or the observation, which divides the data into two parts of equal size. That is, it is the value below which there are 50% observations and above which there are 50% observations. Thus, each part on both sides of median contain 50% of the observations. GRAPHICAL REPRESENTATION OF MEDIAN
  • 12.
    COMPUTATION OF MEDIAN CaseI : If the data contain only ‘n’ observations x1, x2, ,…, xn of the variable X, then after arranging the observations in the increasing/decreasing order of magnitude Median = [ 𝑛+1 2 ]th value Case II If the data are in the ungrouped frequency distribution form with x1,x2 ,…, xk as the possible values and f1, f2, …, fk as the frequencies, then Median = [ 𝑁+1 2 ] th value ,where N = total no. of observations. Case III If the data are in the grouped frequency distribution form with x1, x2, …, xk as the mid- points of the class intervals and f1, f2, …, fk as the class frequencies, then Median = [ 𝑁 2 ]th value
  • 13.
    COMPUTATION OF MEDIAN(CONTD.) Inthis case, median that is [ 𝑁 2 ]th value can be obtained using following steps: Step 1 Convert the classes into exclusive type (continuous), if they are not of exclusive. Step 2 Determine the class interval containing median (median class) by using the value [ 𝑁 2 ] and the cumulative frequencies of less than type. Step 3 Determine median using the formula where, “L” is the lower boundary of the median class; “h” is the class width of the median class, ‘f ’is the frequency of the median class and CF(p) is the cumulative frequency of premedian class.
  • 14.
    MODE This is alsoone of the important measures of central tendency, which is used widely in real life. It is defined as the value or the observation of the data, which occurs maximum number of times, that is, which has maximum frequency, or maximum frequency density around it. GRAPHICAL REPRESENTATION OF MODE
  • 15.
    COMPUTATION OF MODE CaseI : If the data contain only ‘n’ observations x1, x2, …, x2 of the variable X, then the mode is the observation, which occurs maximum number of times. Case II If the data are in the ungrouped frequency distribution form with x1,x2, …, xk as the possible values and f1, f2, …, fk as the frequencies, then mode is the observation with frequency Case III If the data are in the grouped frequency distribution form with x1,x2, …, xk as the mid- points of the class intervals and f1, f2, …, fk as the class frequencies, then mode is the observation with maximum frequency density. The mode in this case can be determined the following steps:
  • 16.
    COMPUTATION OF MODE(CONTD.) Step 1 Convert the classes into the exclusive type (continuous type),if they are not exclusive. Step 2 Determine the class interval containing mode (Modal class) according to the maximum frequency. Step 3 Determine the mode using the following formula Where, L represents lower boundary of the modal class, h represents width of the modal class; fm represents frequency of modal class, f0 represents frequency of premodal class, and fl represents frequency of postmodal class interval.
  • 17.
    CONCLUSION By performing thepresentation on Measures of central tendency ,we have known about the various forms of calculating the main points of the given data table through Arithmetic mean ,Median , Mode. Thus, we know to take the tone of a given data set and prepare a detailed analysis of it.
  • 18.