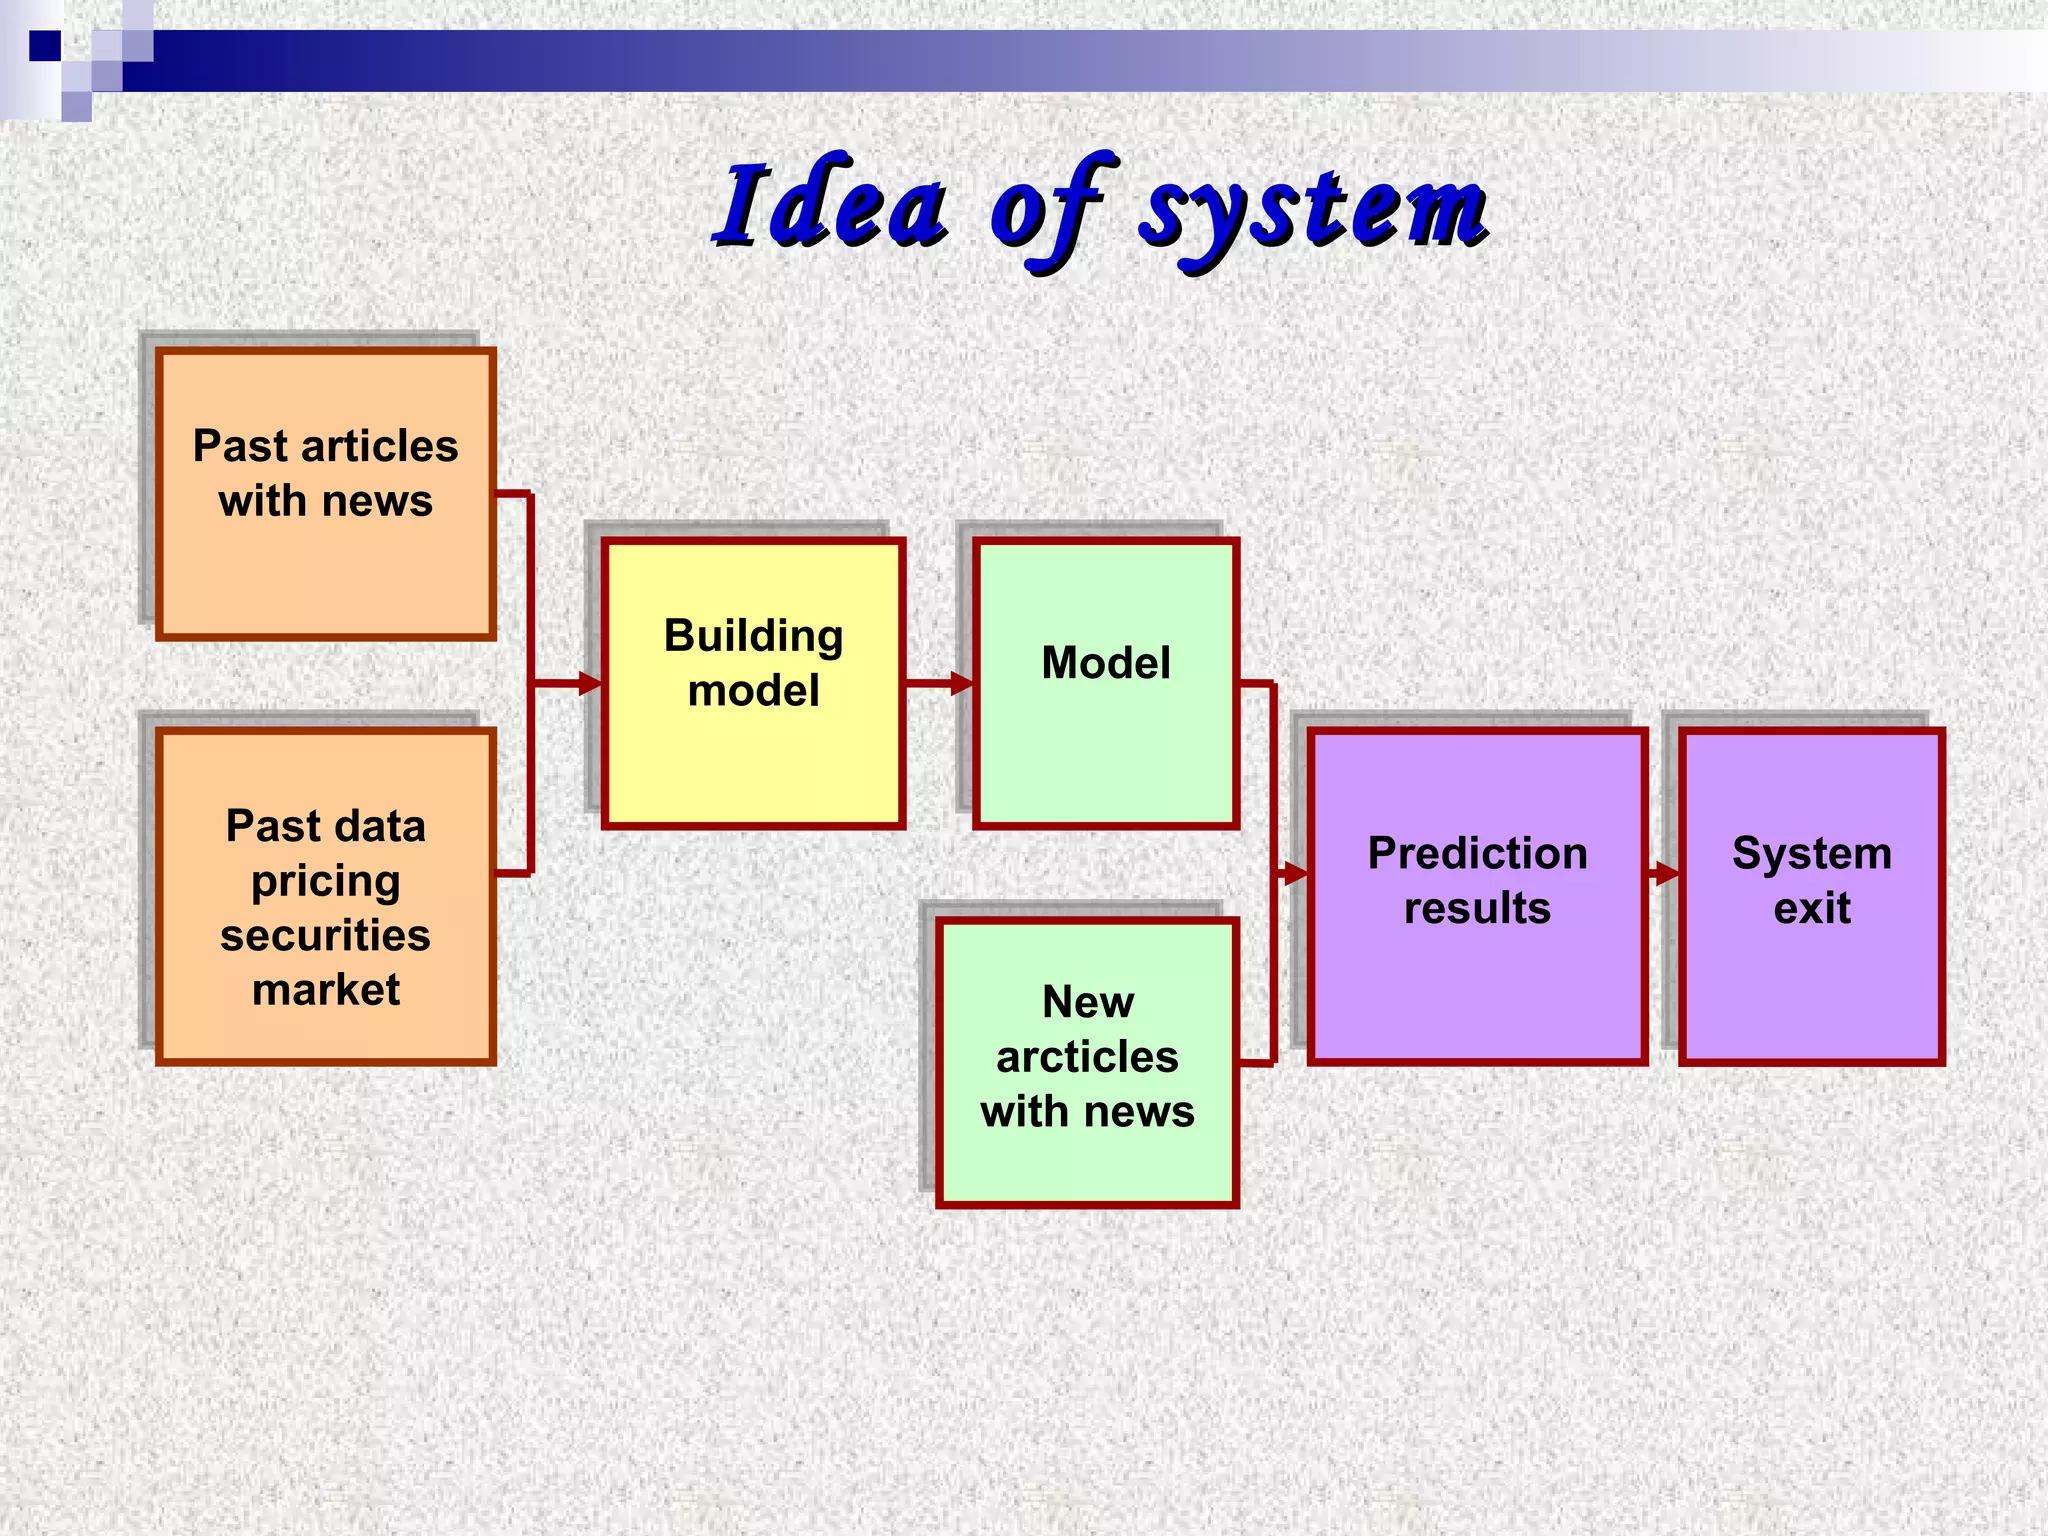
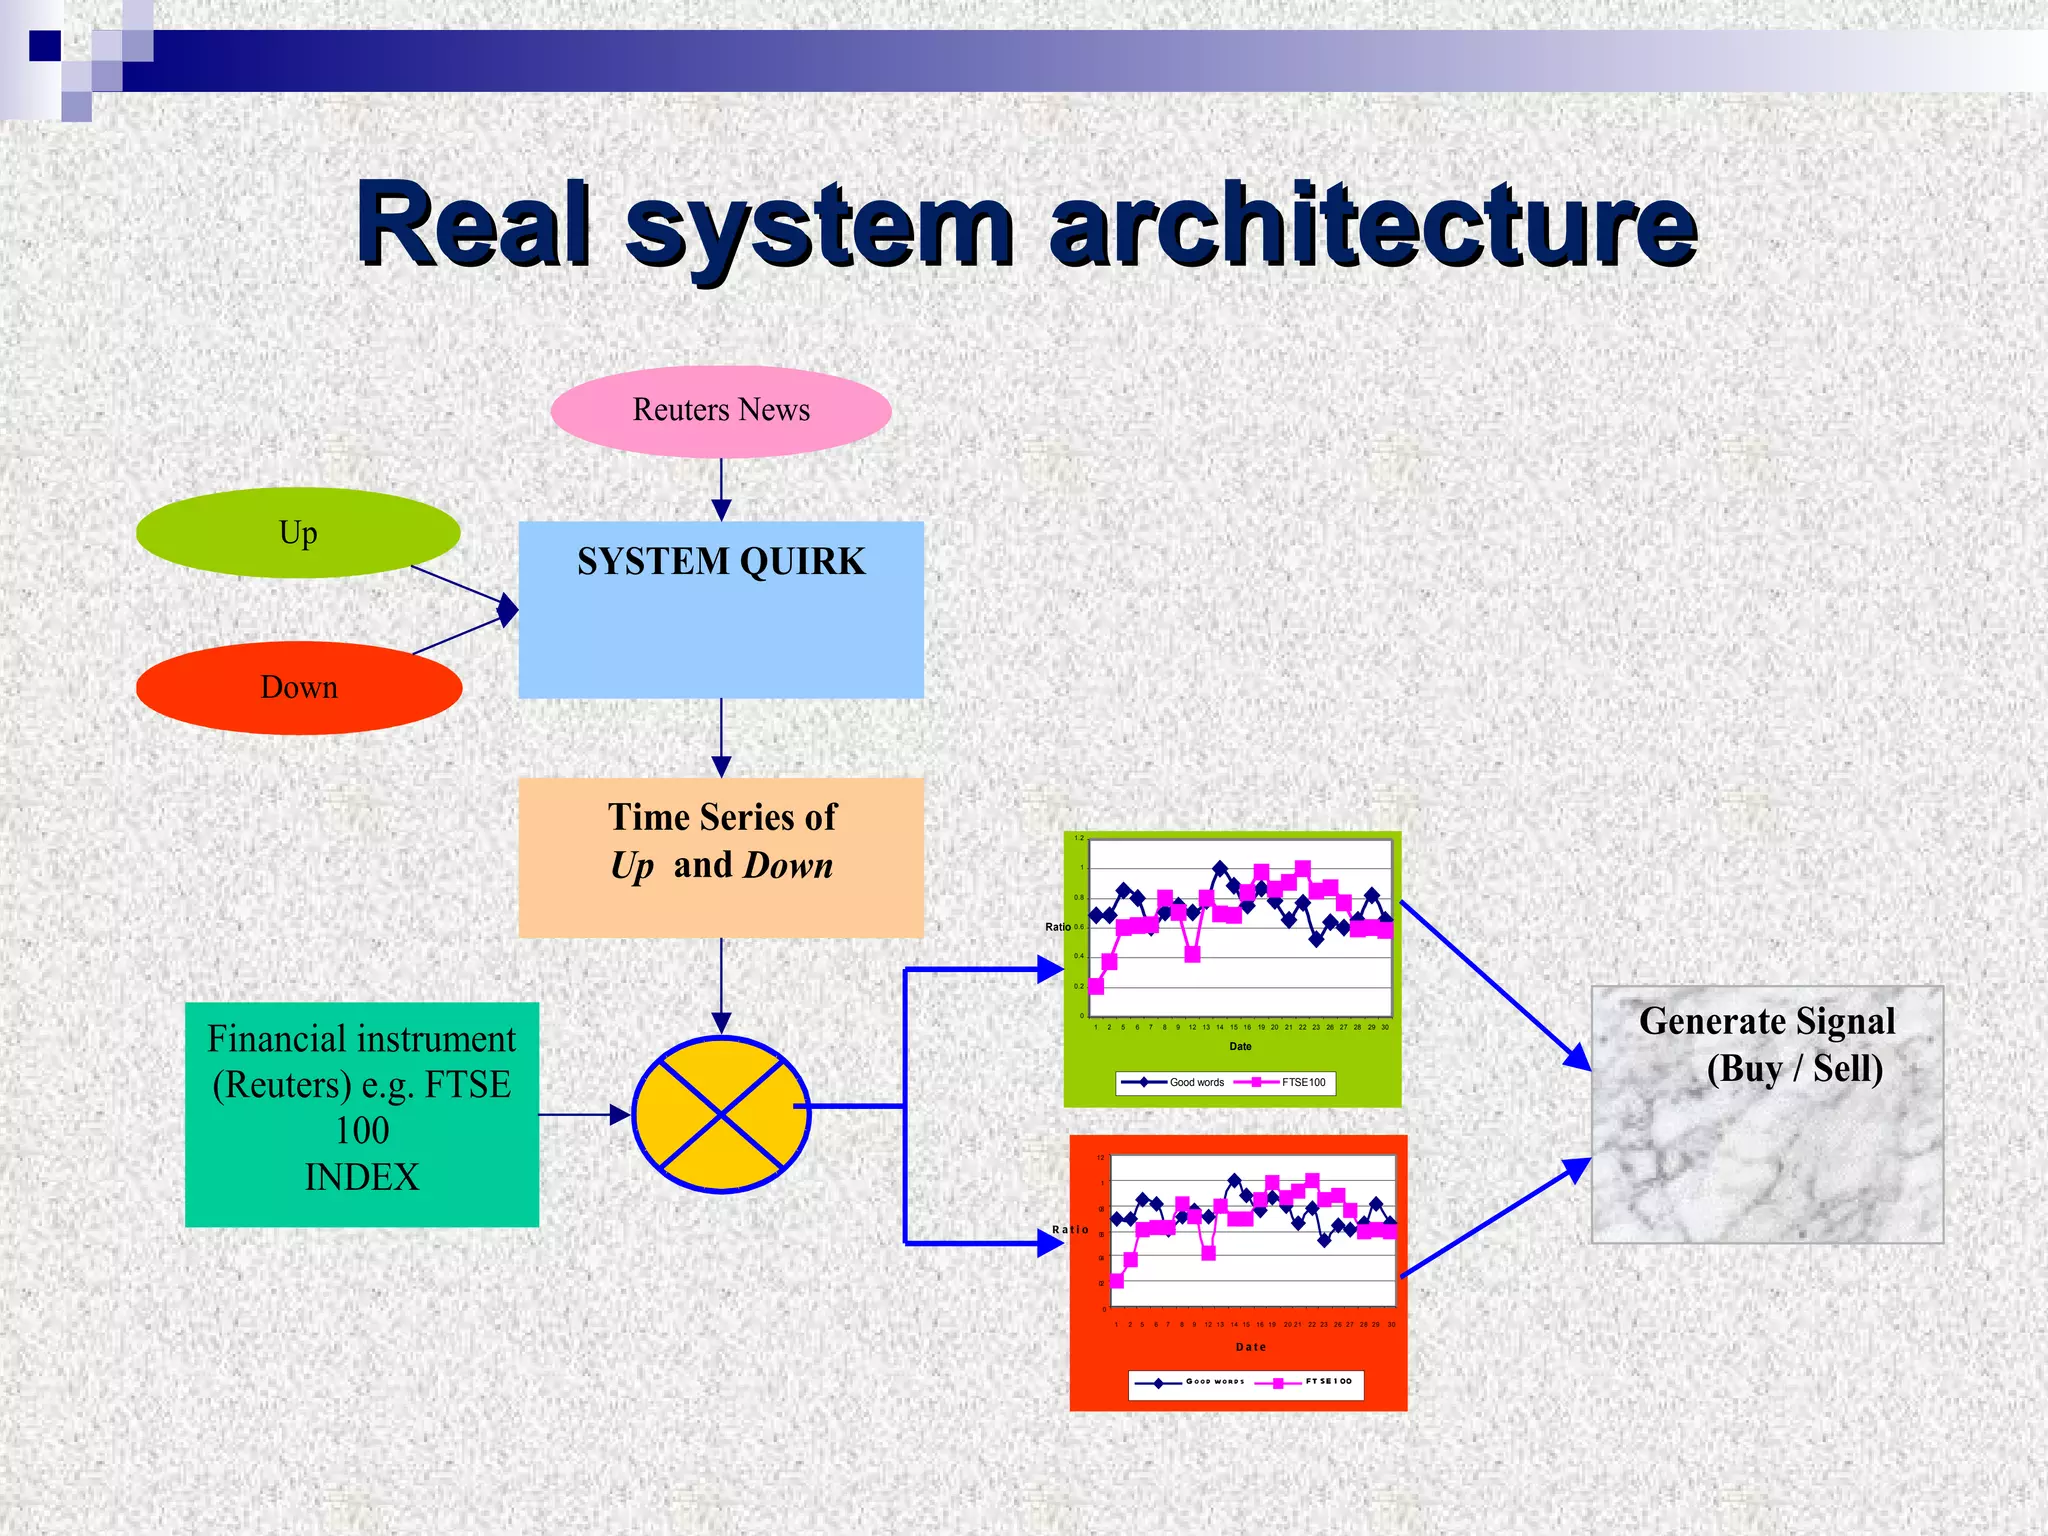
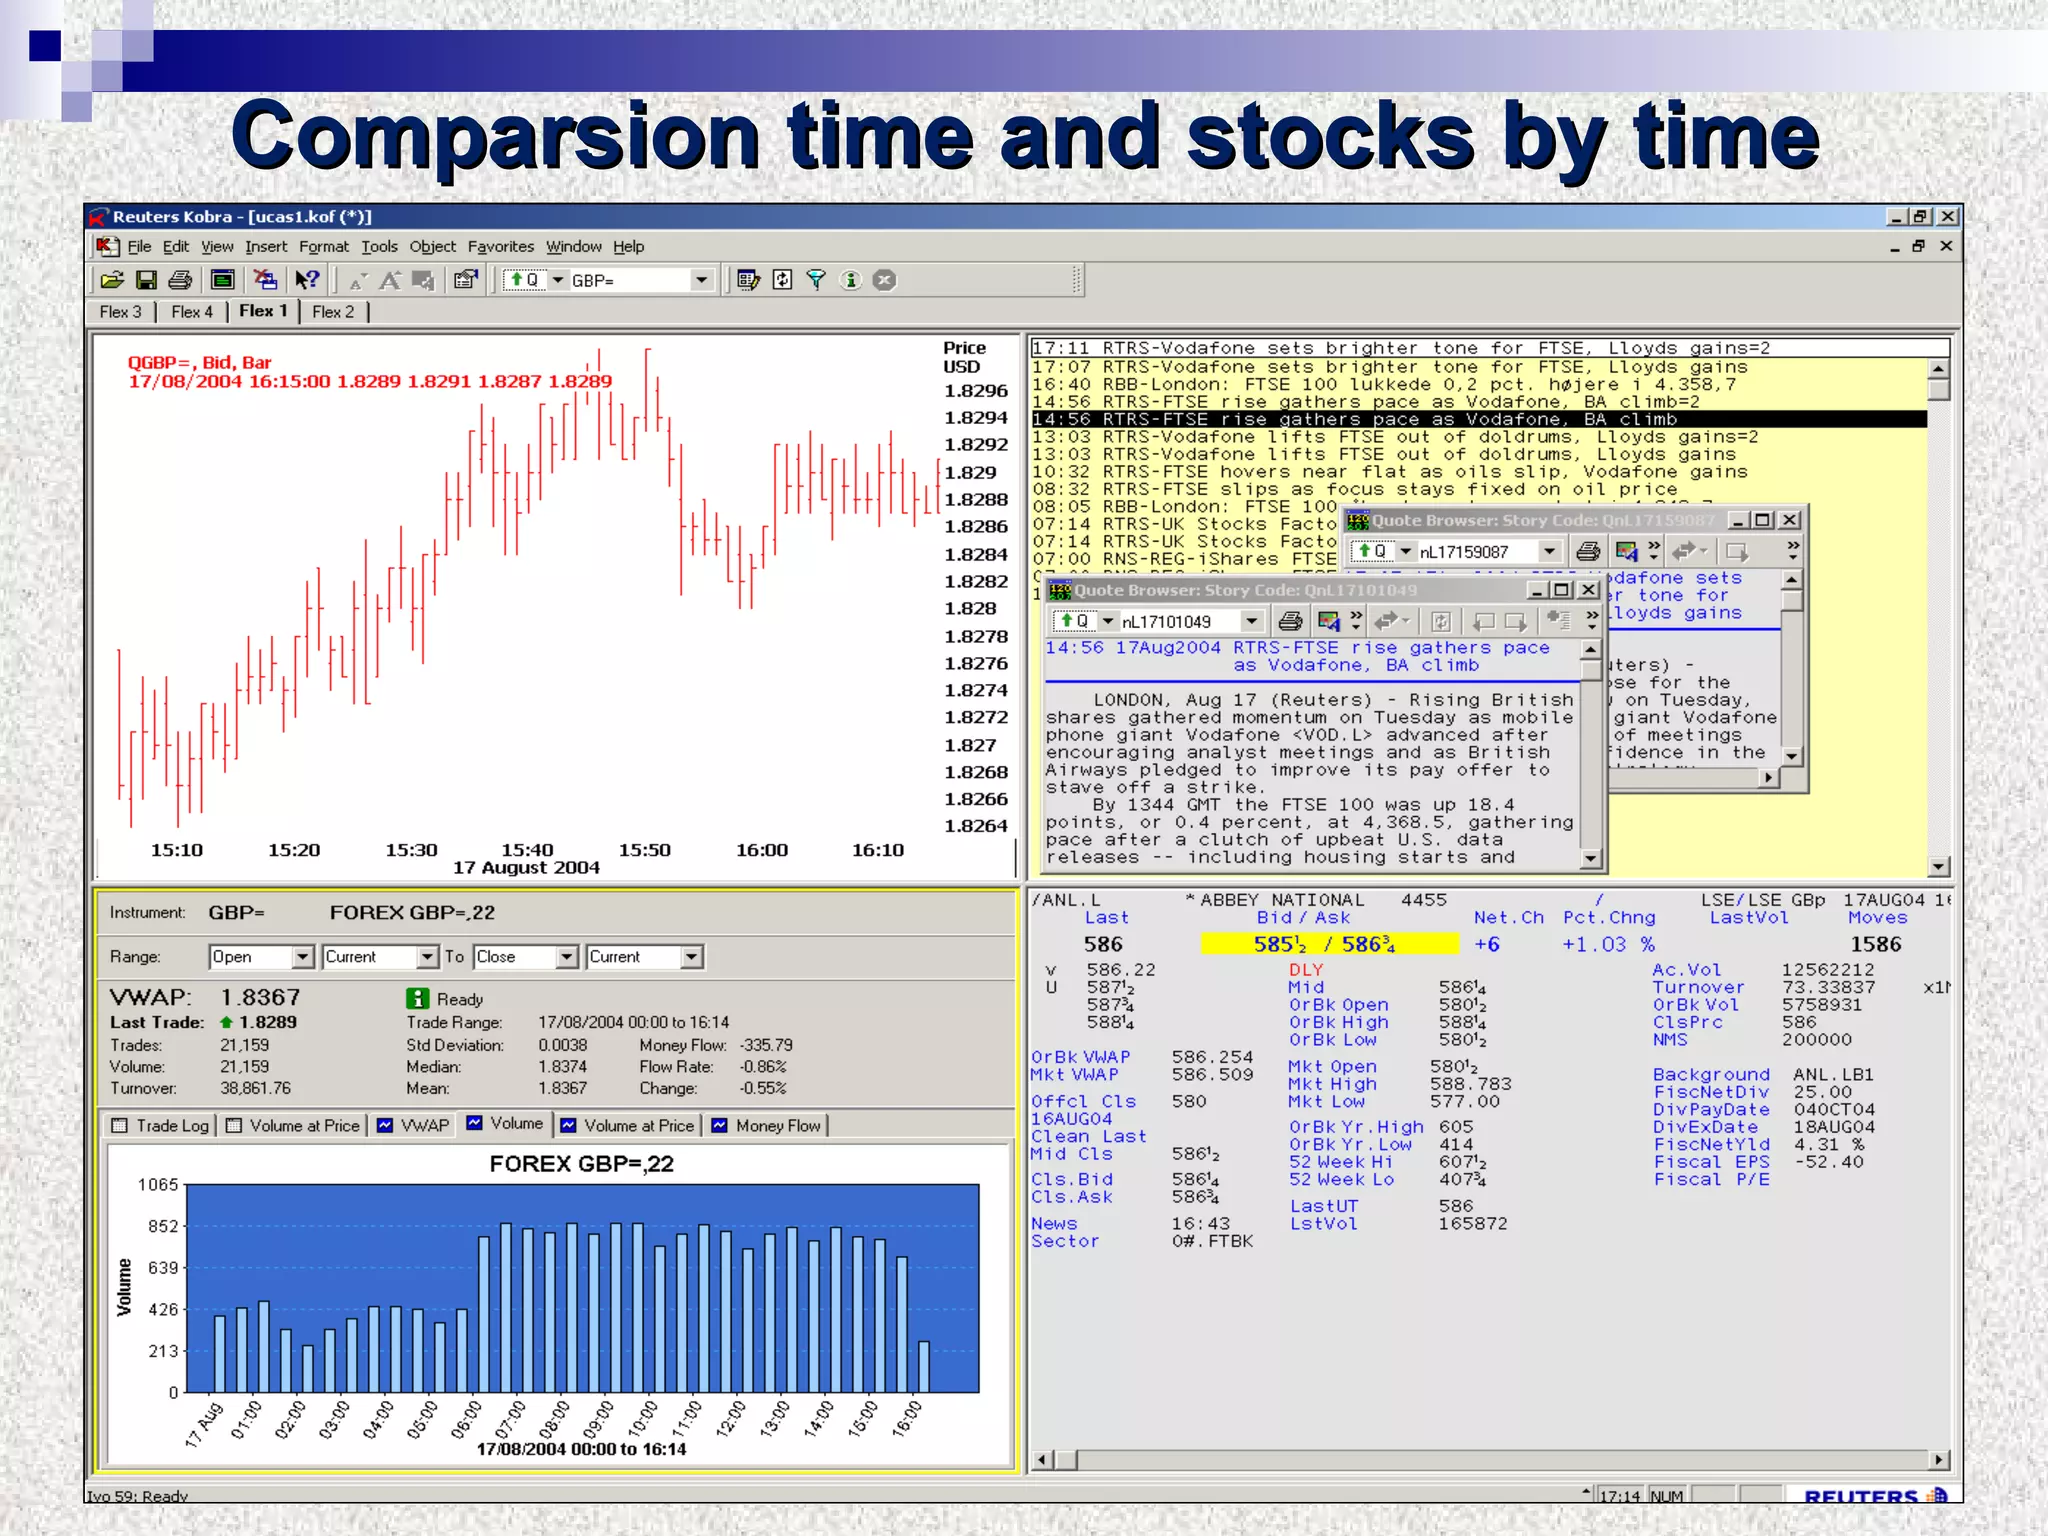
Download to read offline

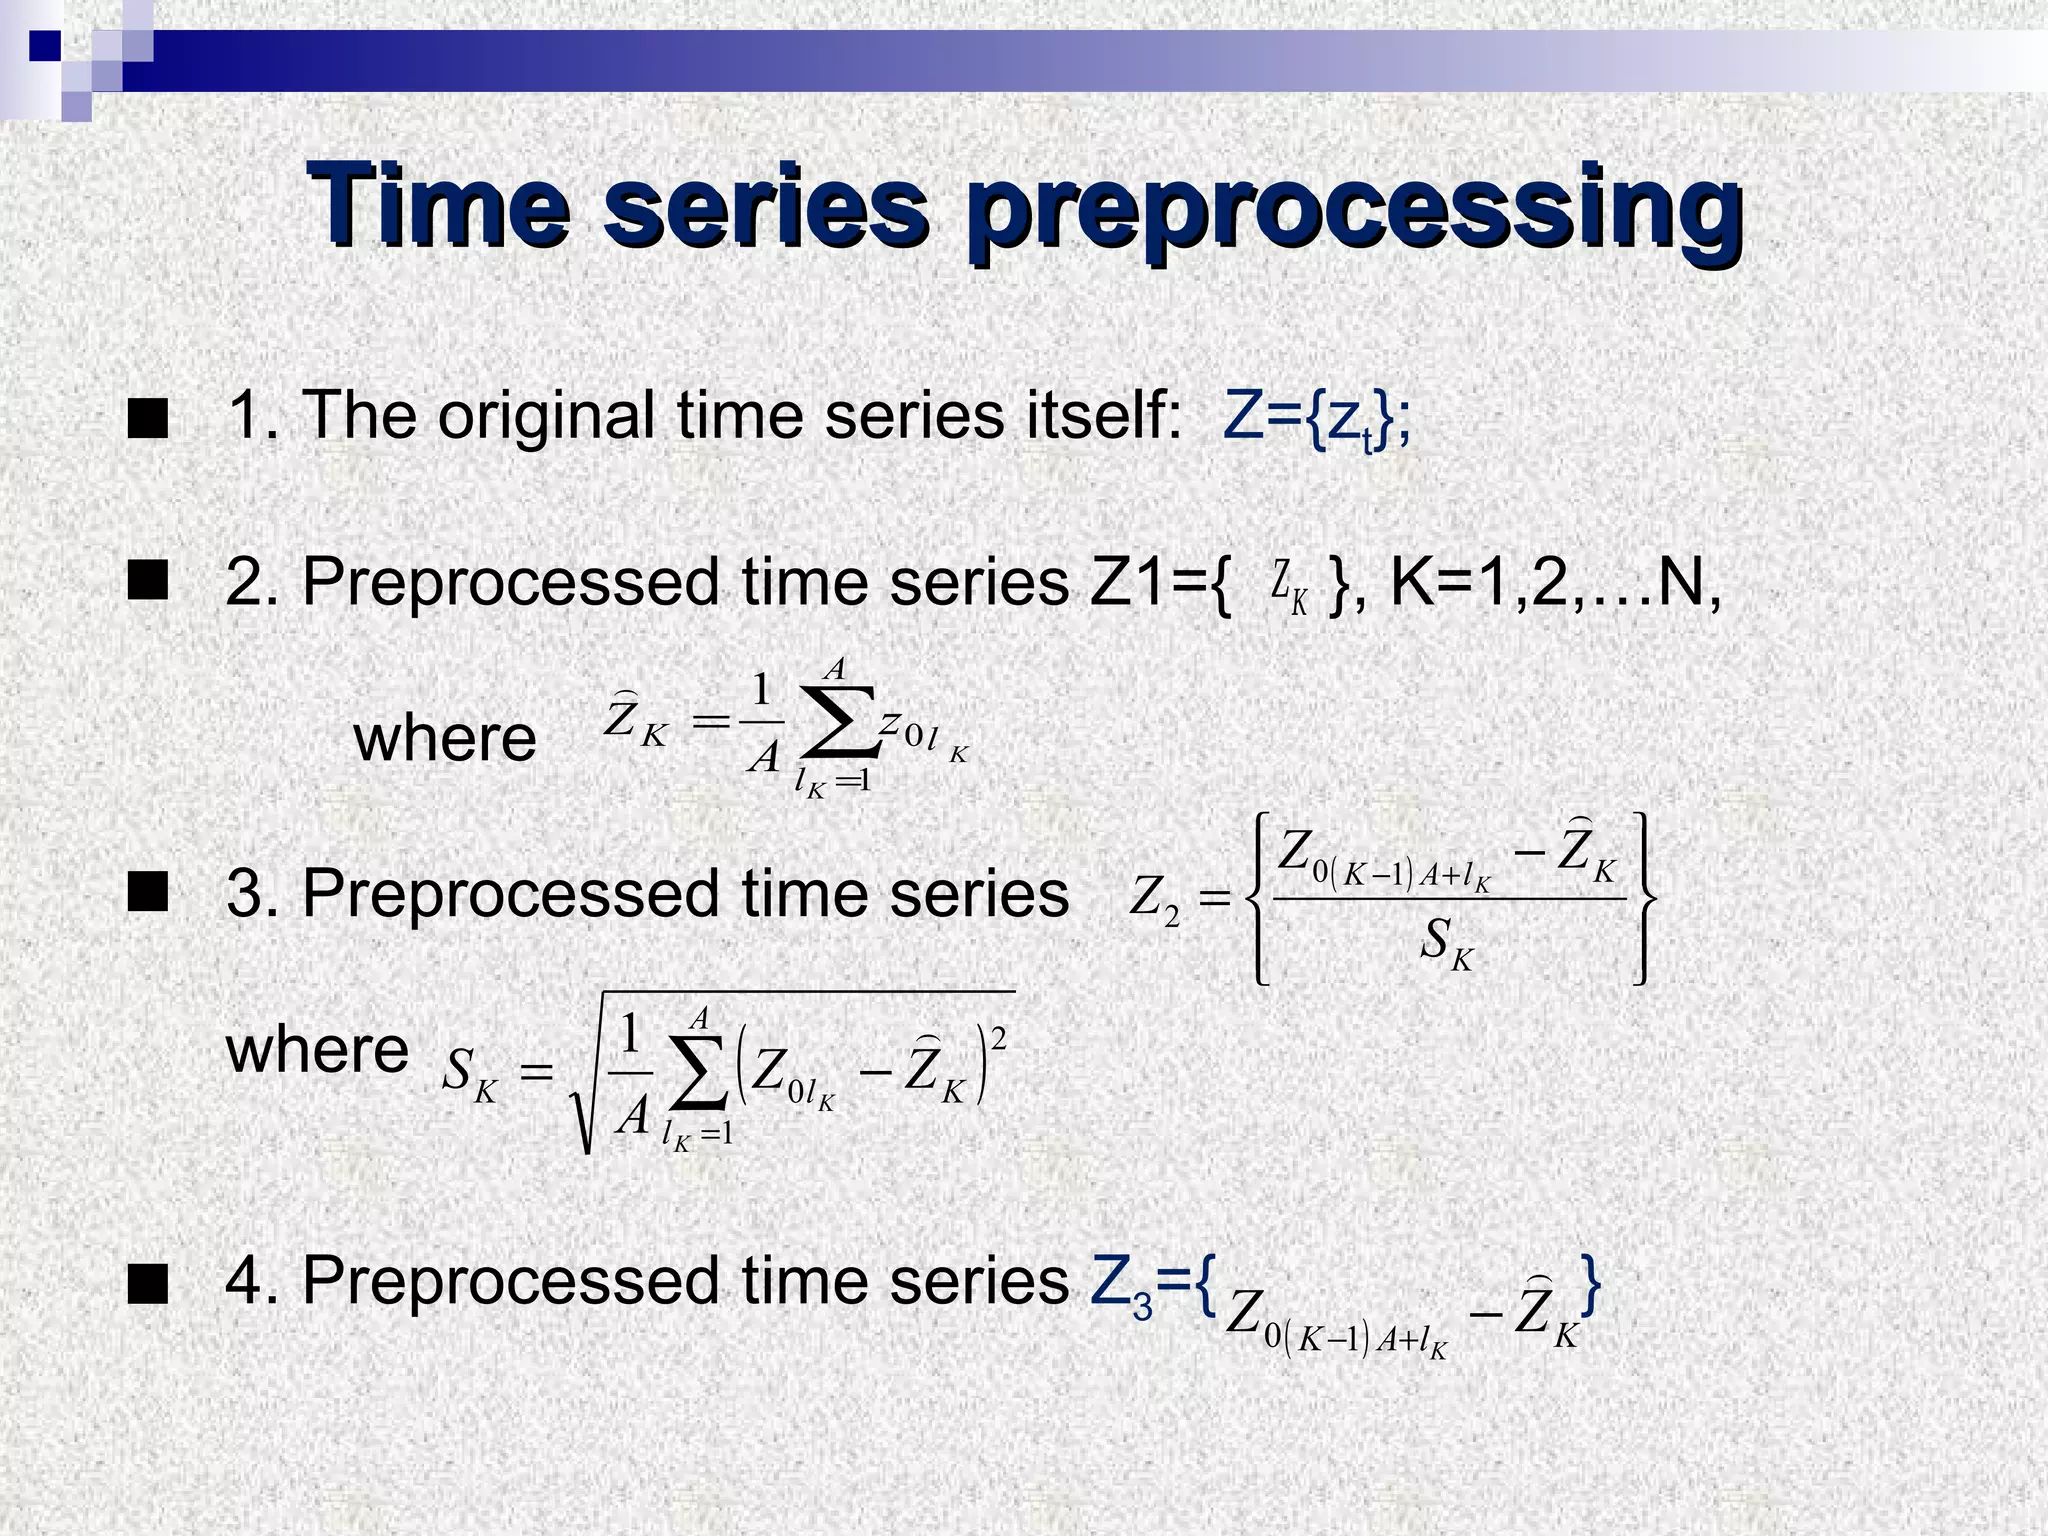
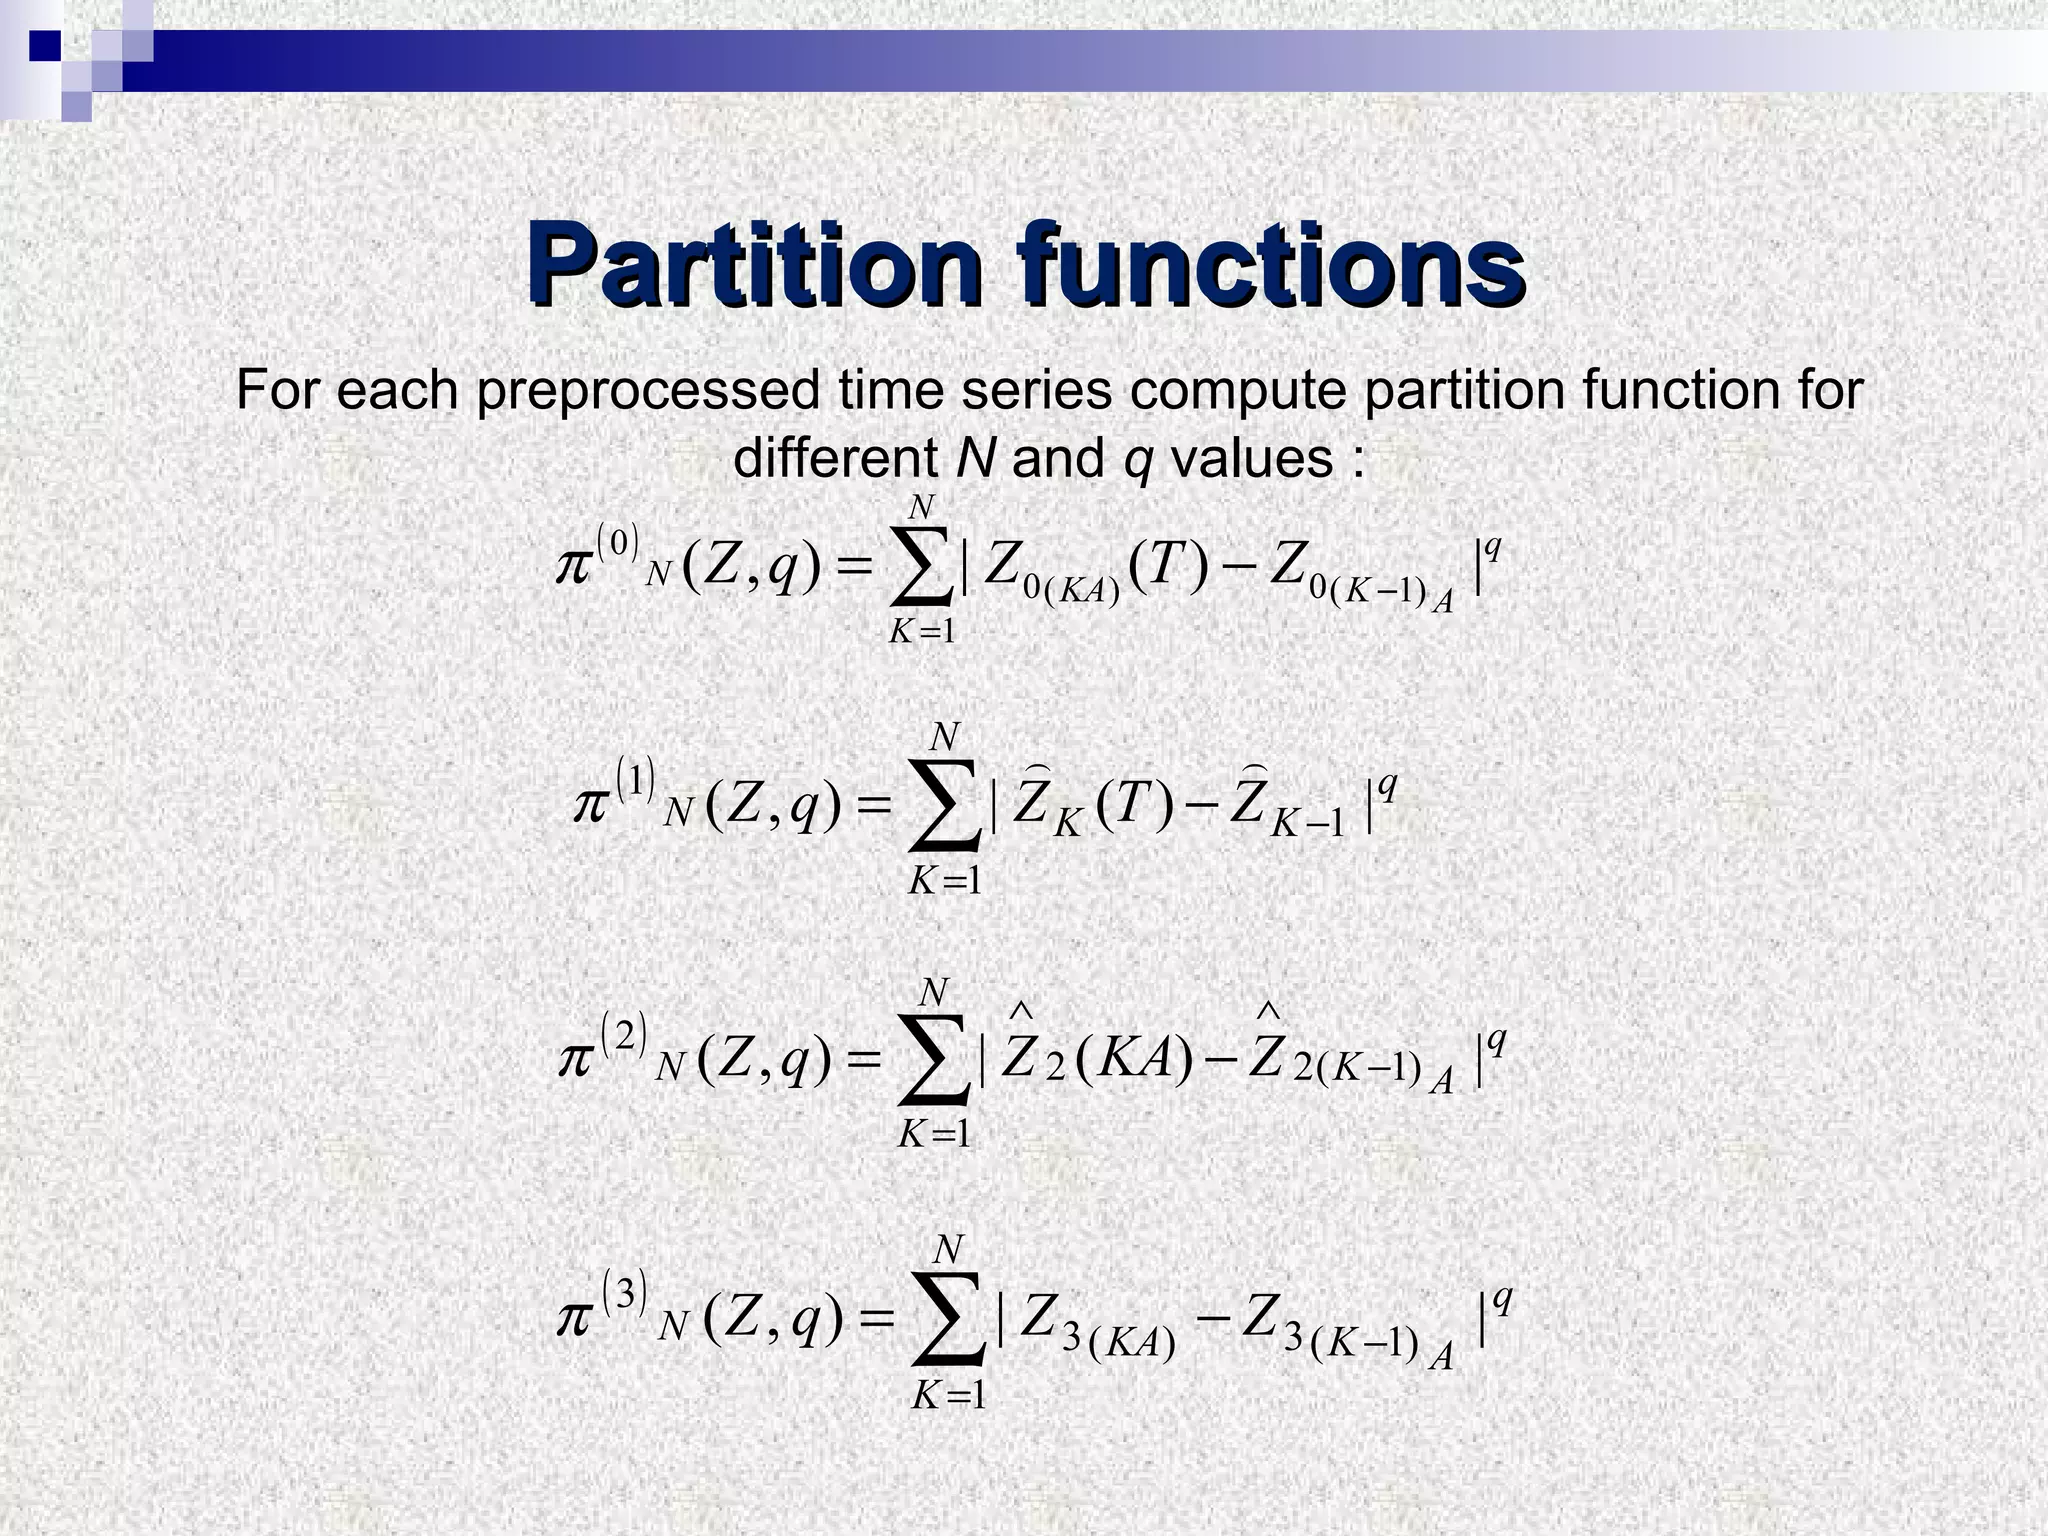
![Time series partitioning Time series: { x t } ; t [0, T ]. Compute : Z ={ z t }, z t = lnx t+1 -lnx t ; t [0, T ] ; Divide interval [0, T ] into N subintervals , 1 ≤ N ≤ Nmax . Each subinterval contains int ( T/N )= A values Z; For each subinterval K; 1 ≤ K ≤ N current reading number lK; 1 ≤ lK ≤ A; t = ( K -1) А+ lK As soon as we are looking for the best indicator of a coming default, we will use several variants of a preliminary processing.](https://image.slidesharecdn.com/presentationfinal-110413112052-phpapp02/75/Presentation-final-21-2048.jpg)
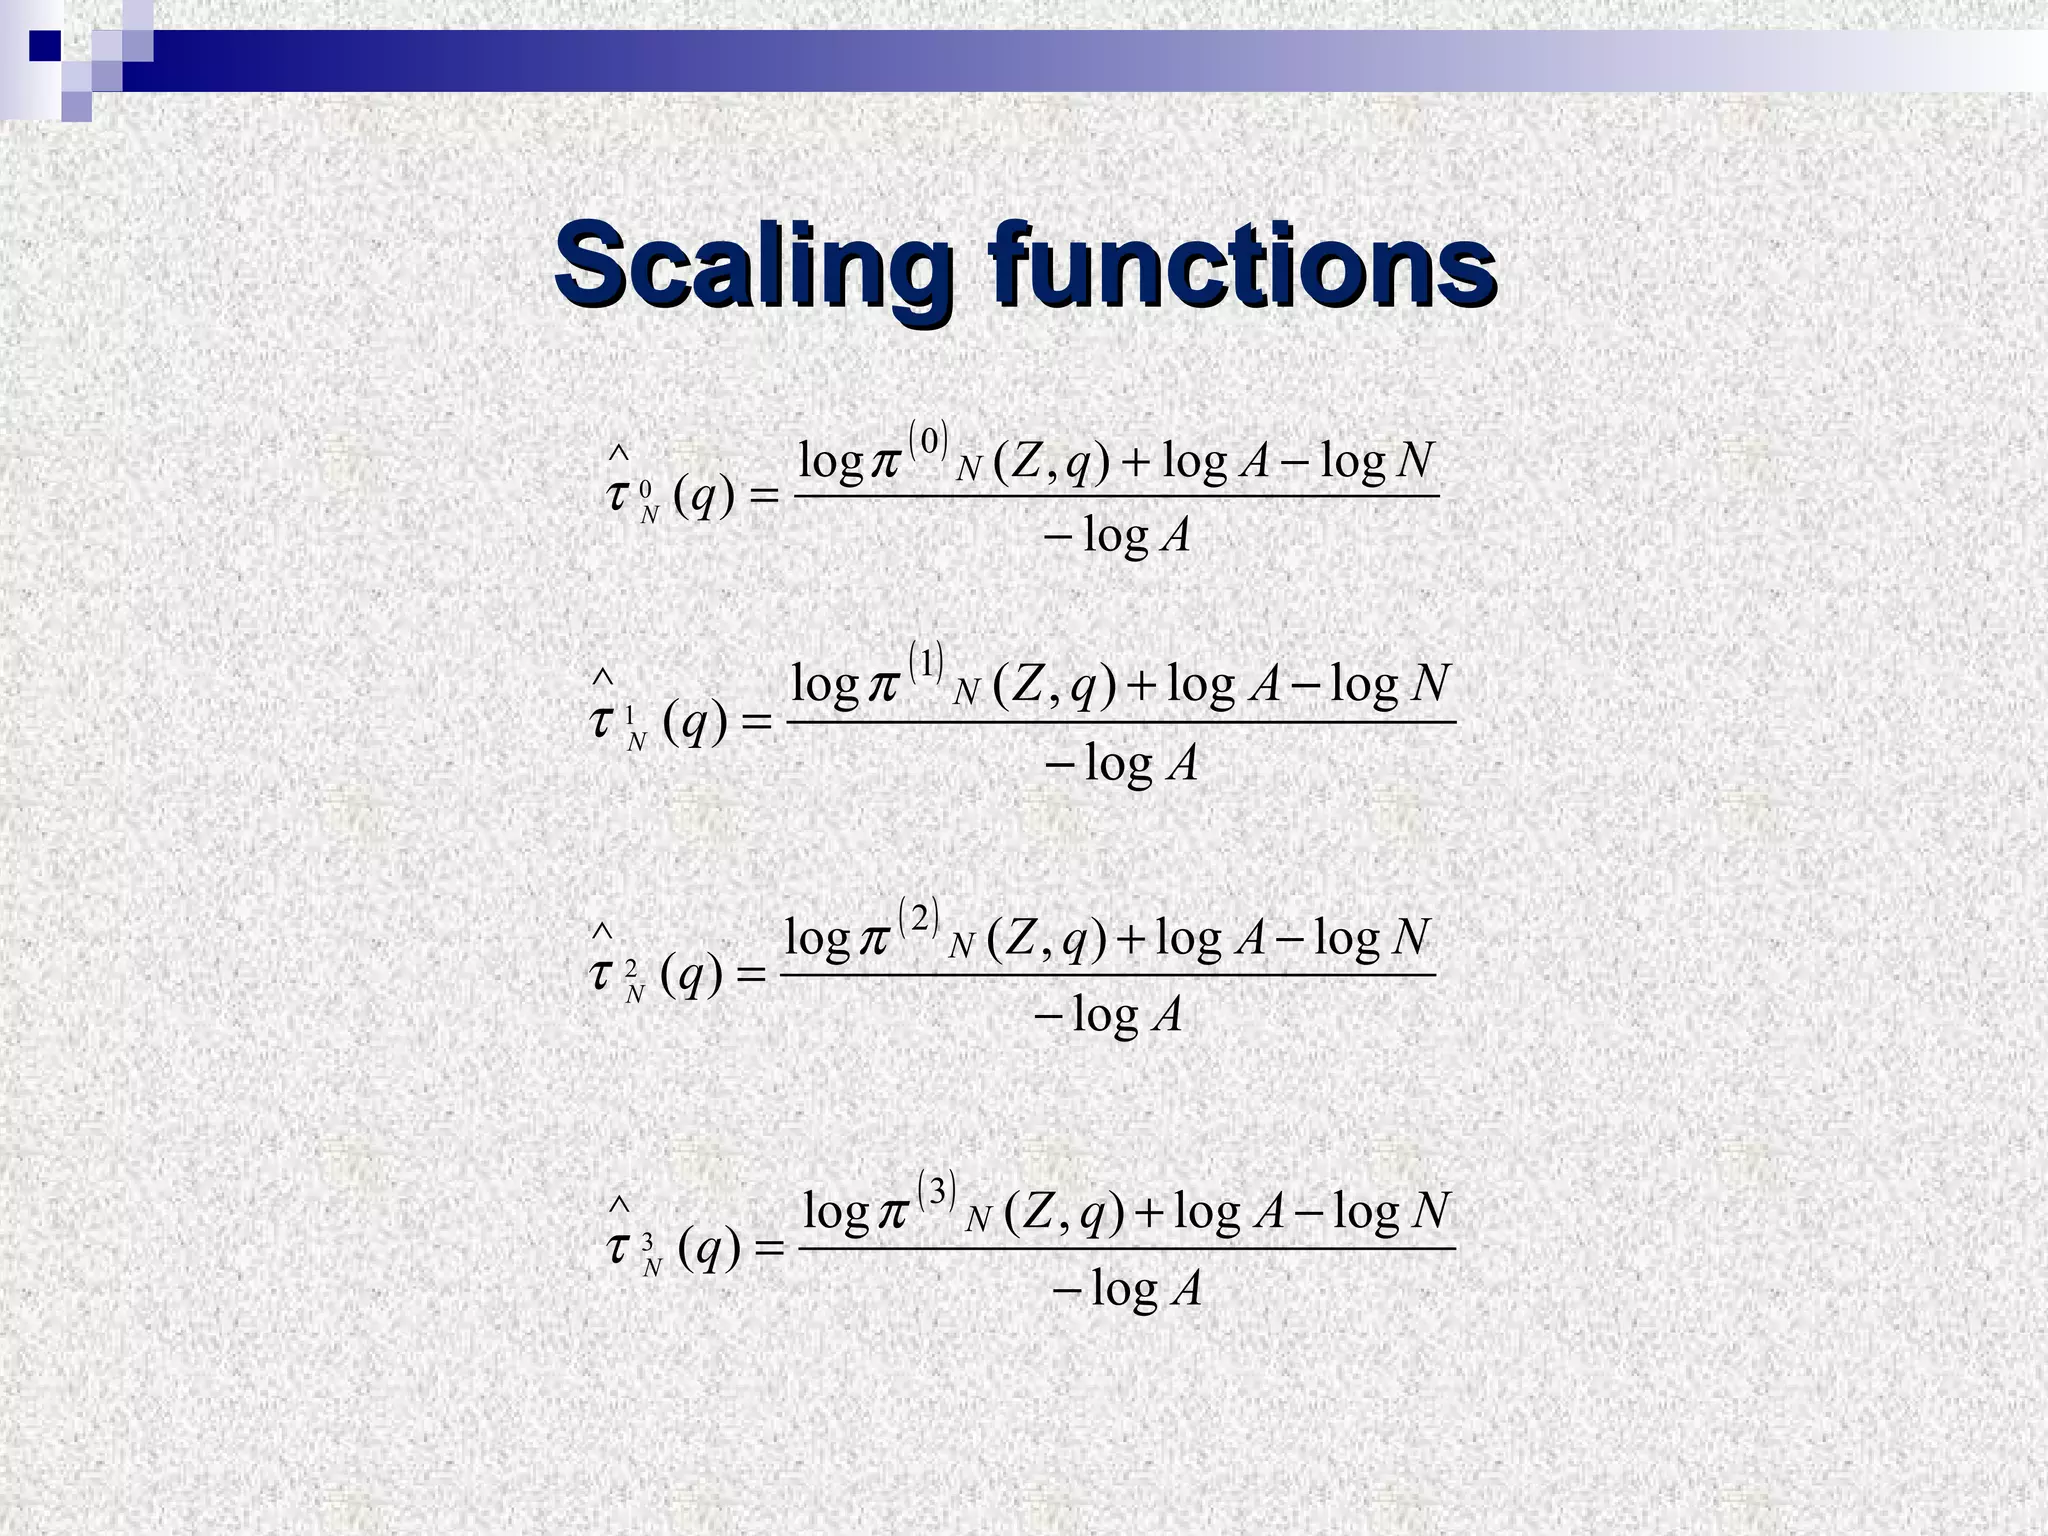
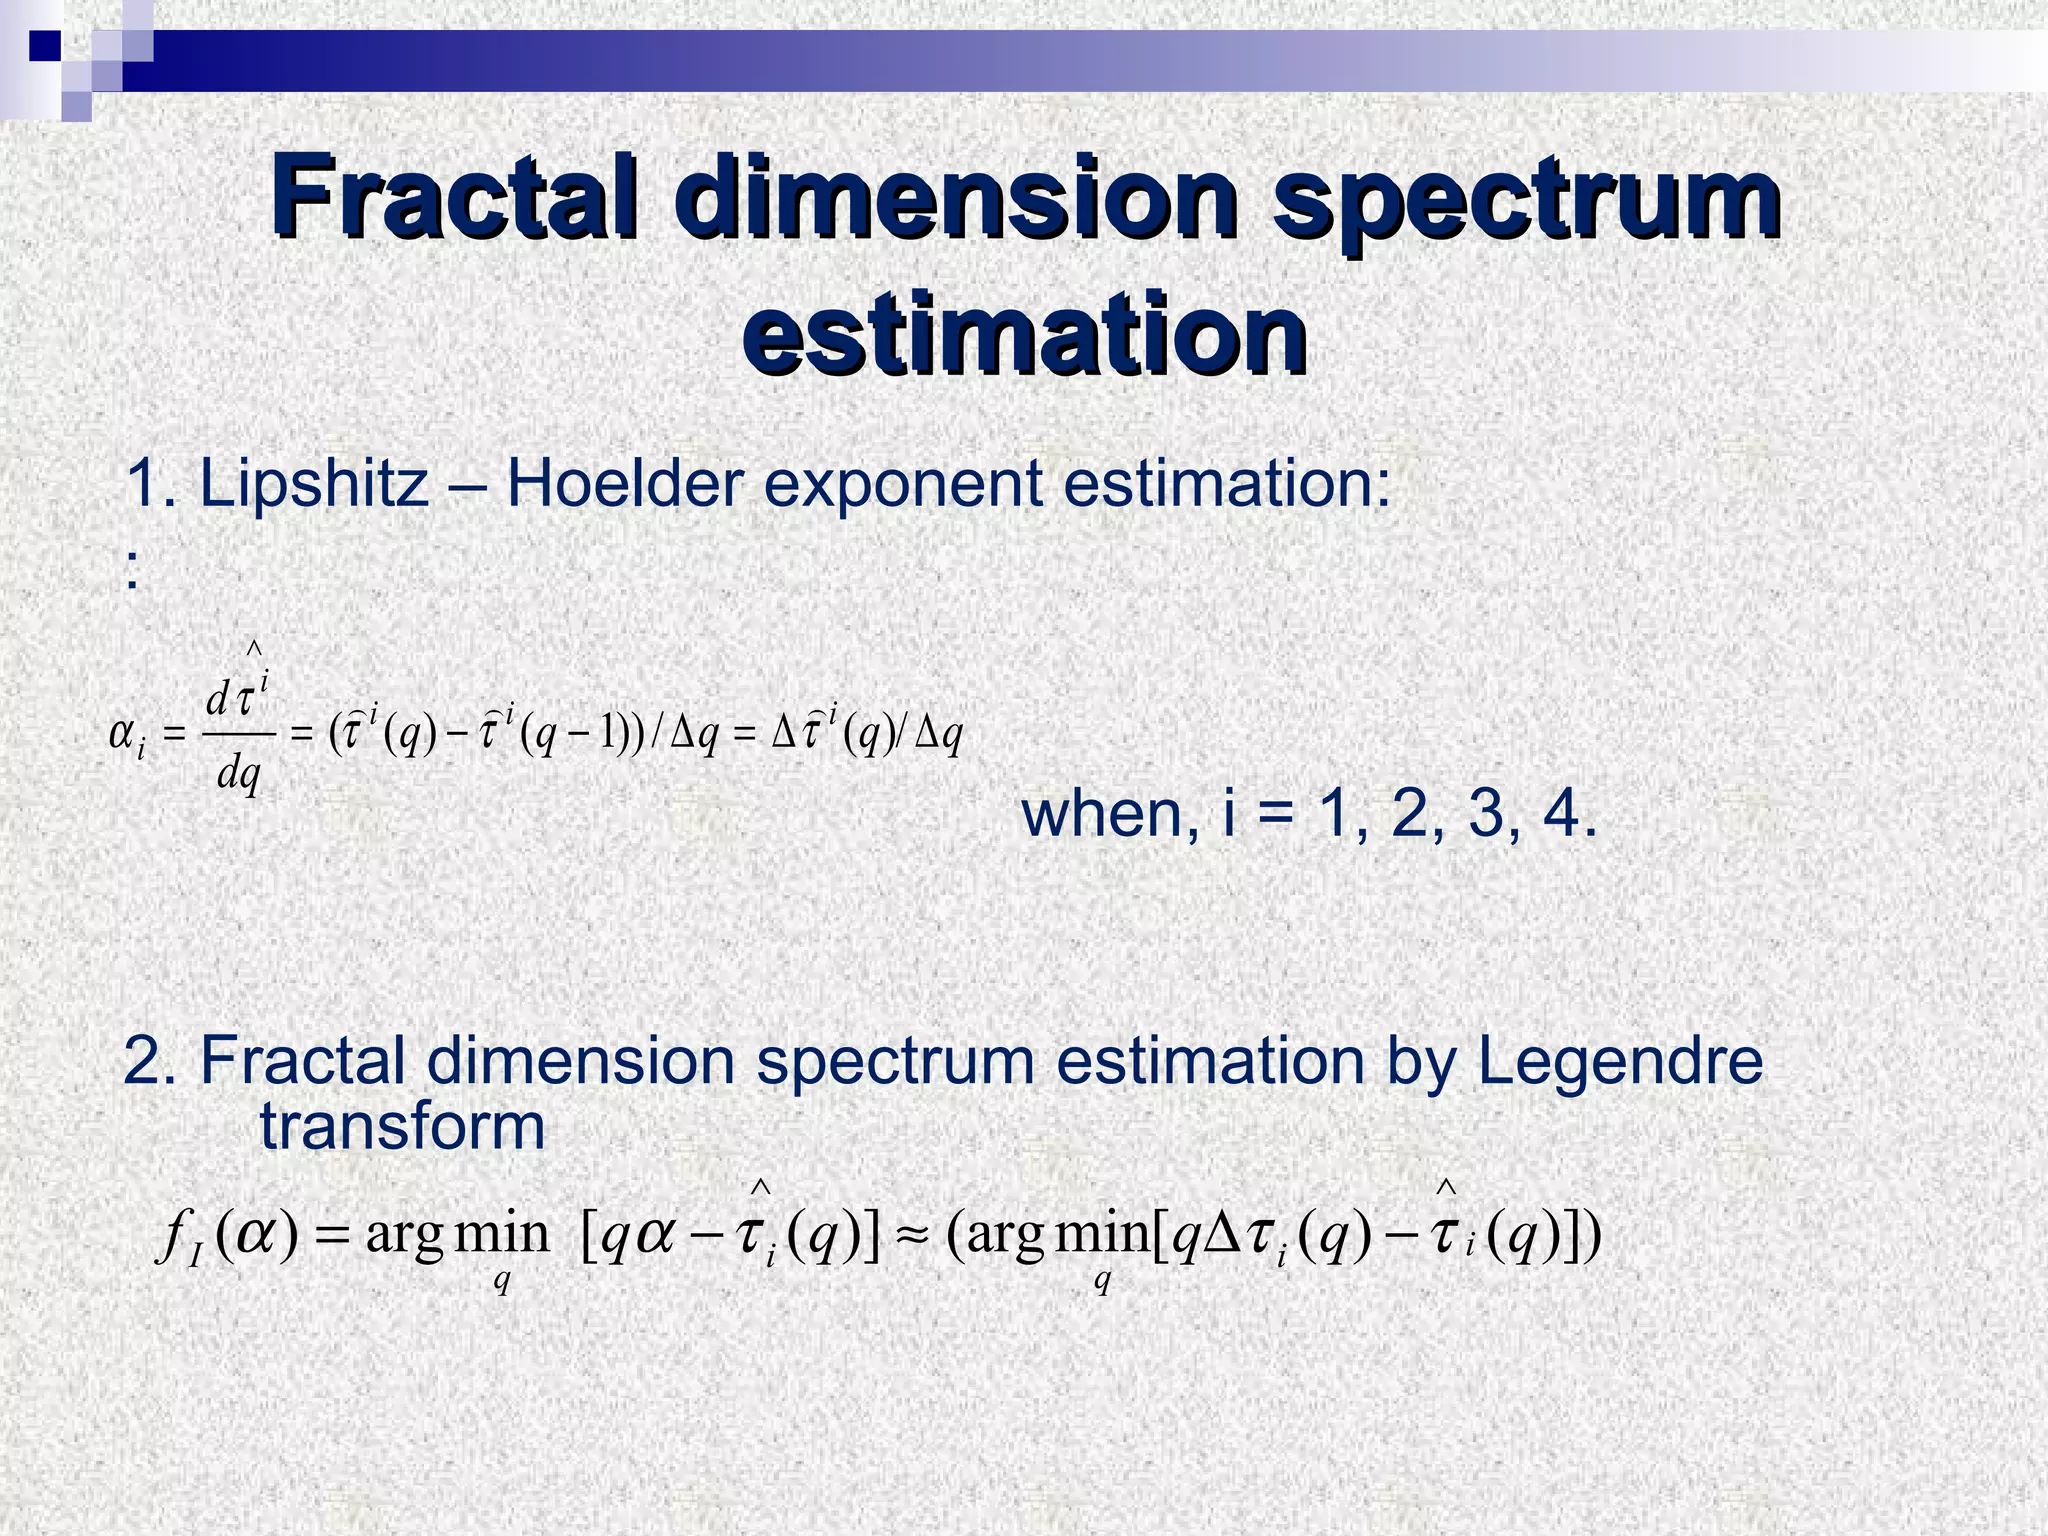
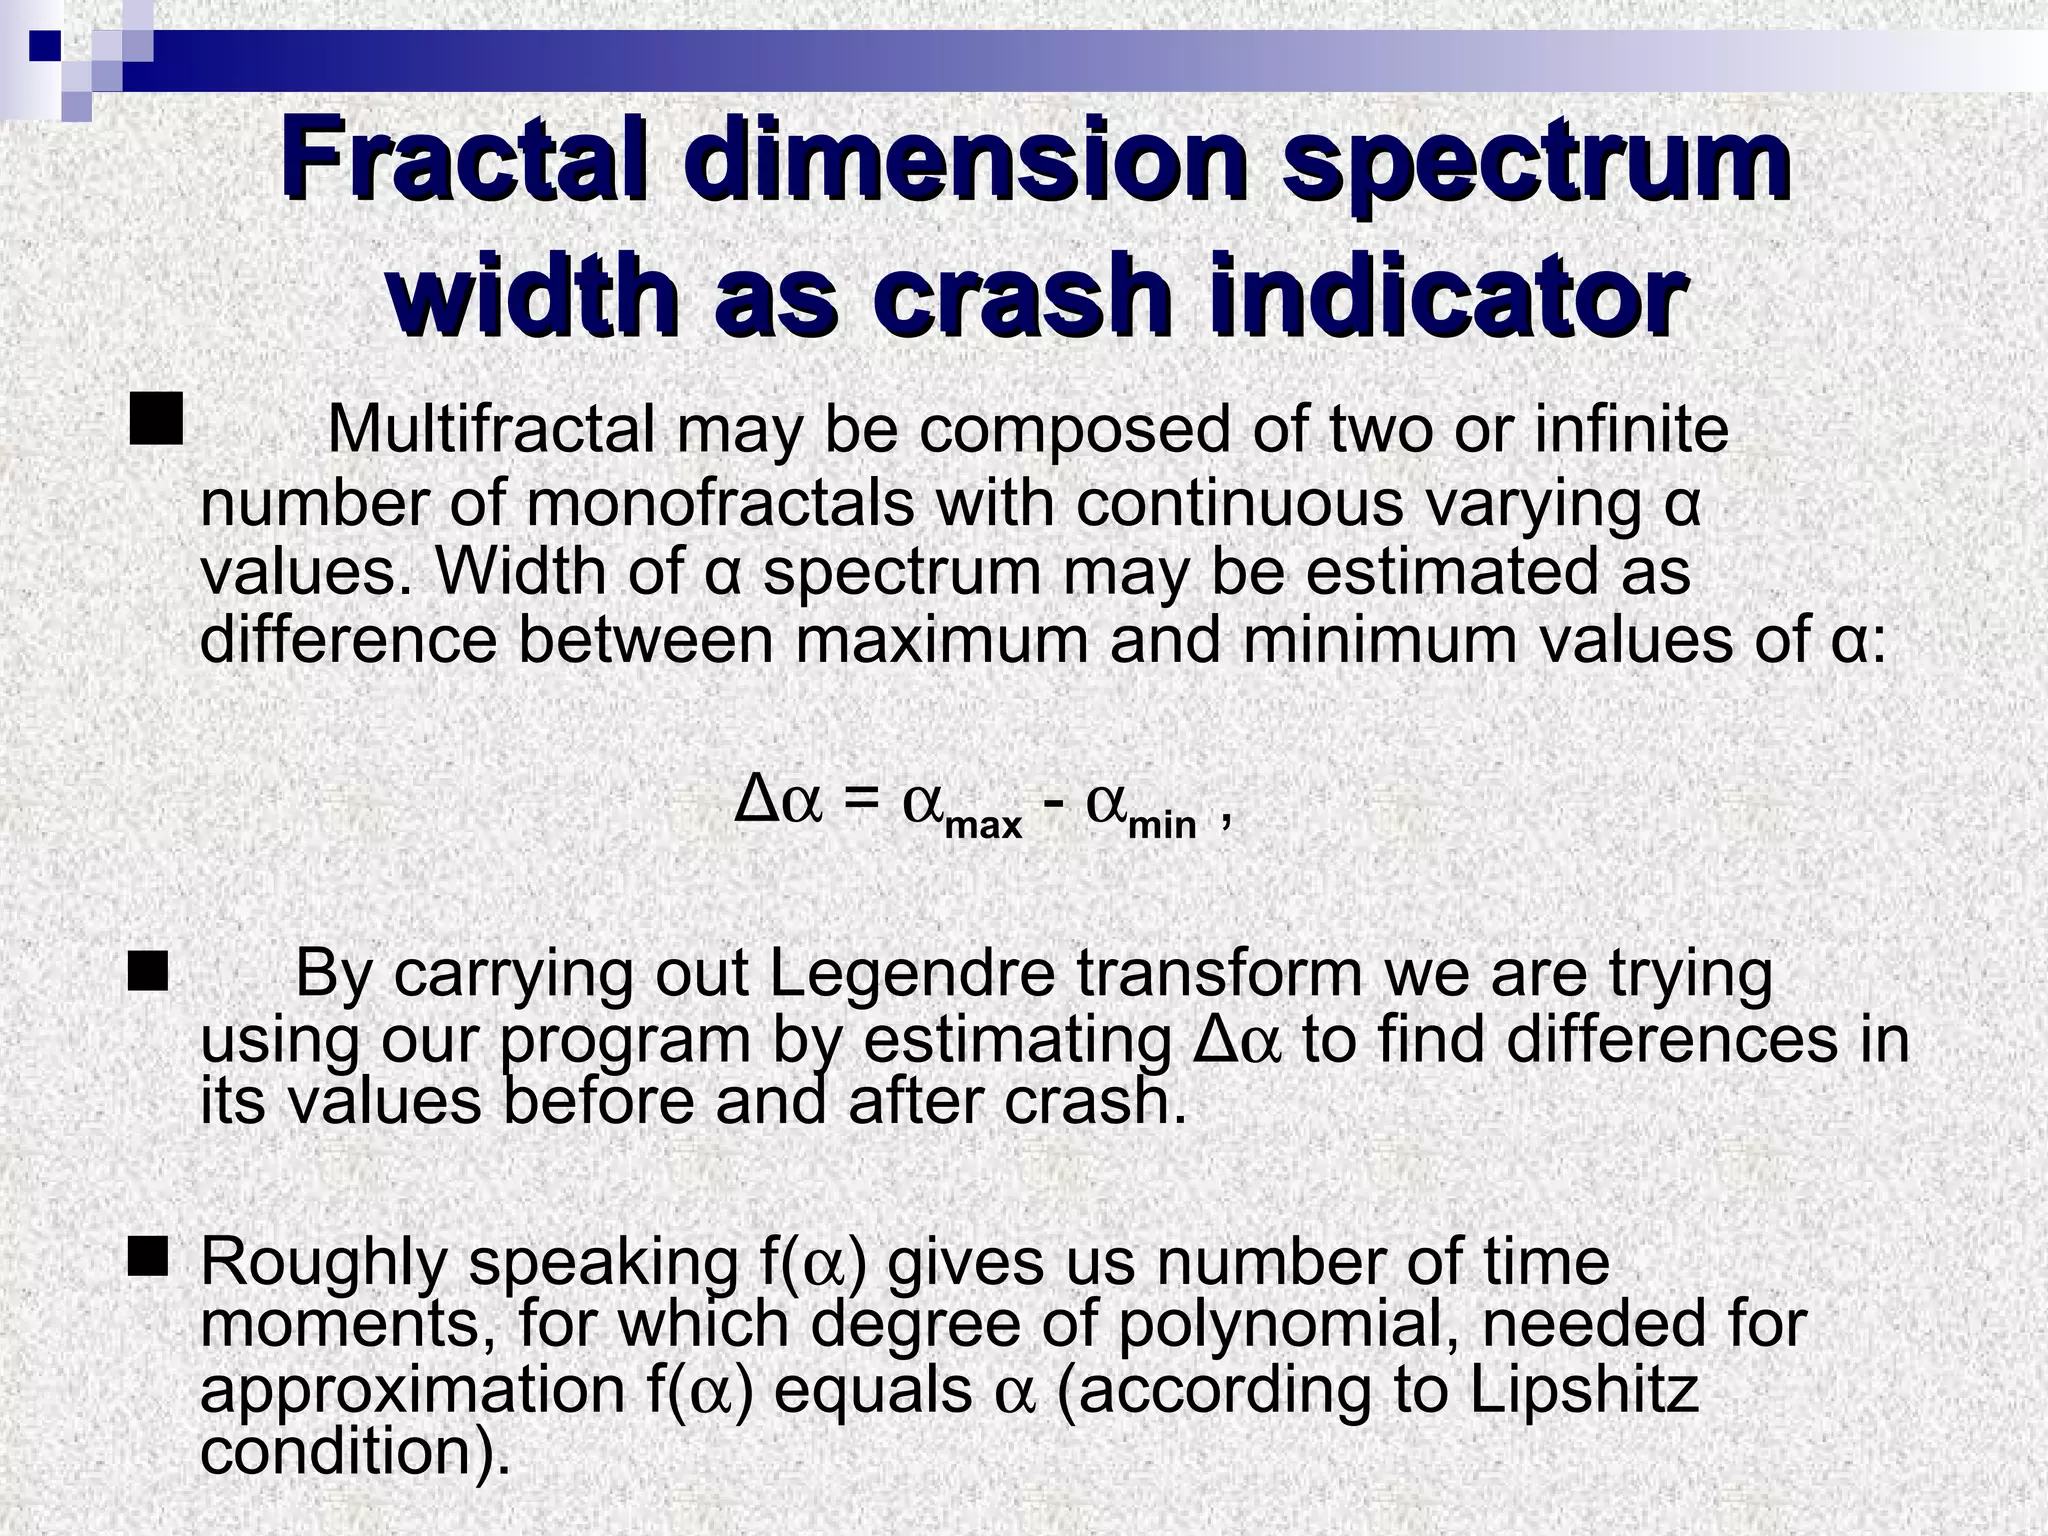
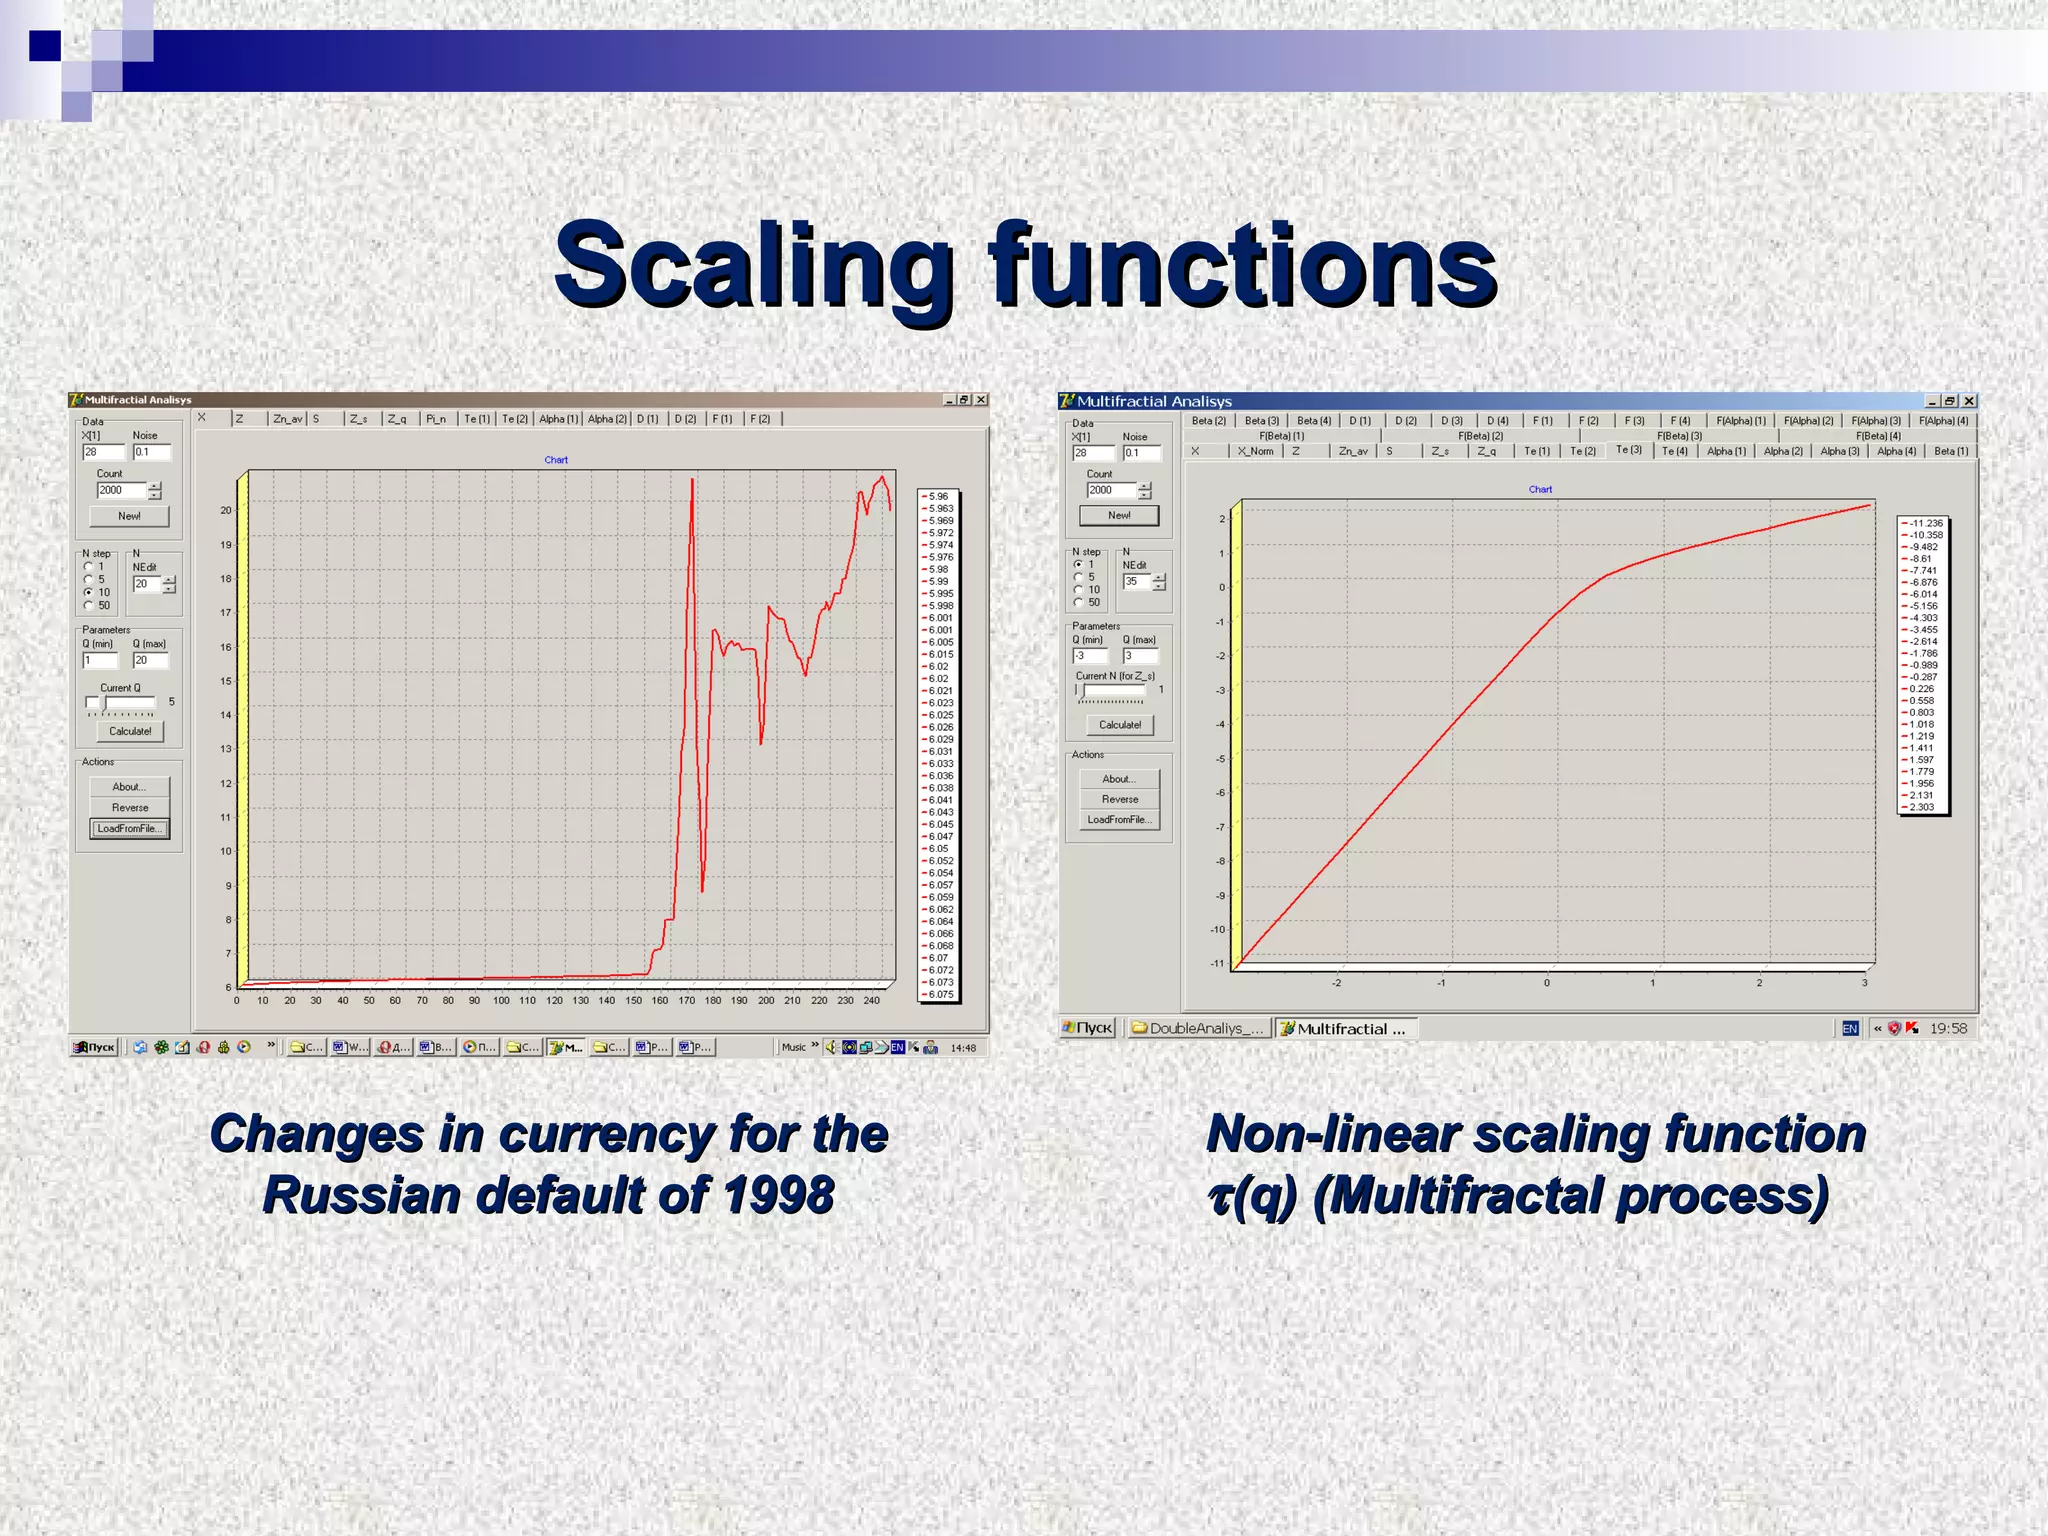
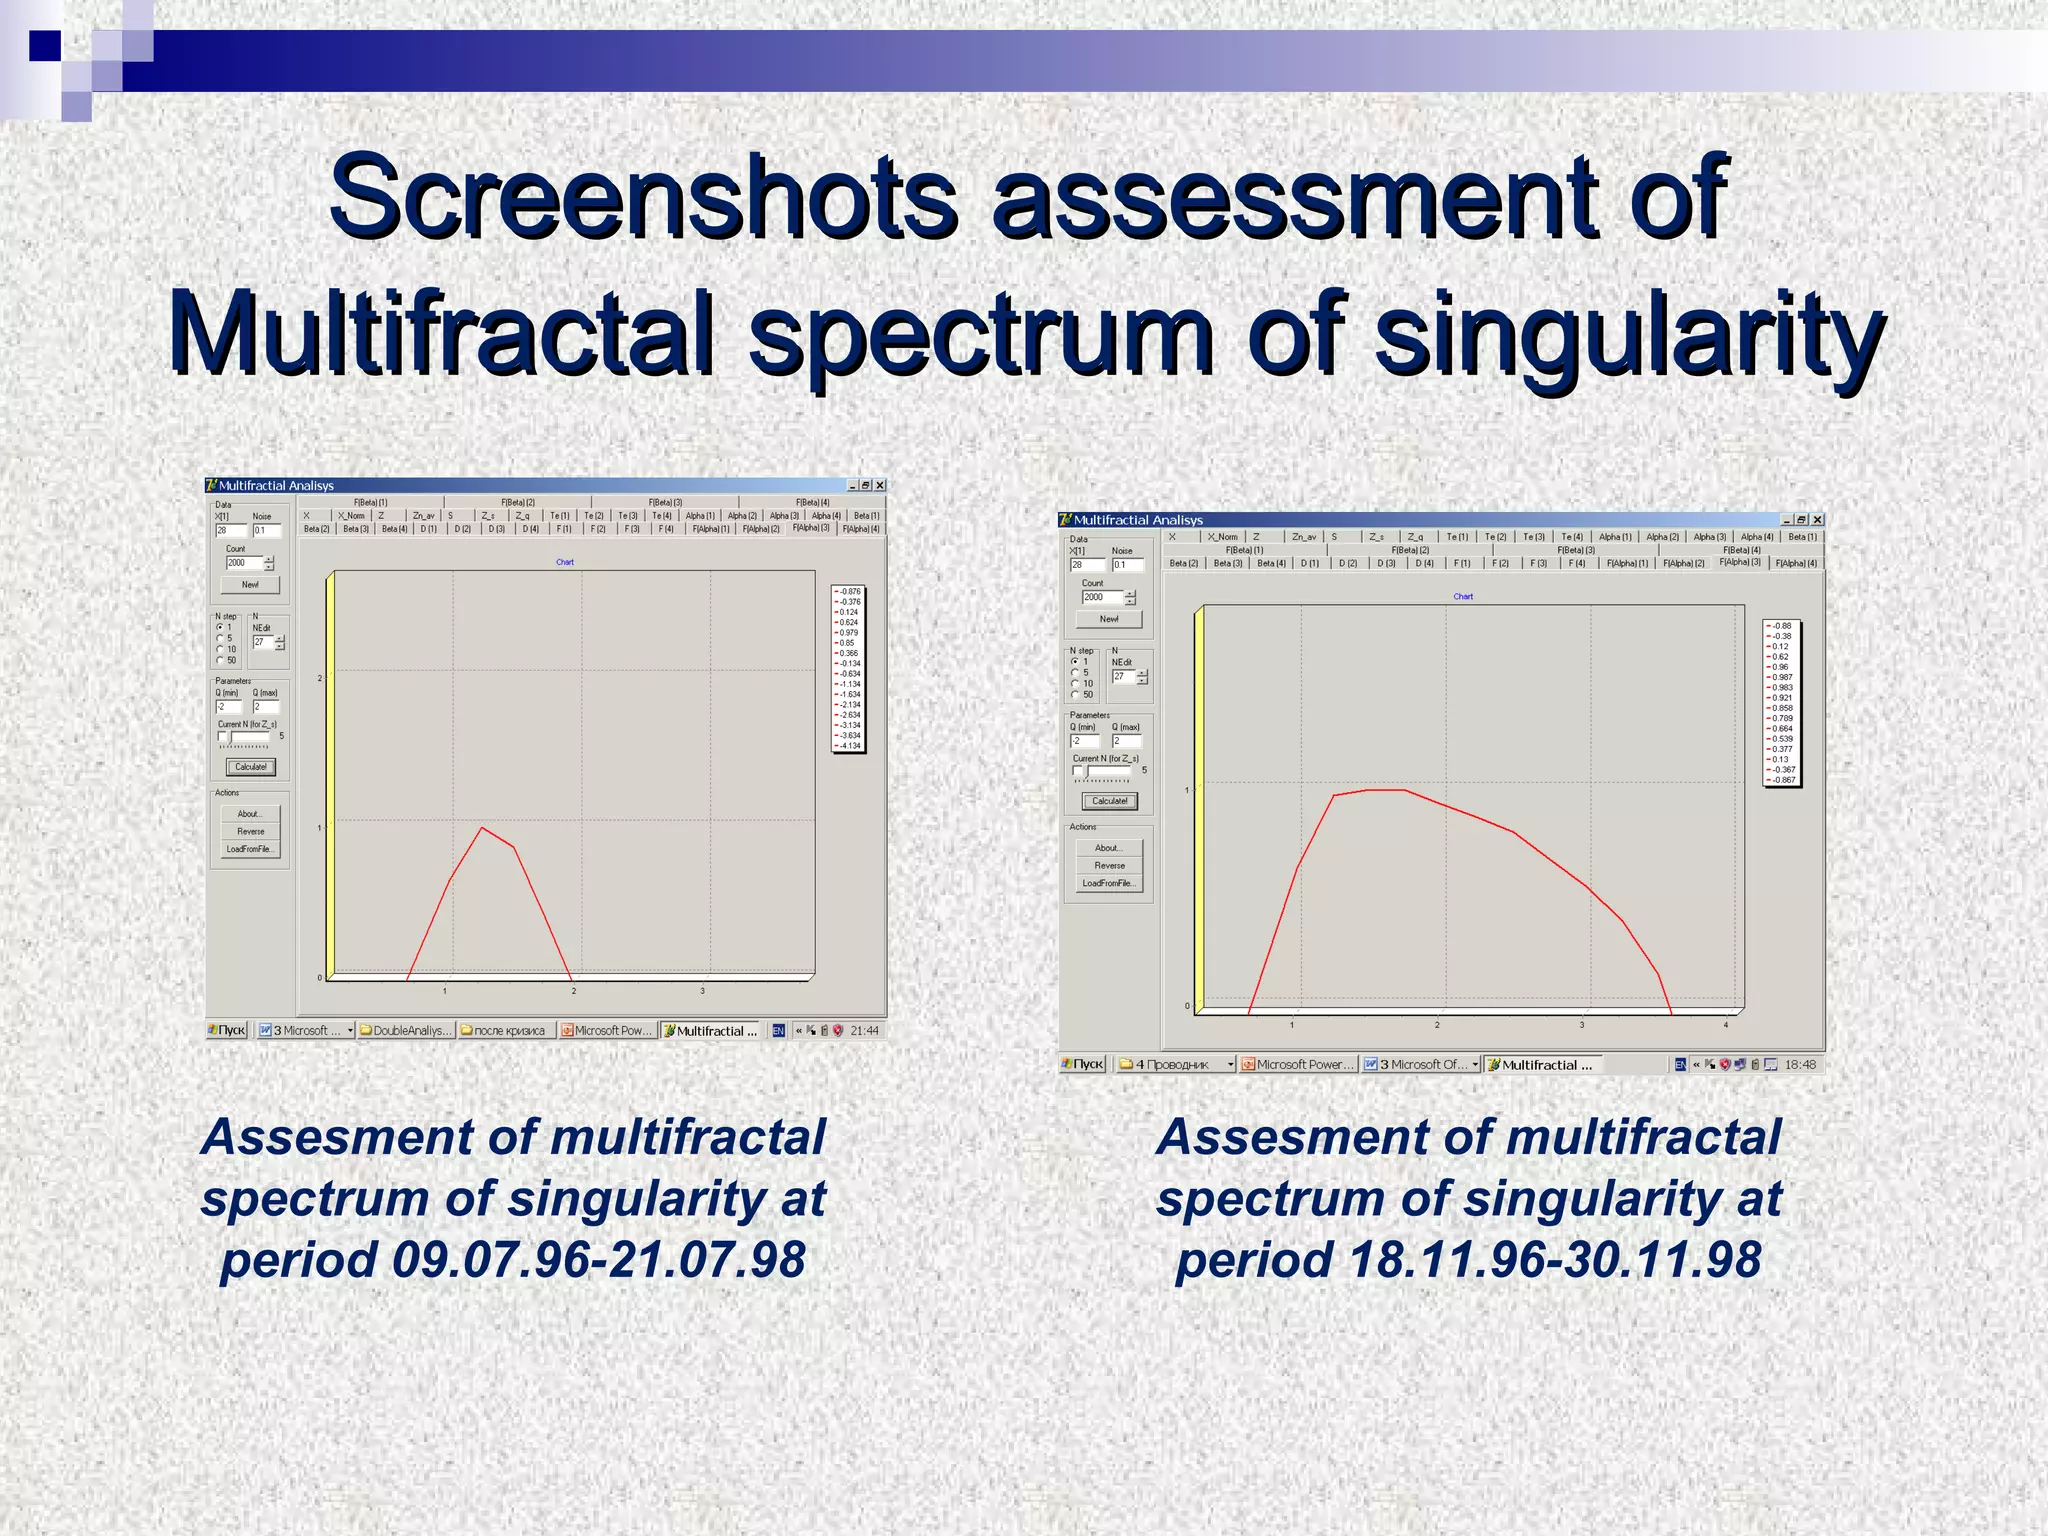
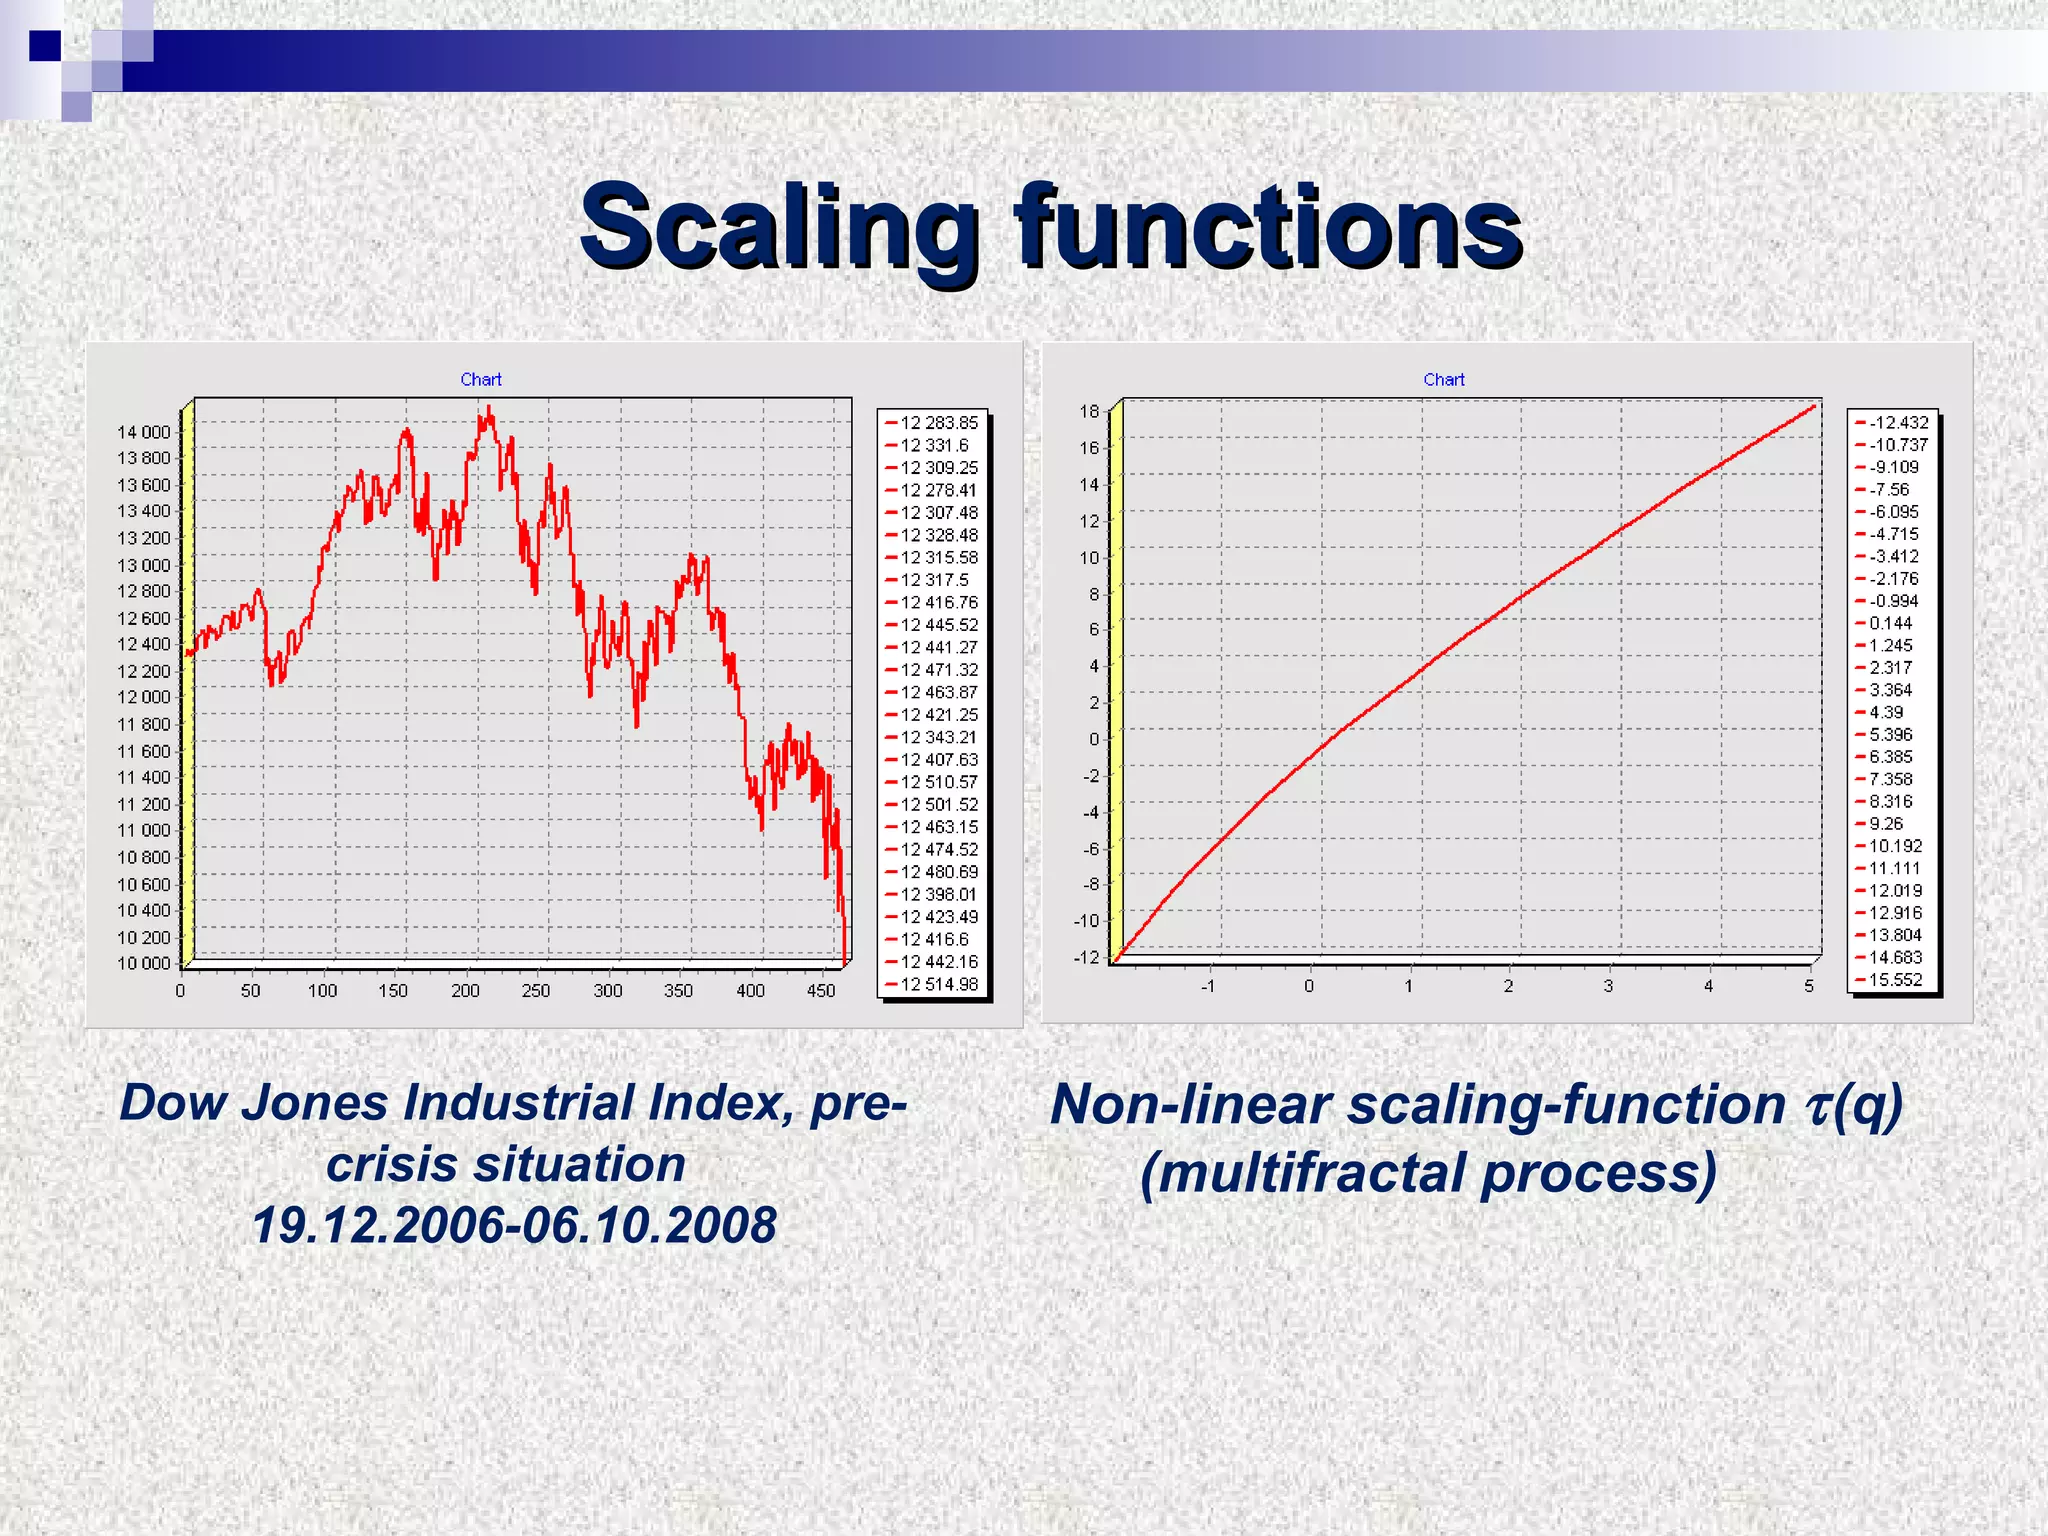
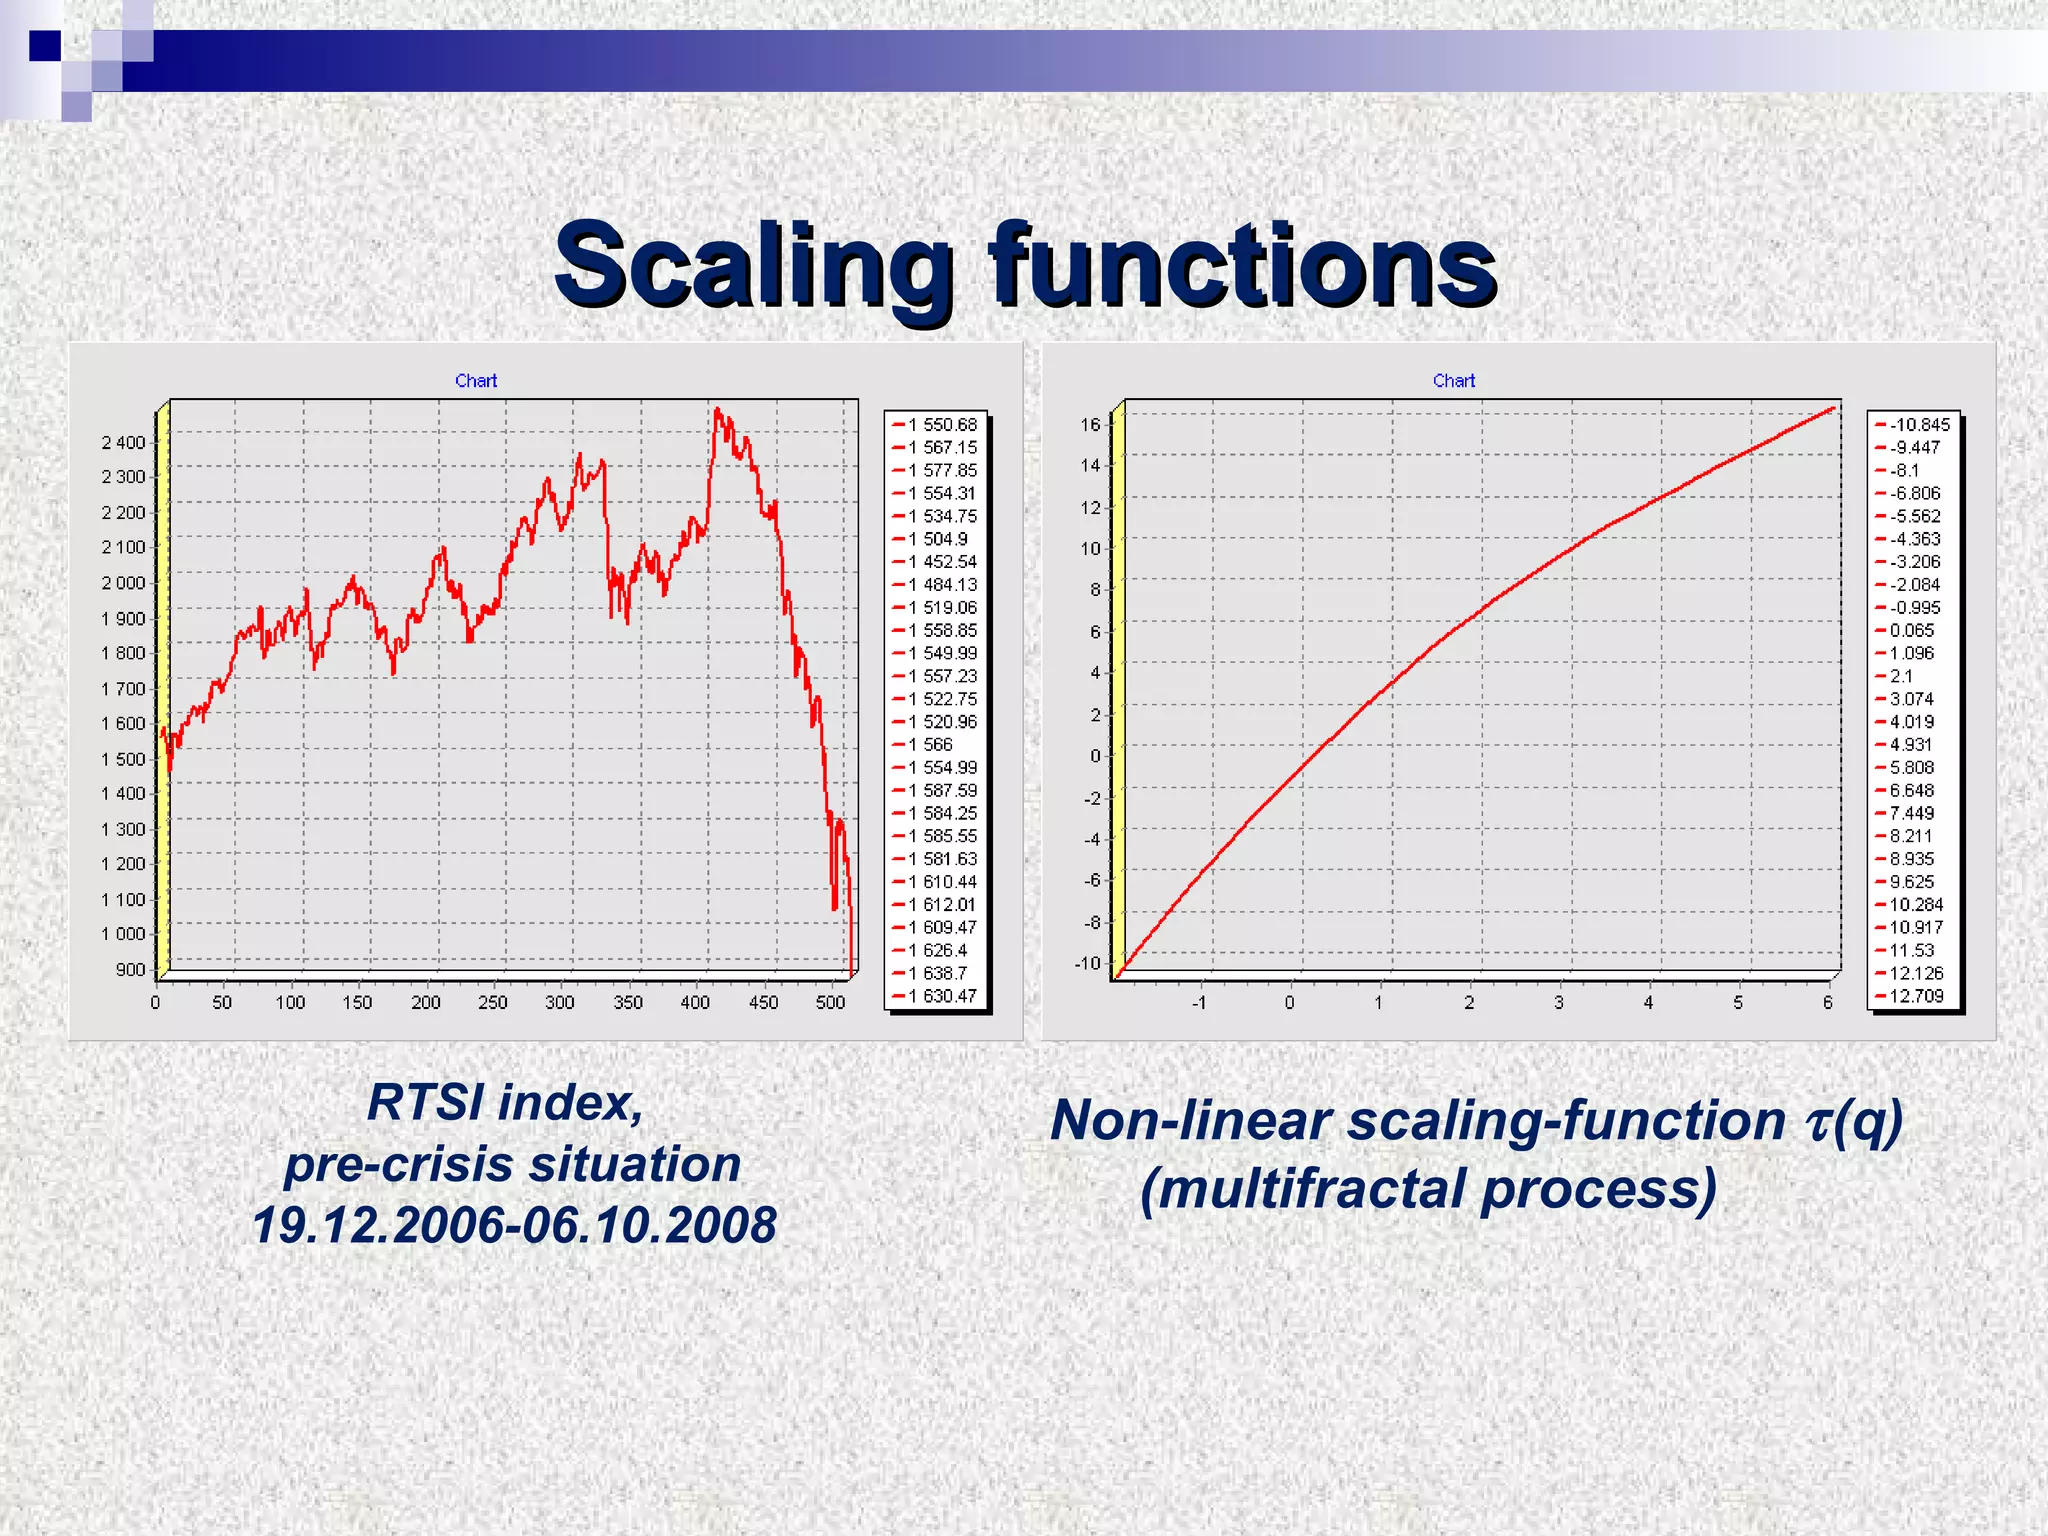
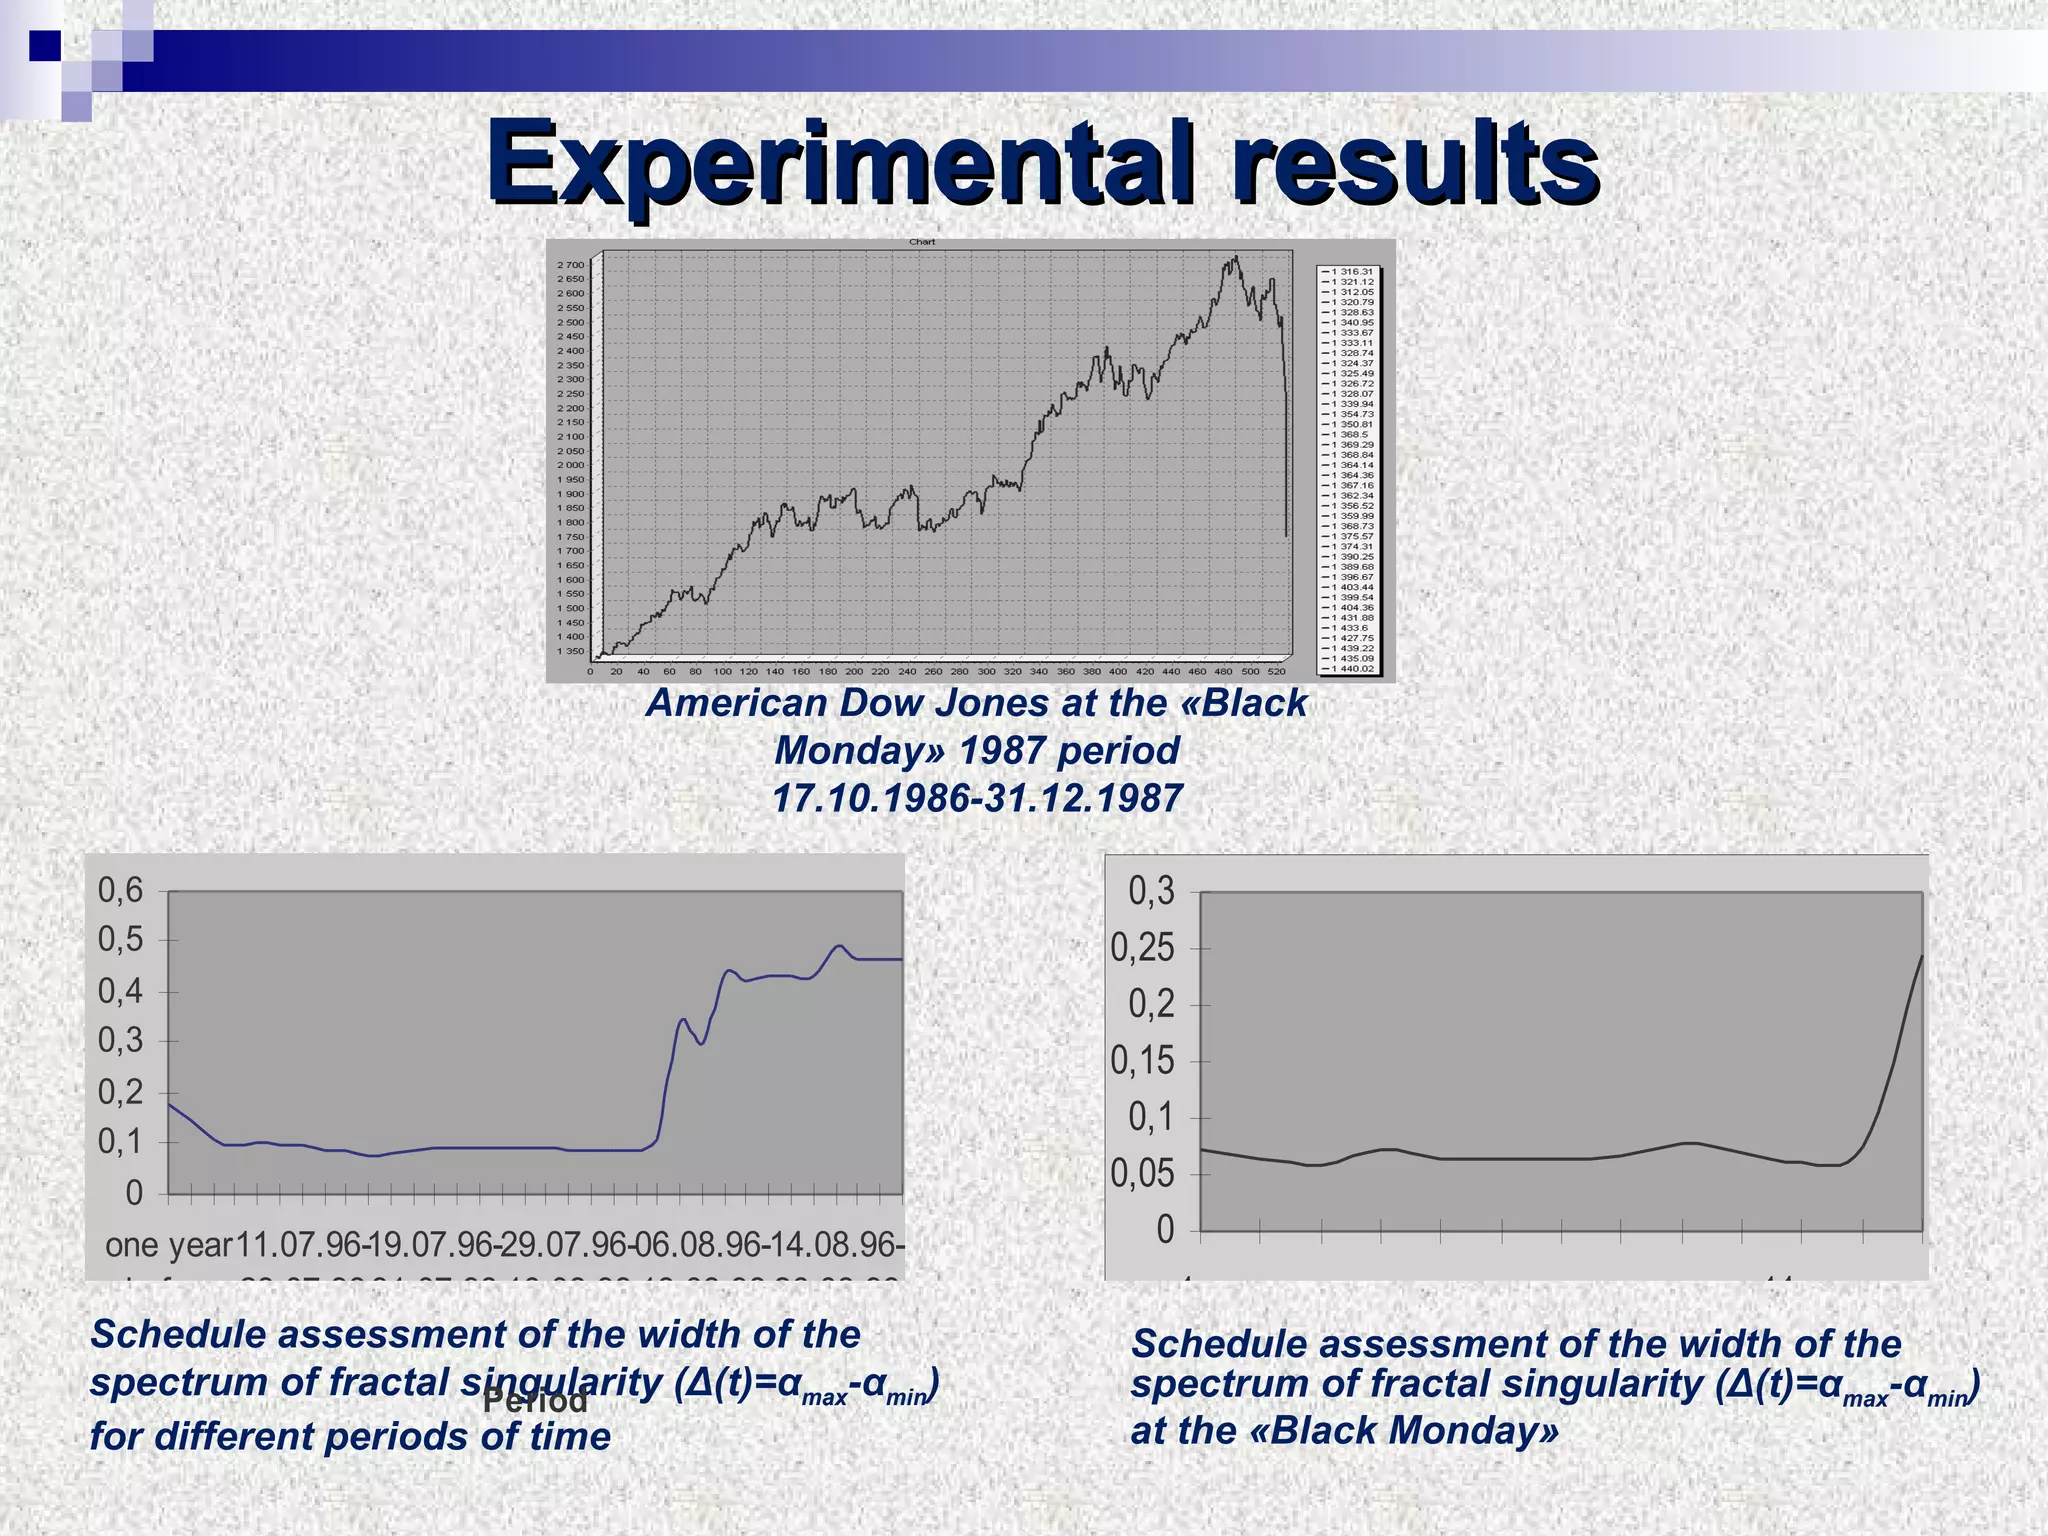
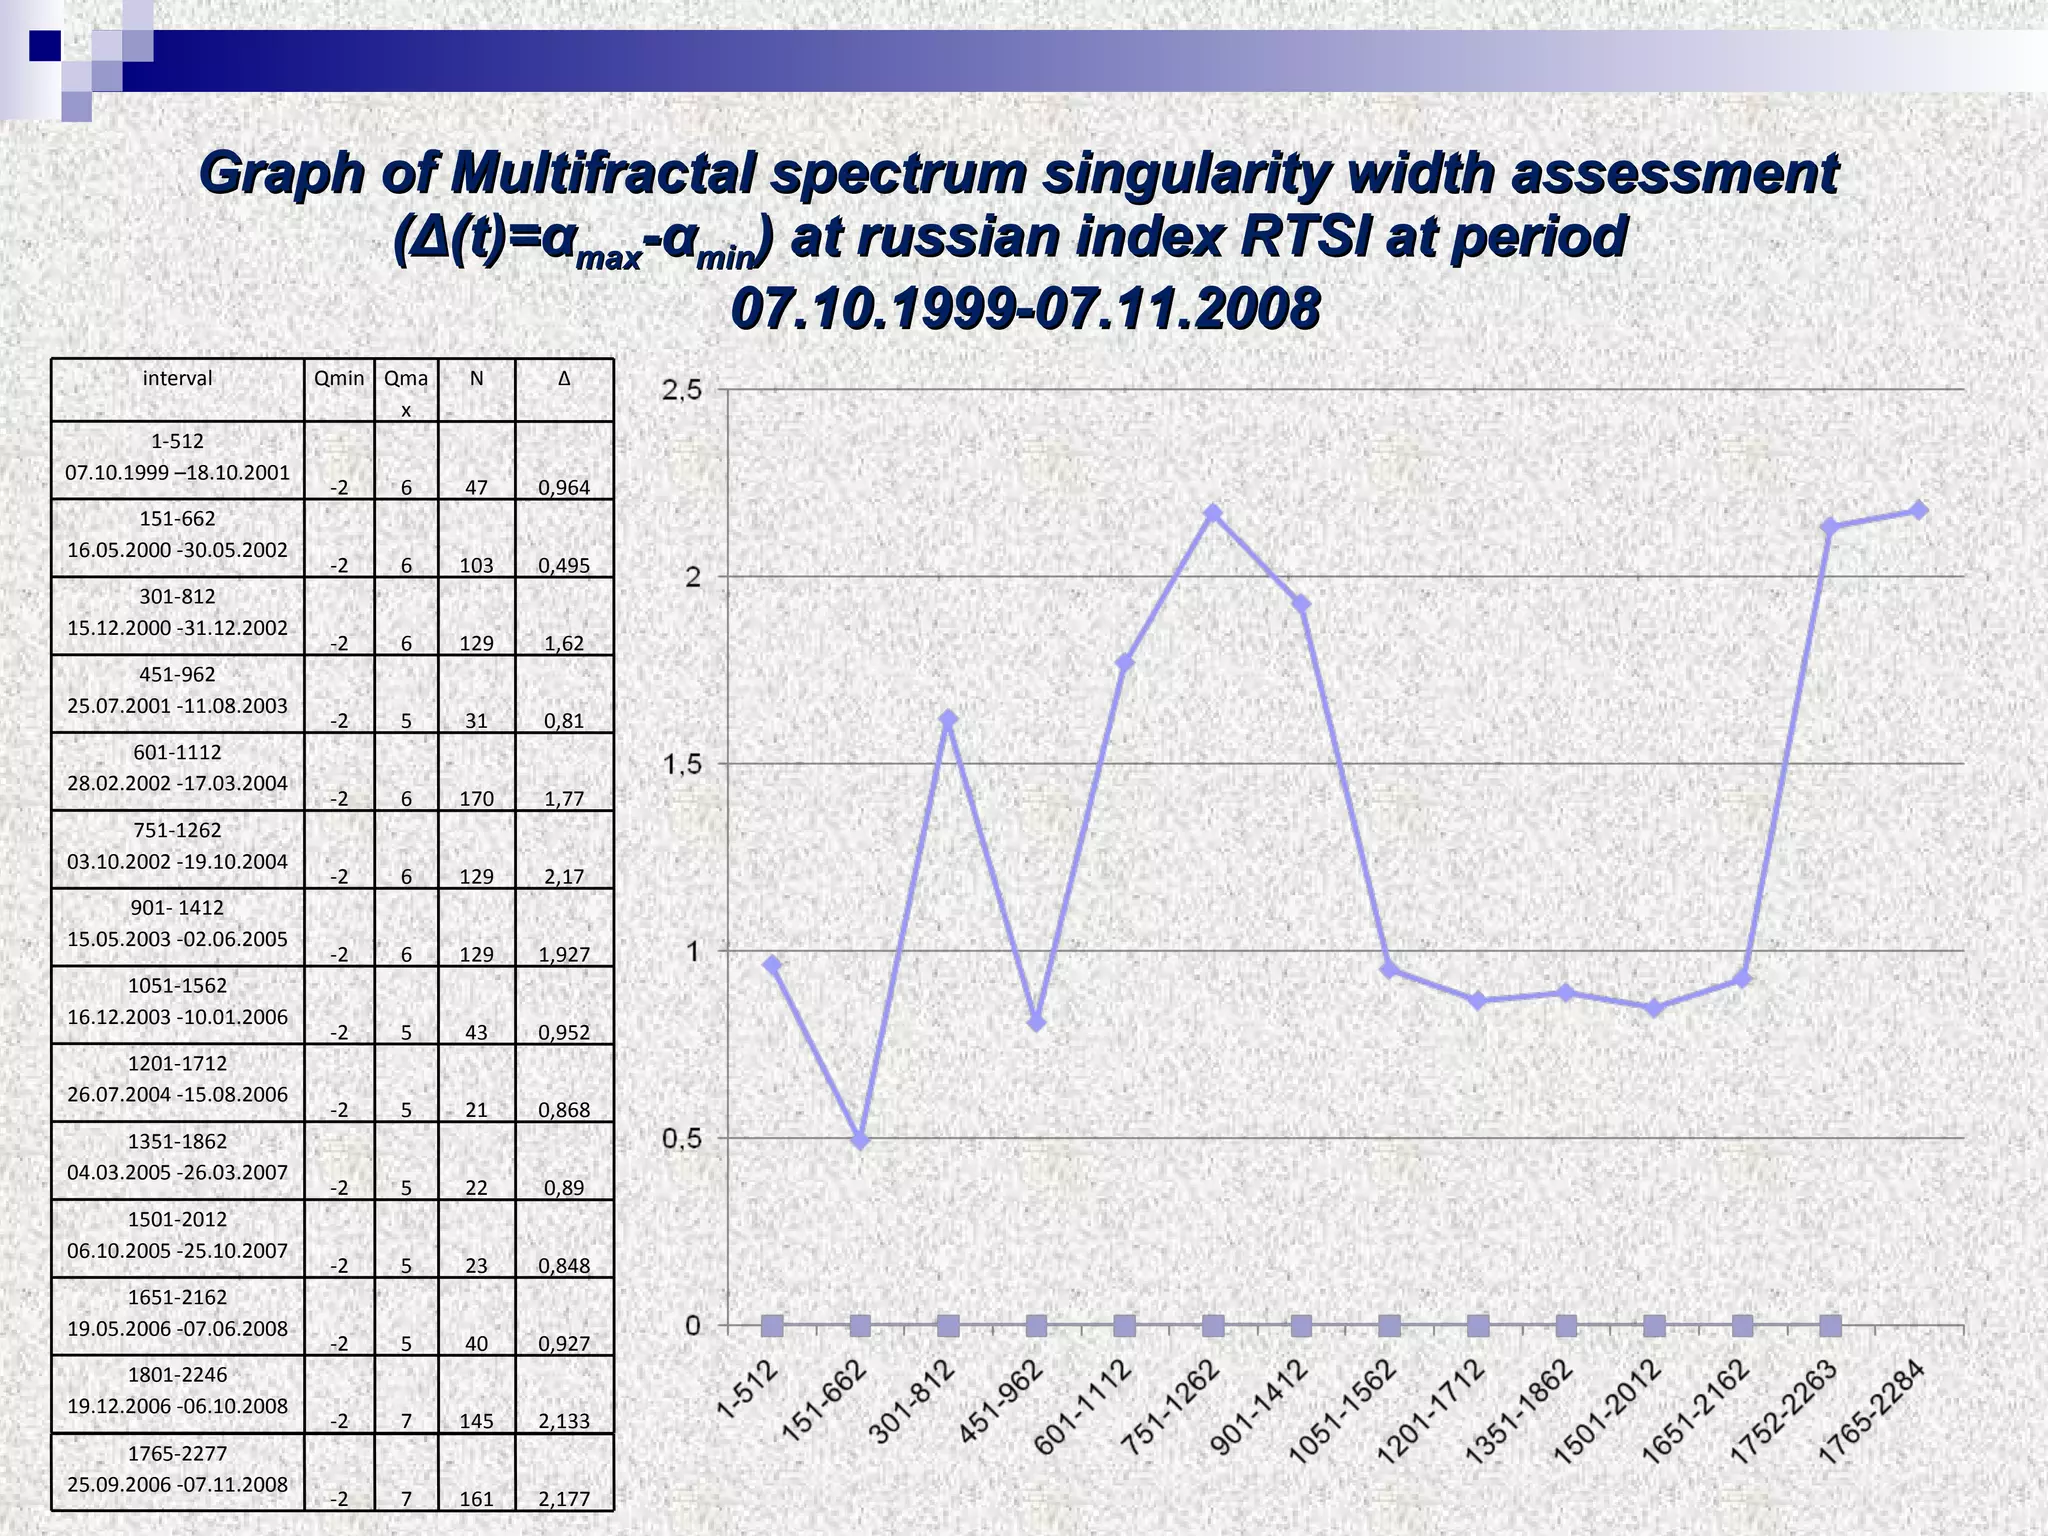
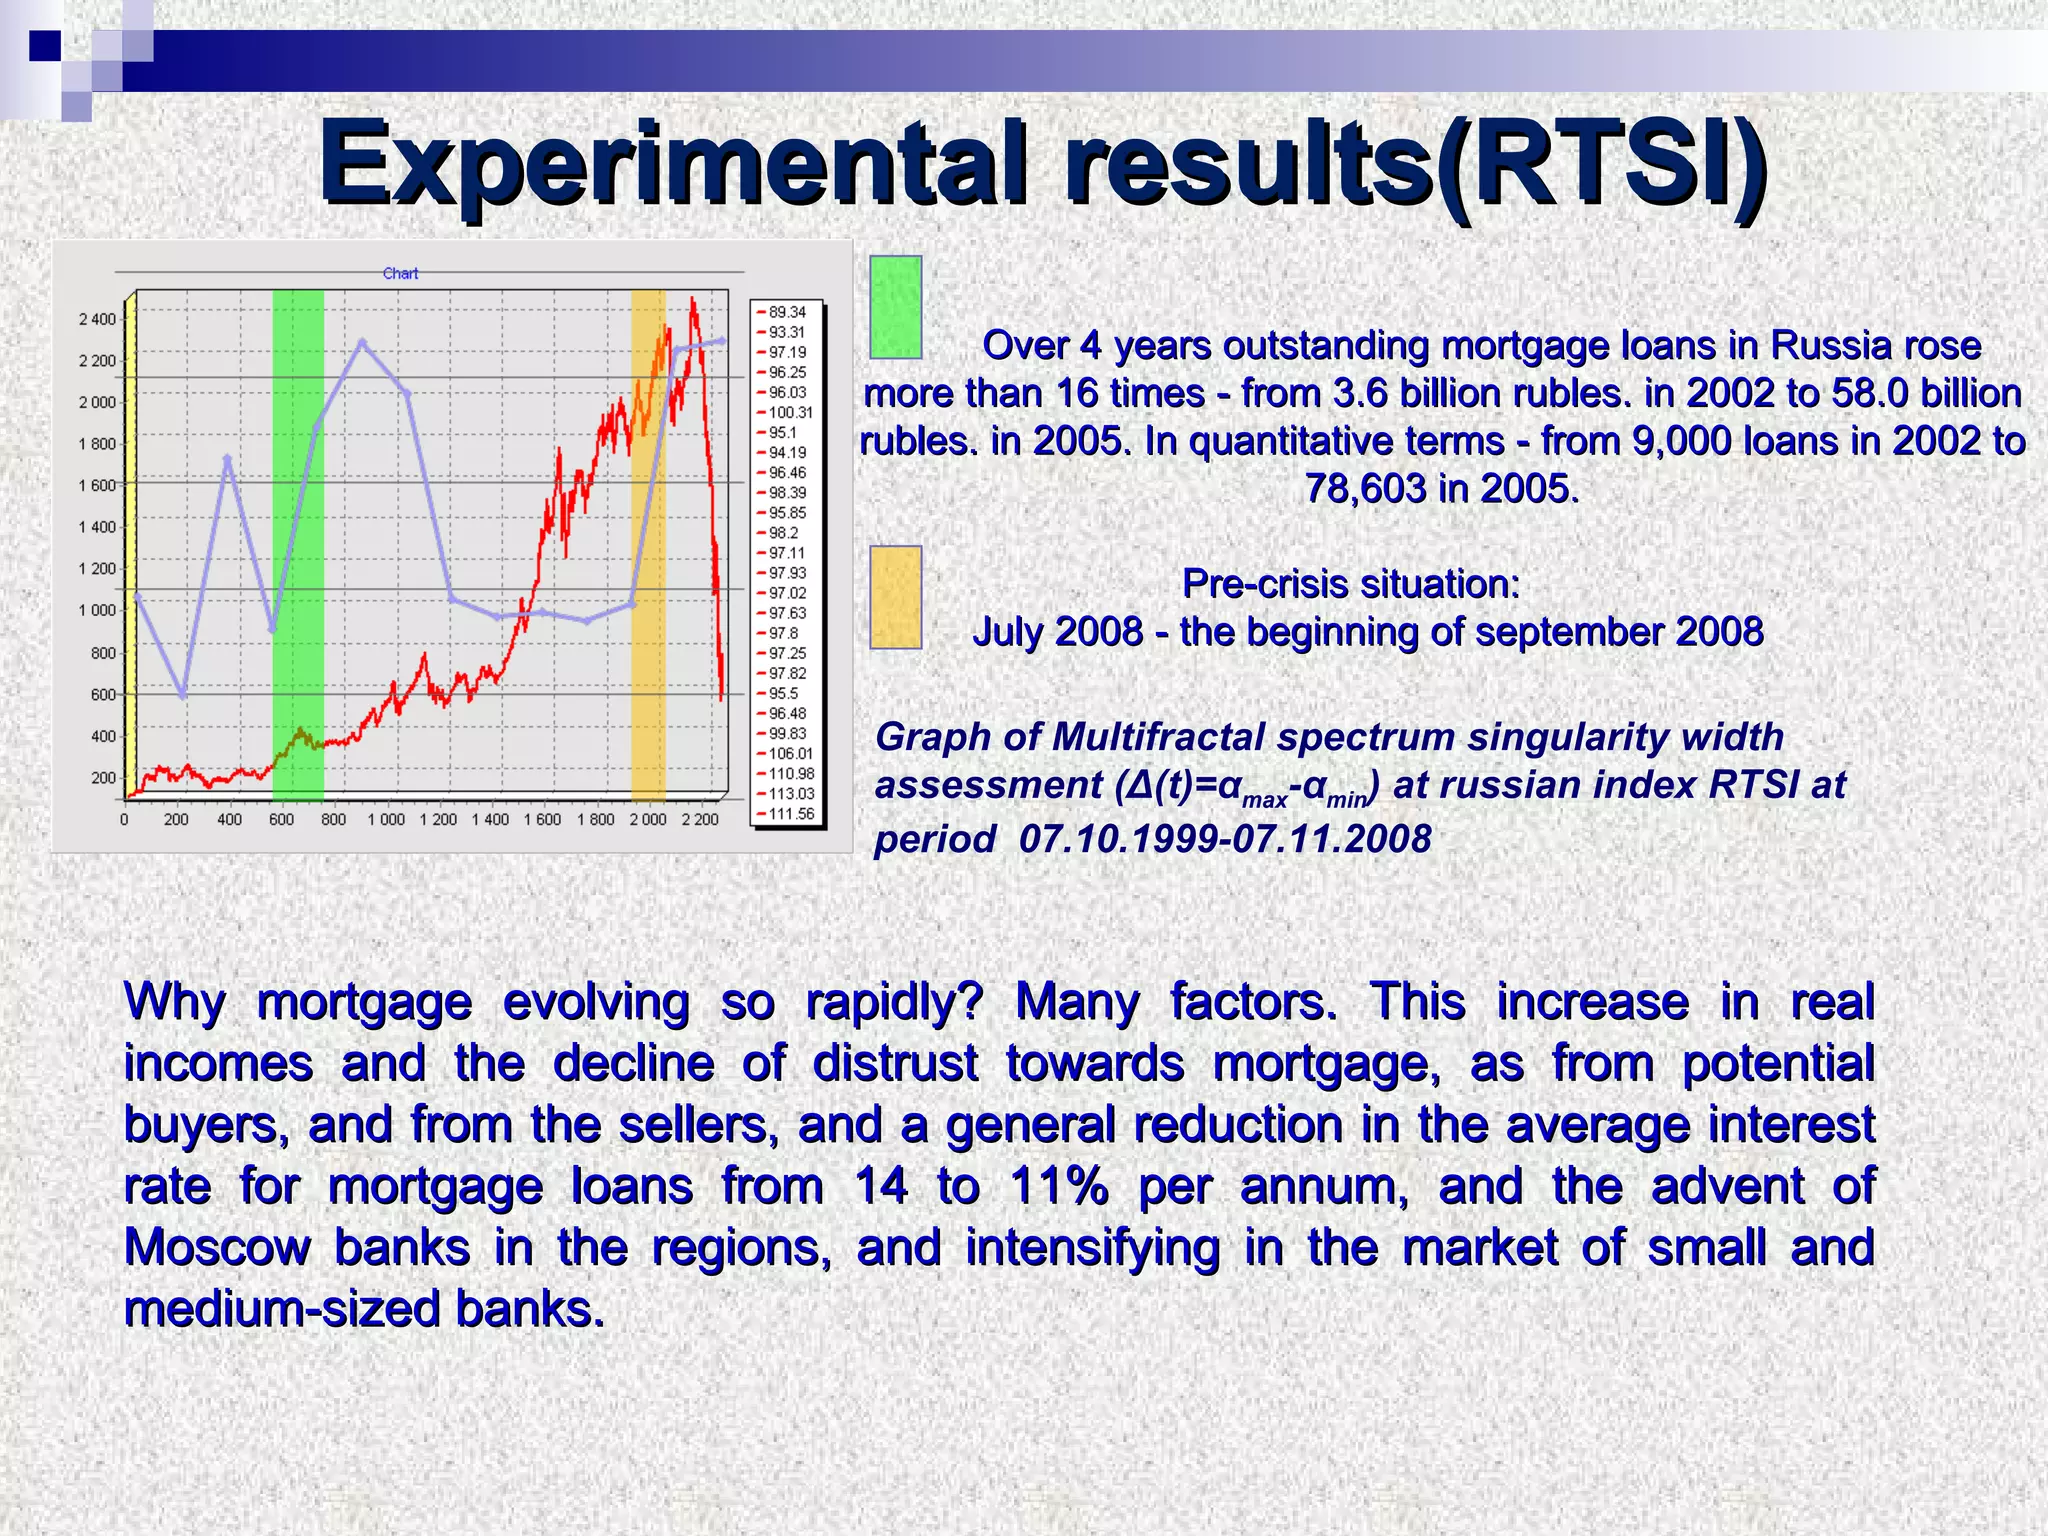
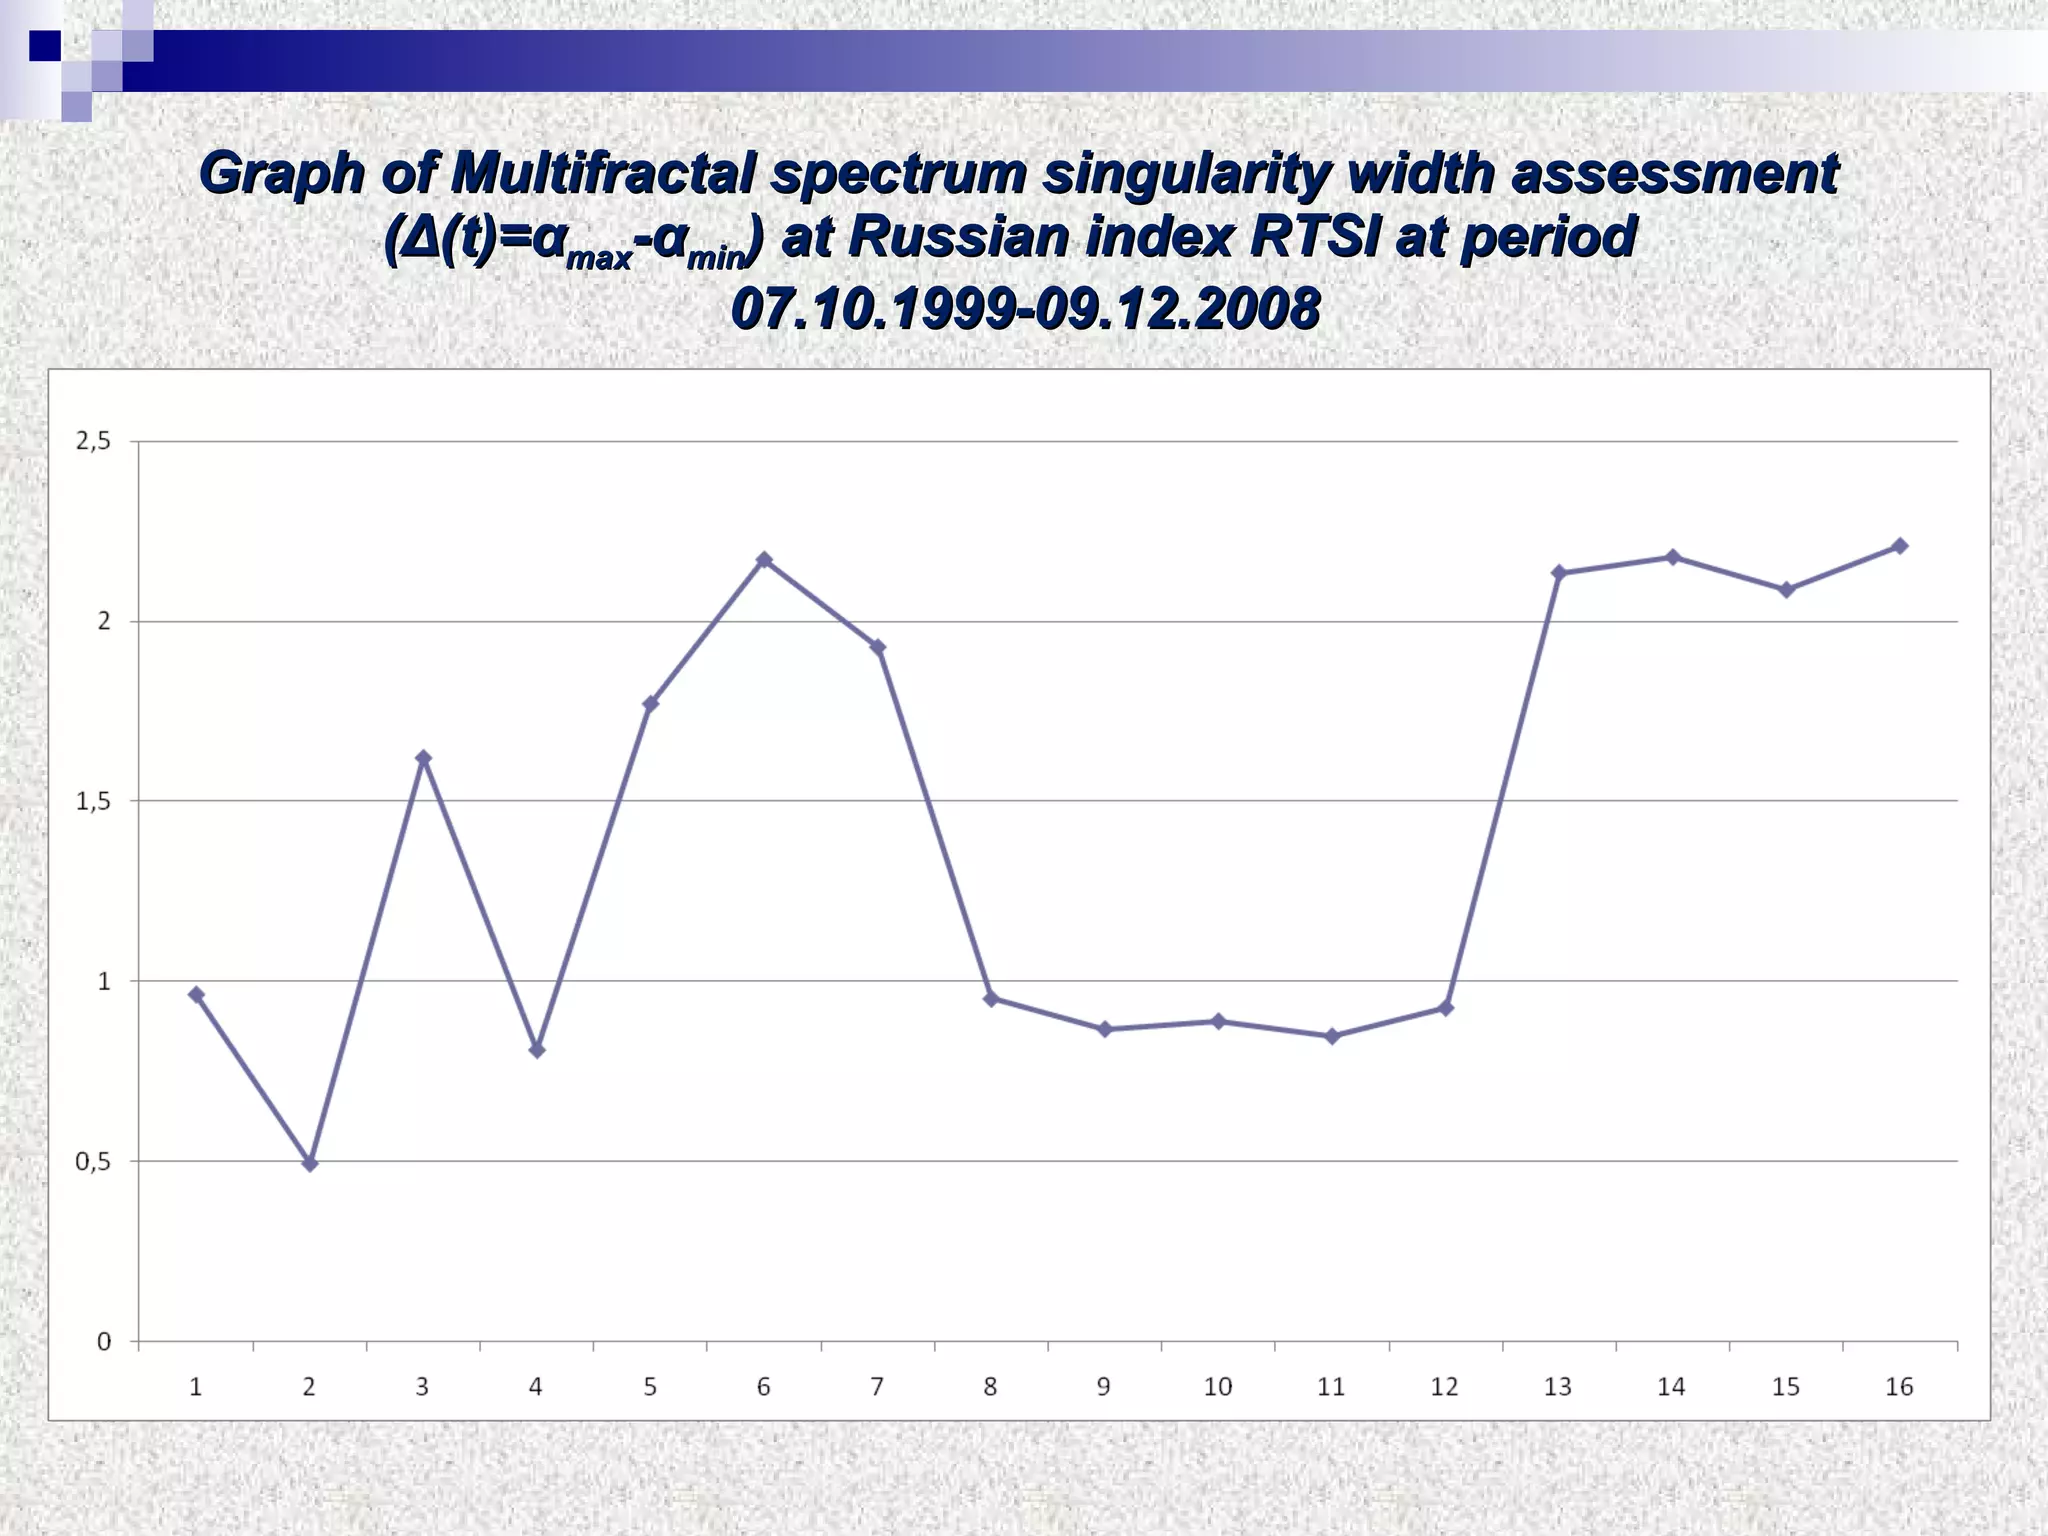
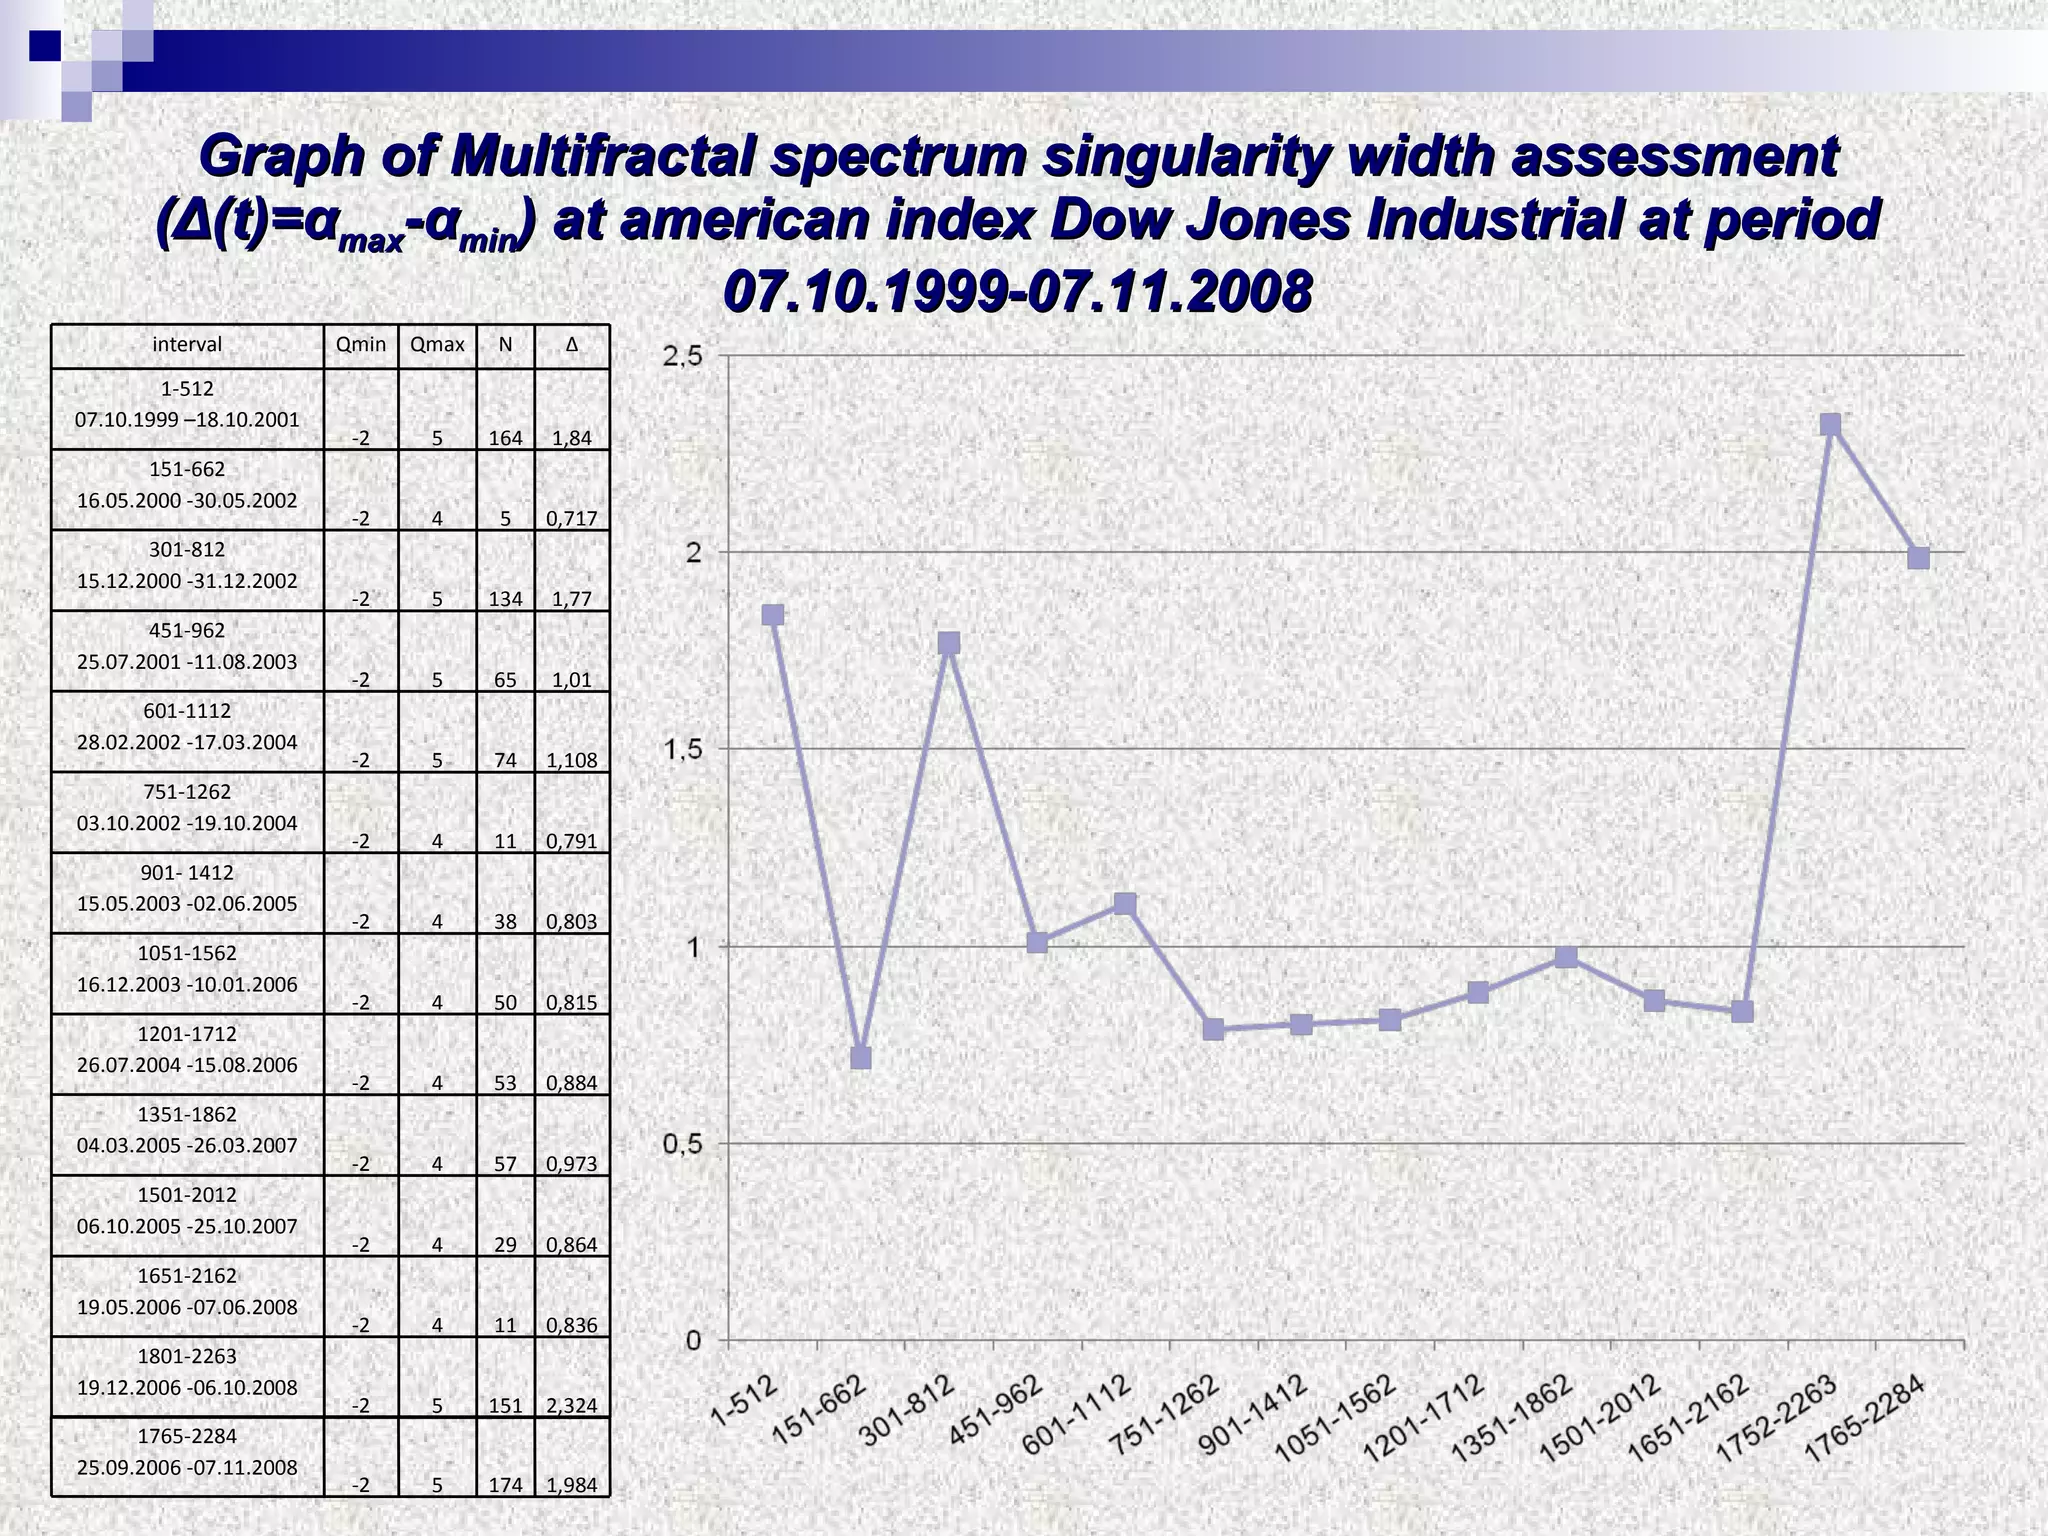
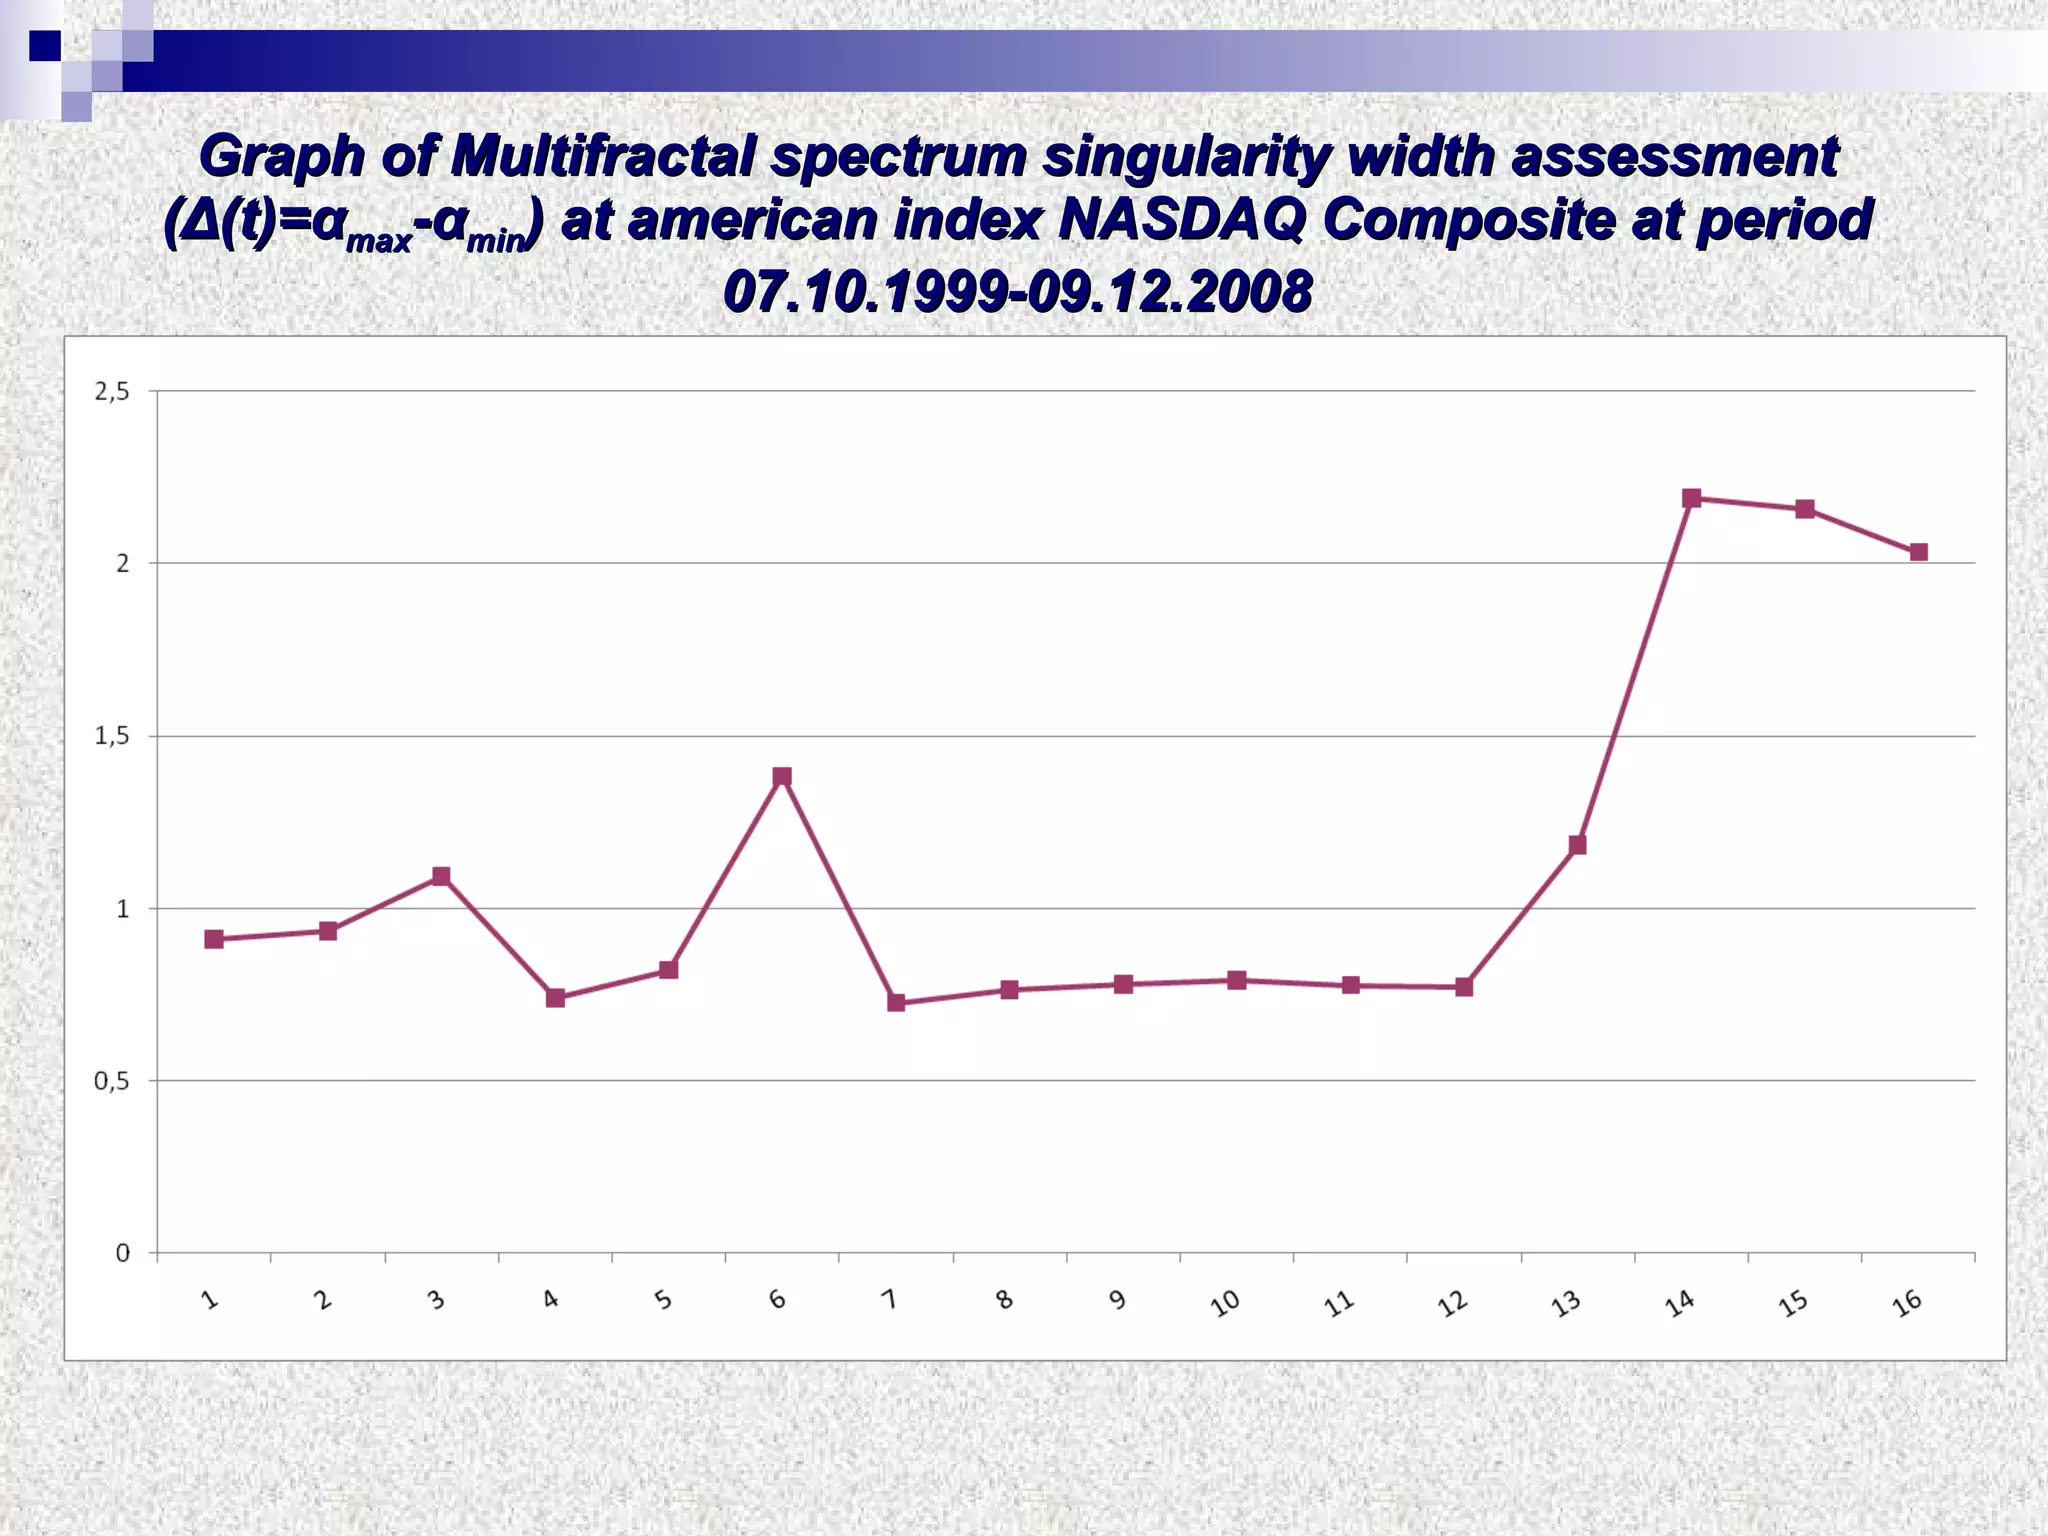
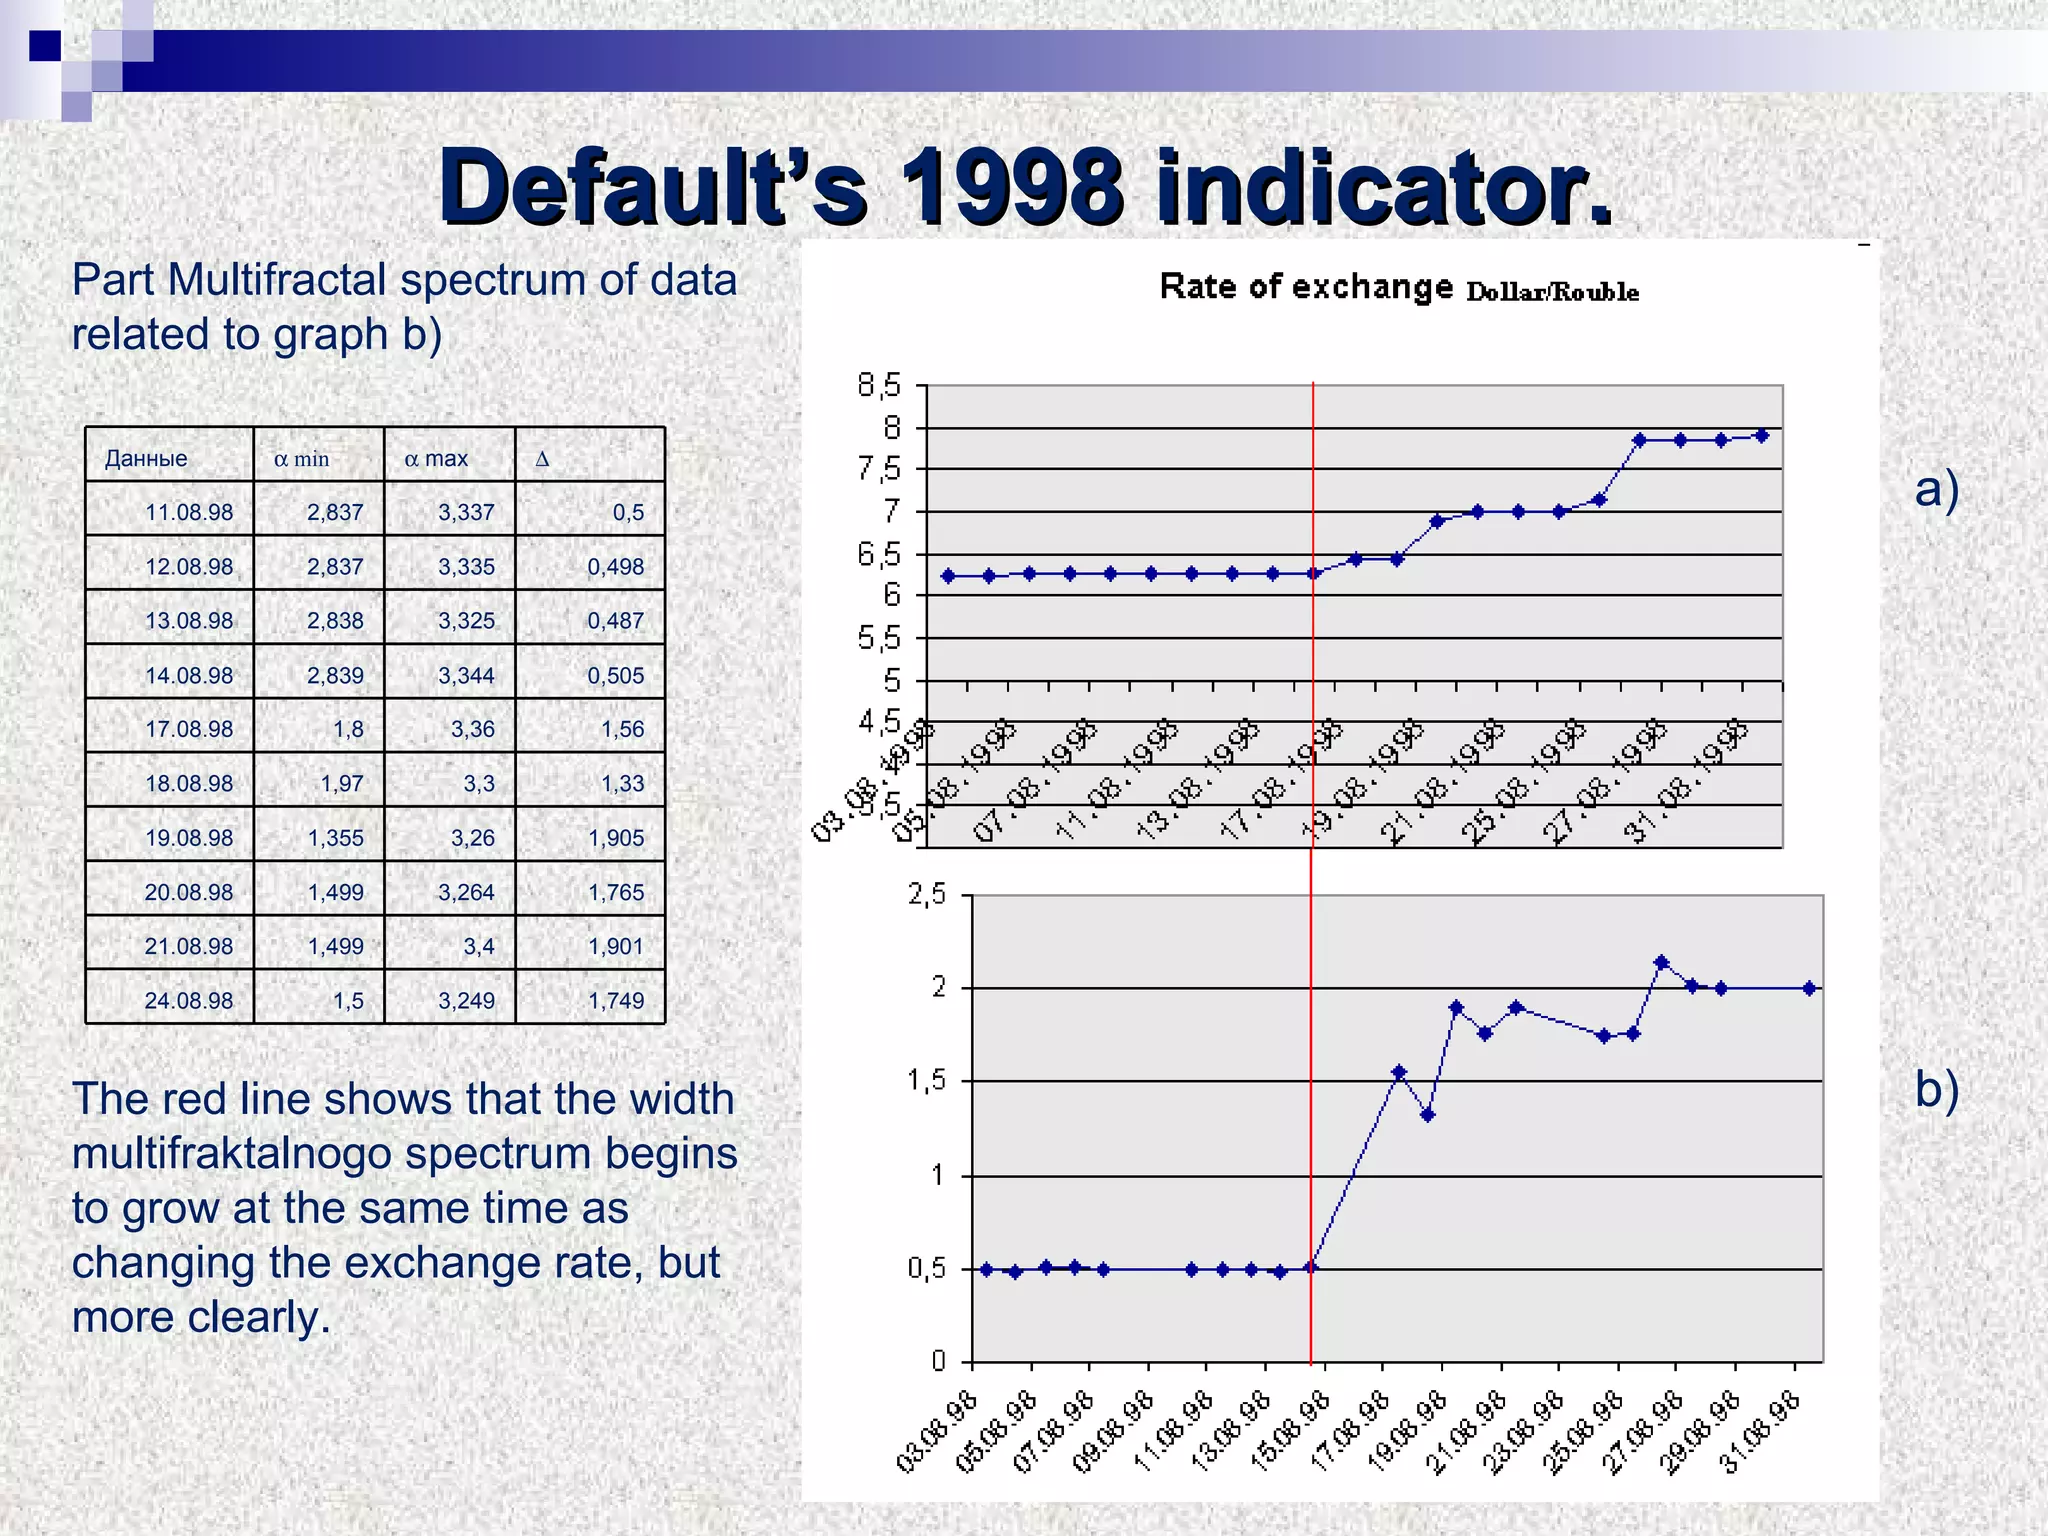
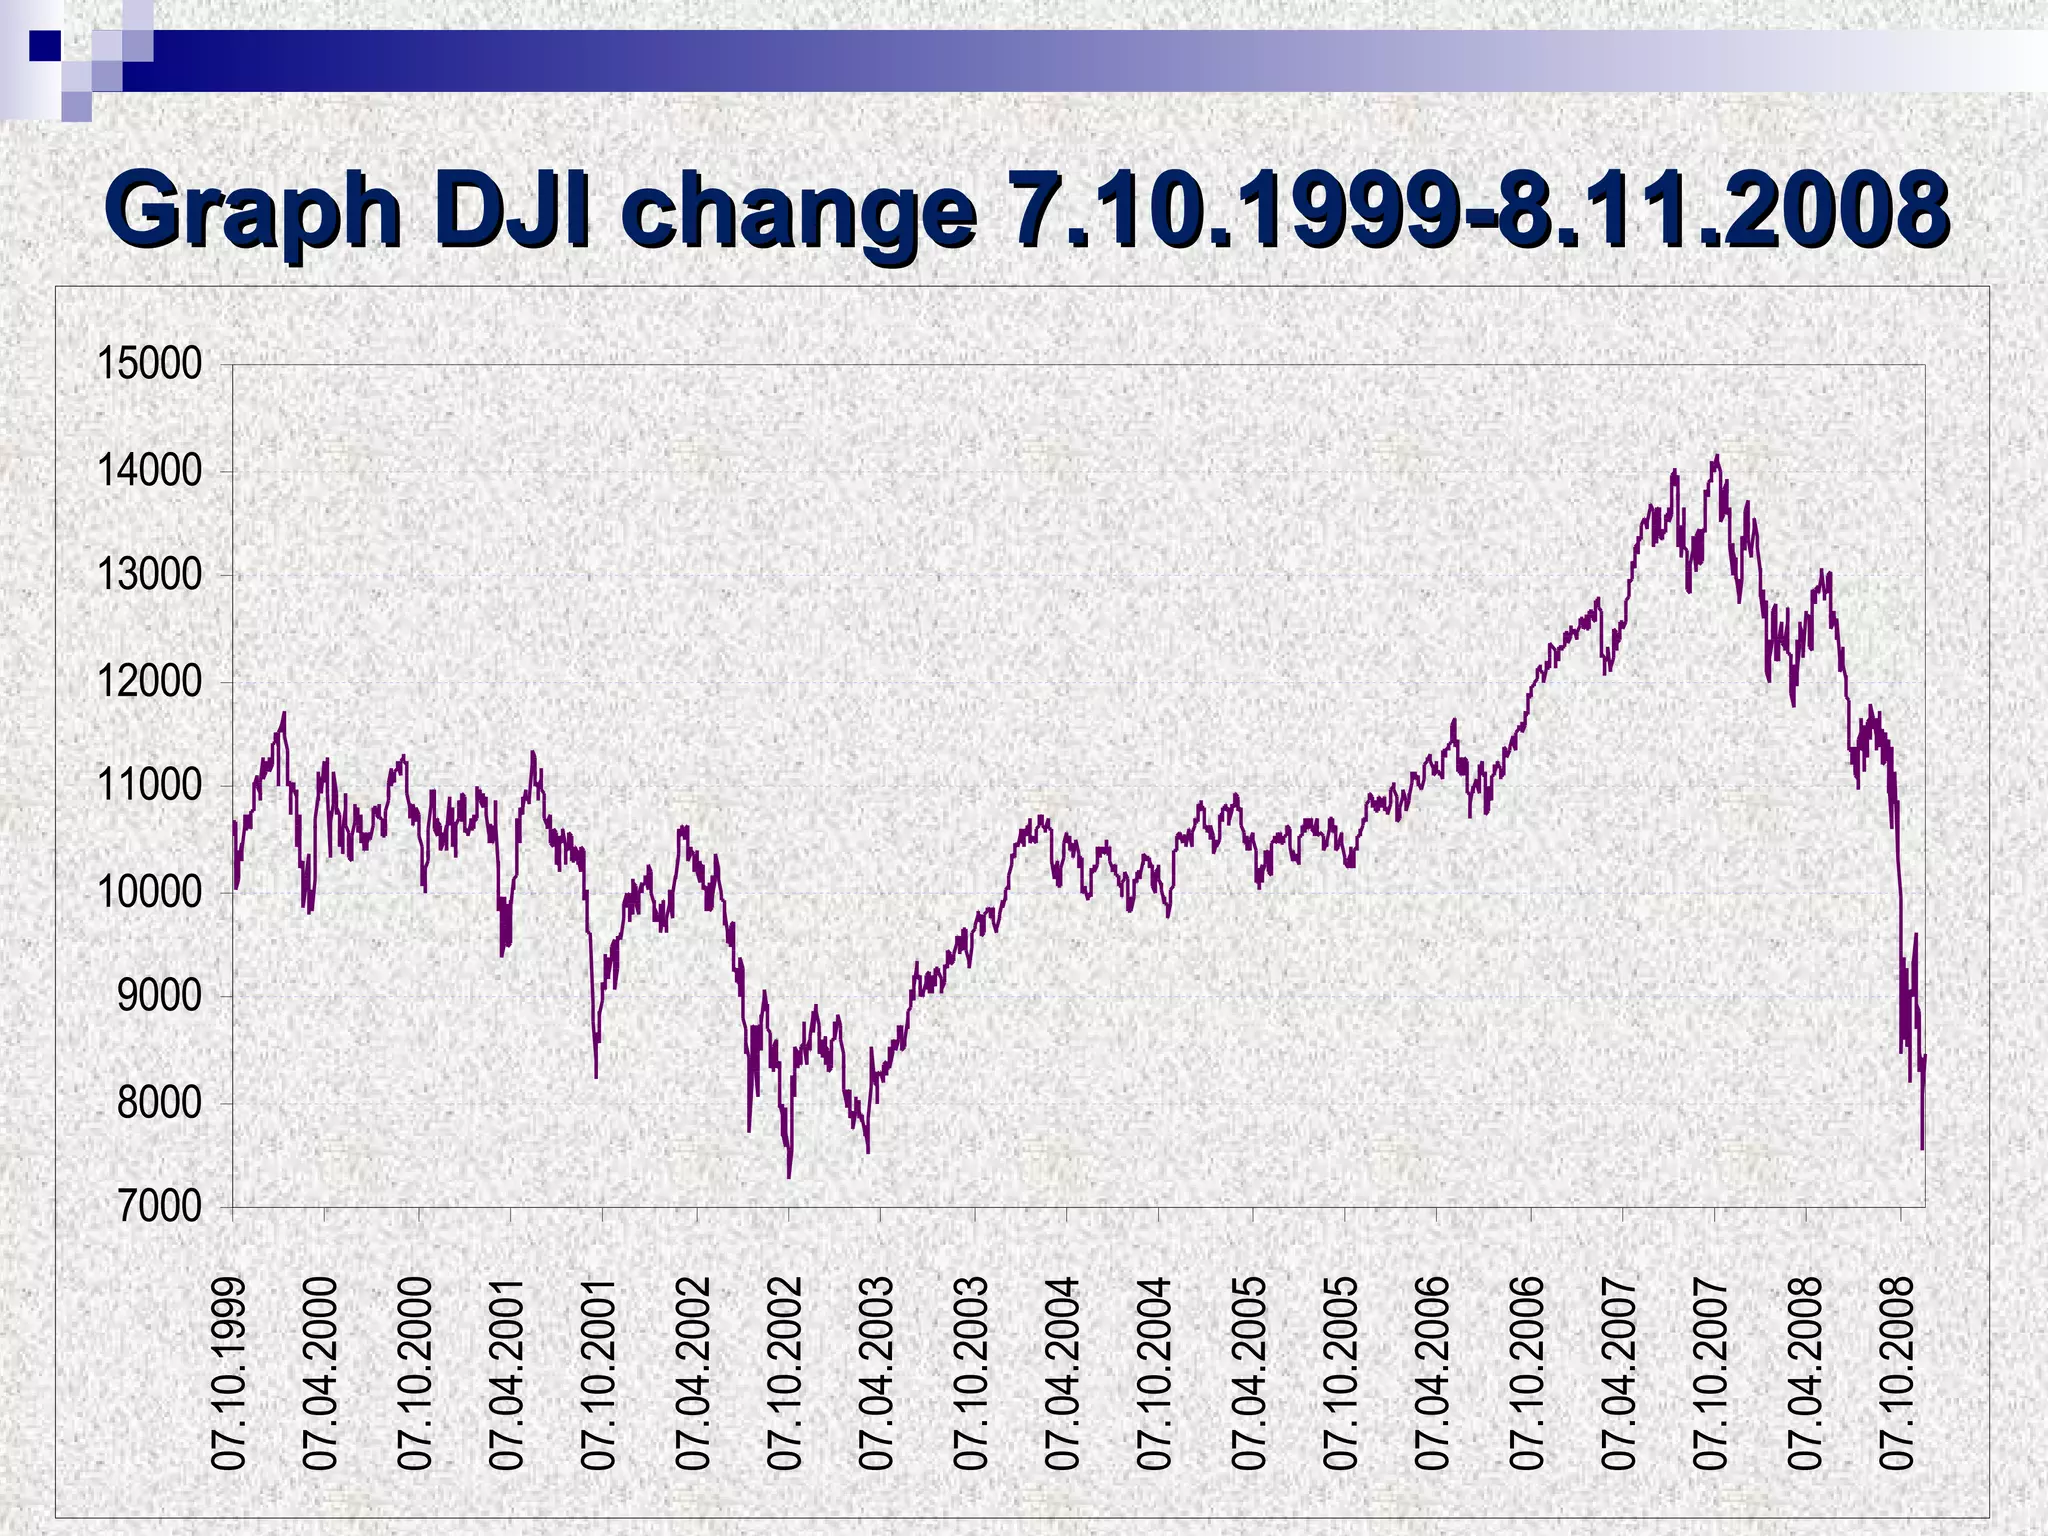
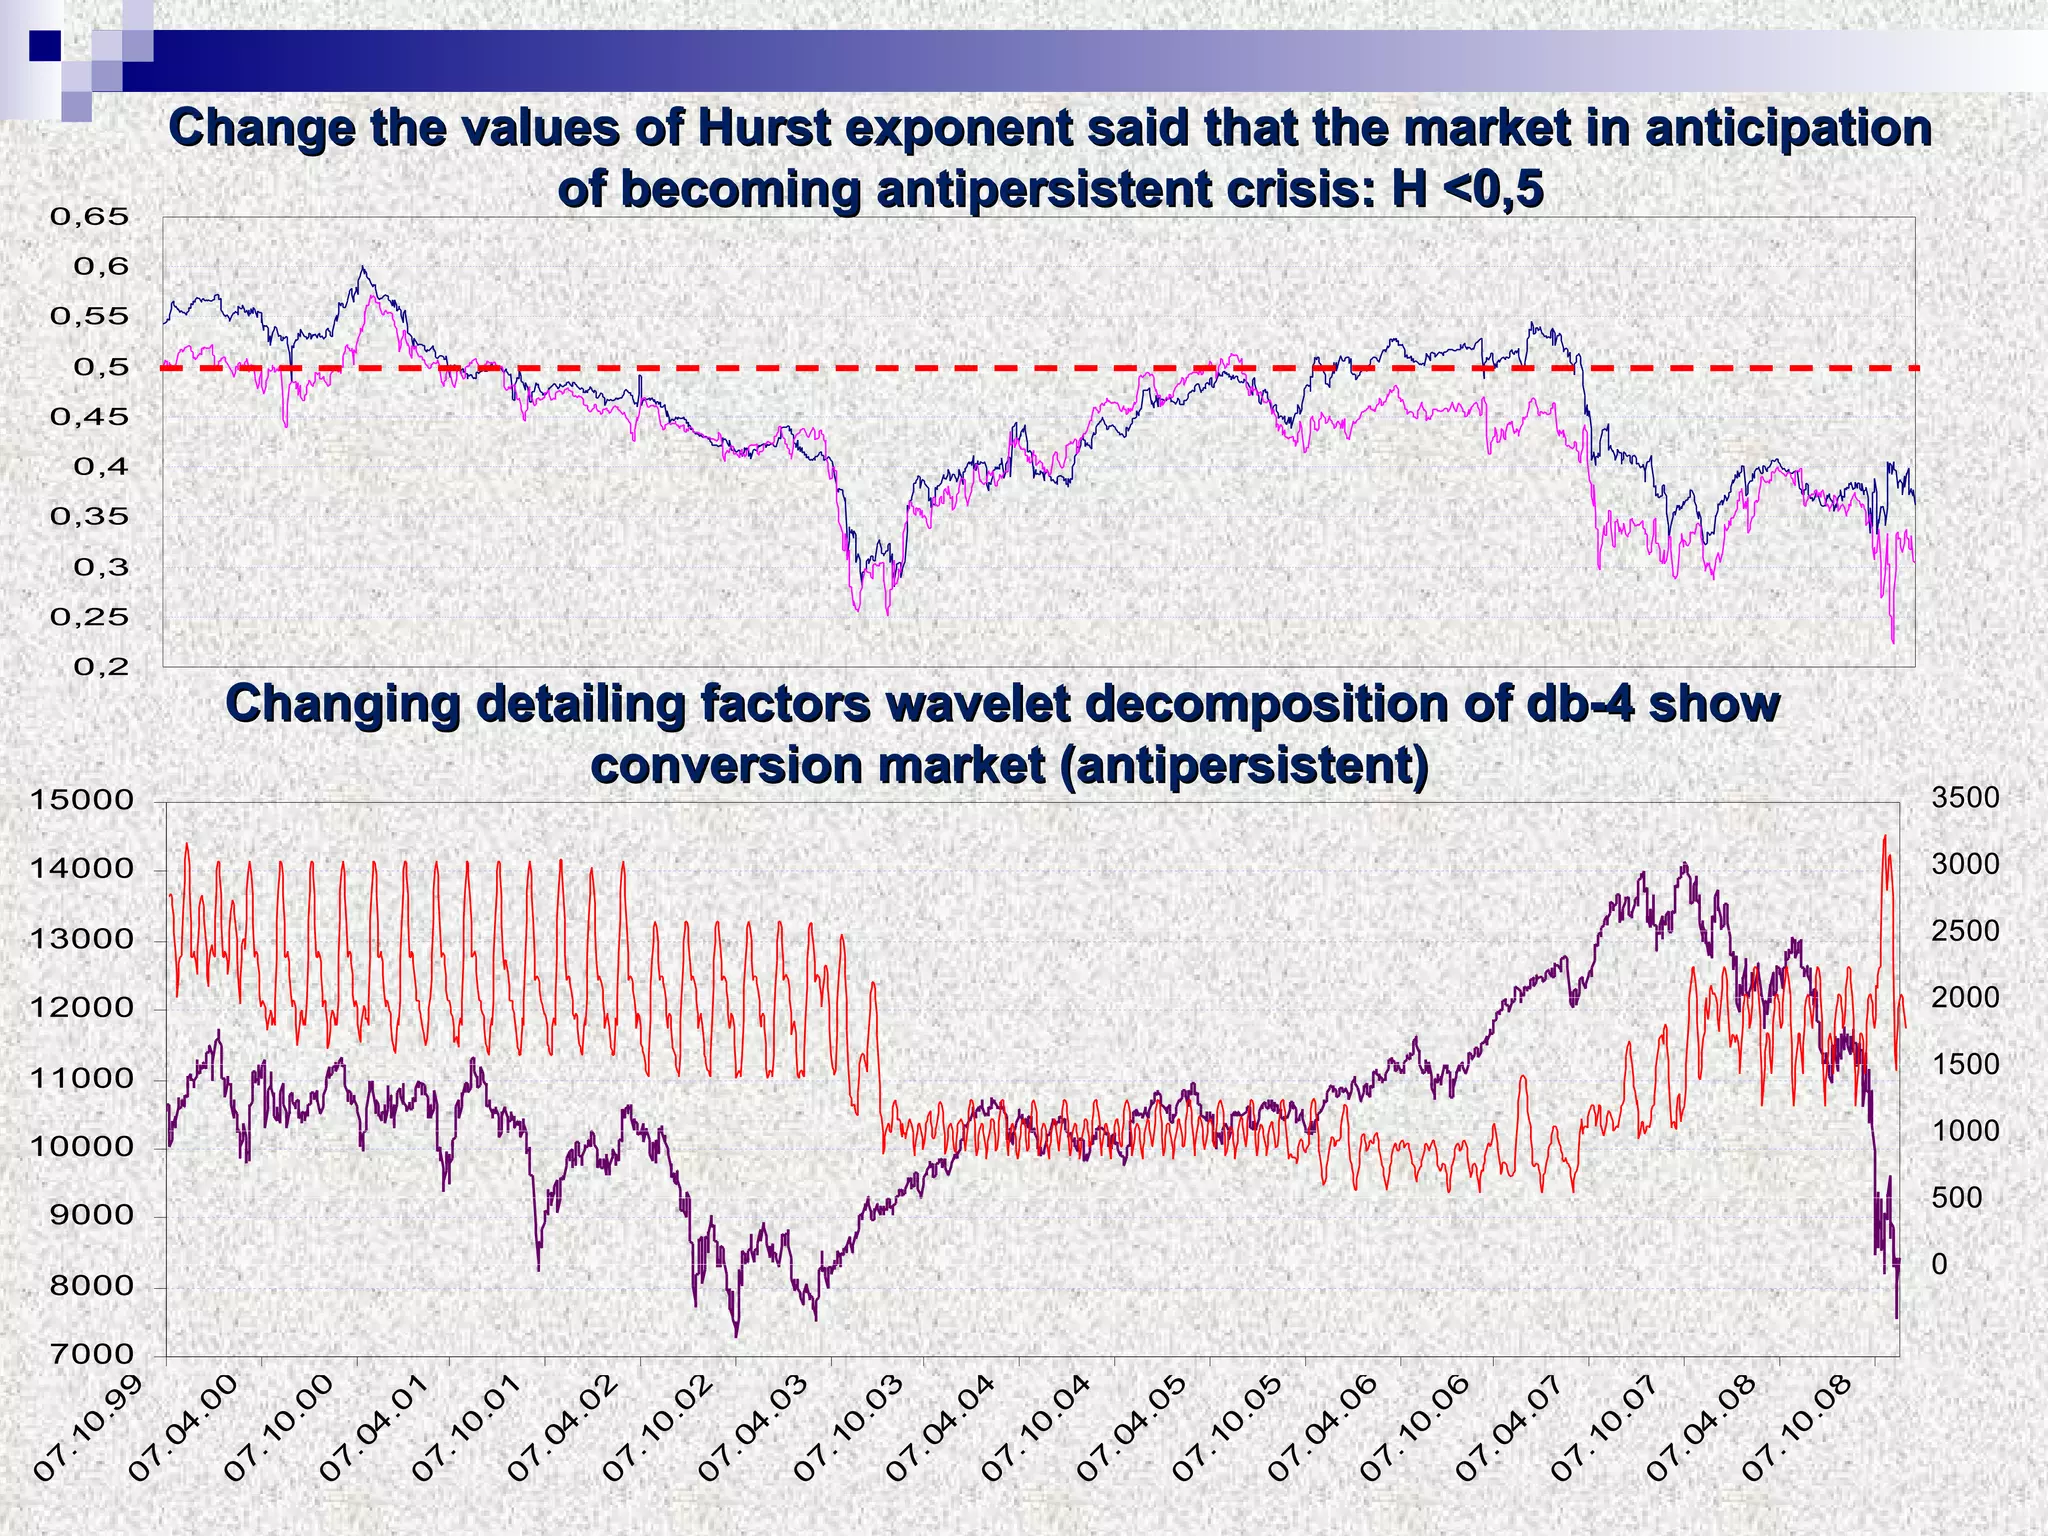
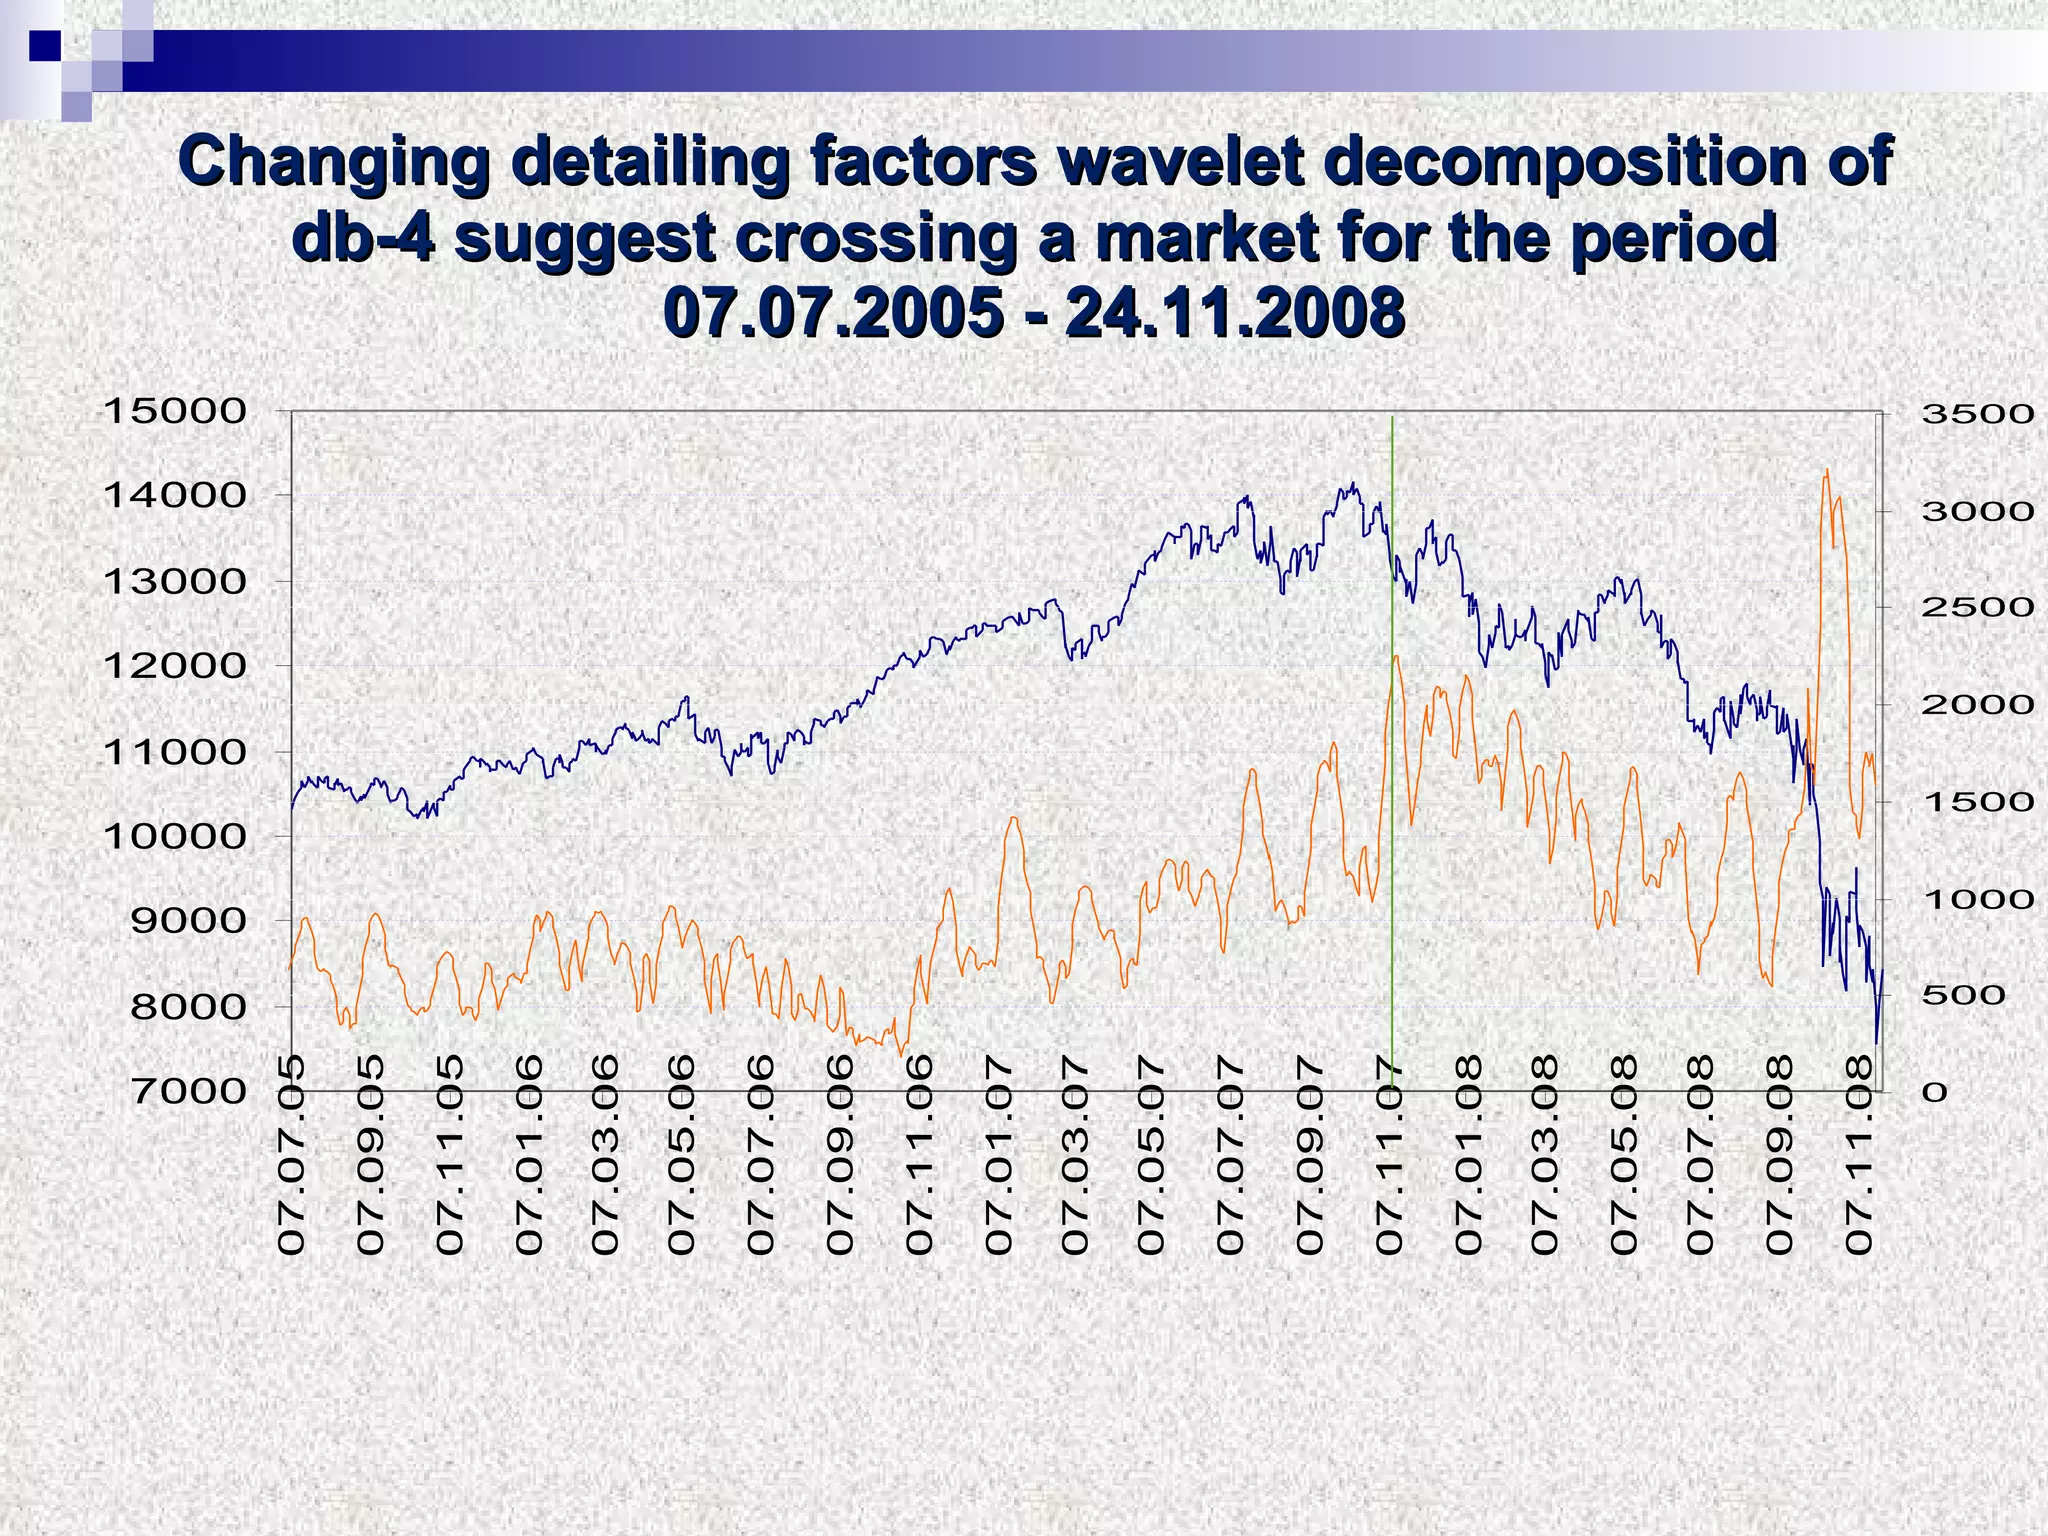
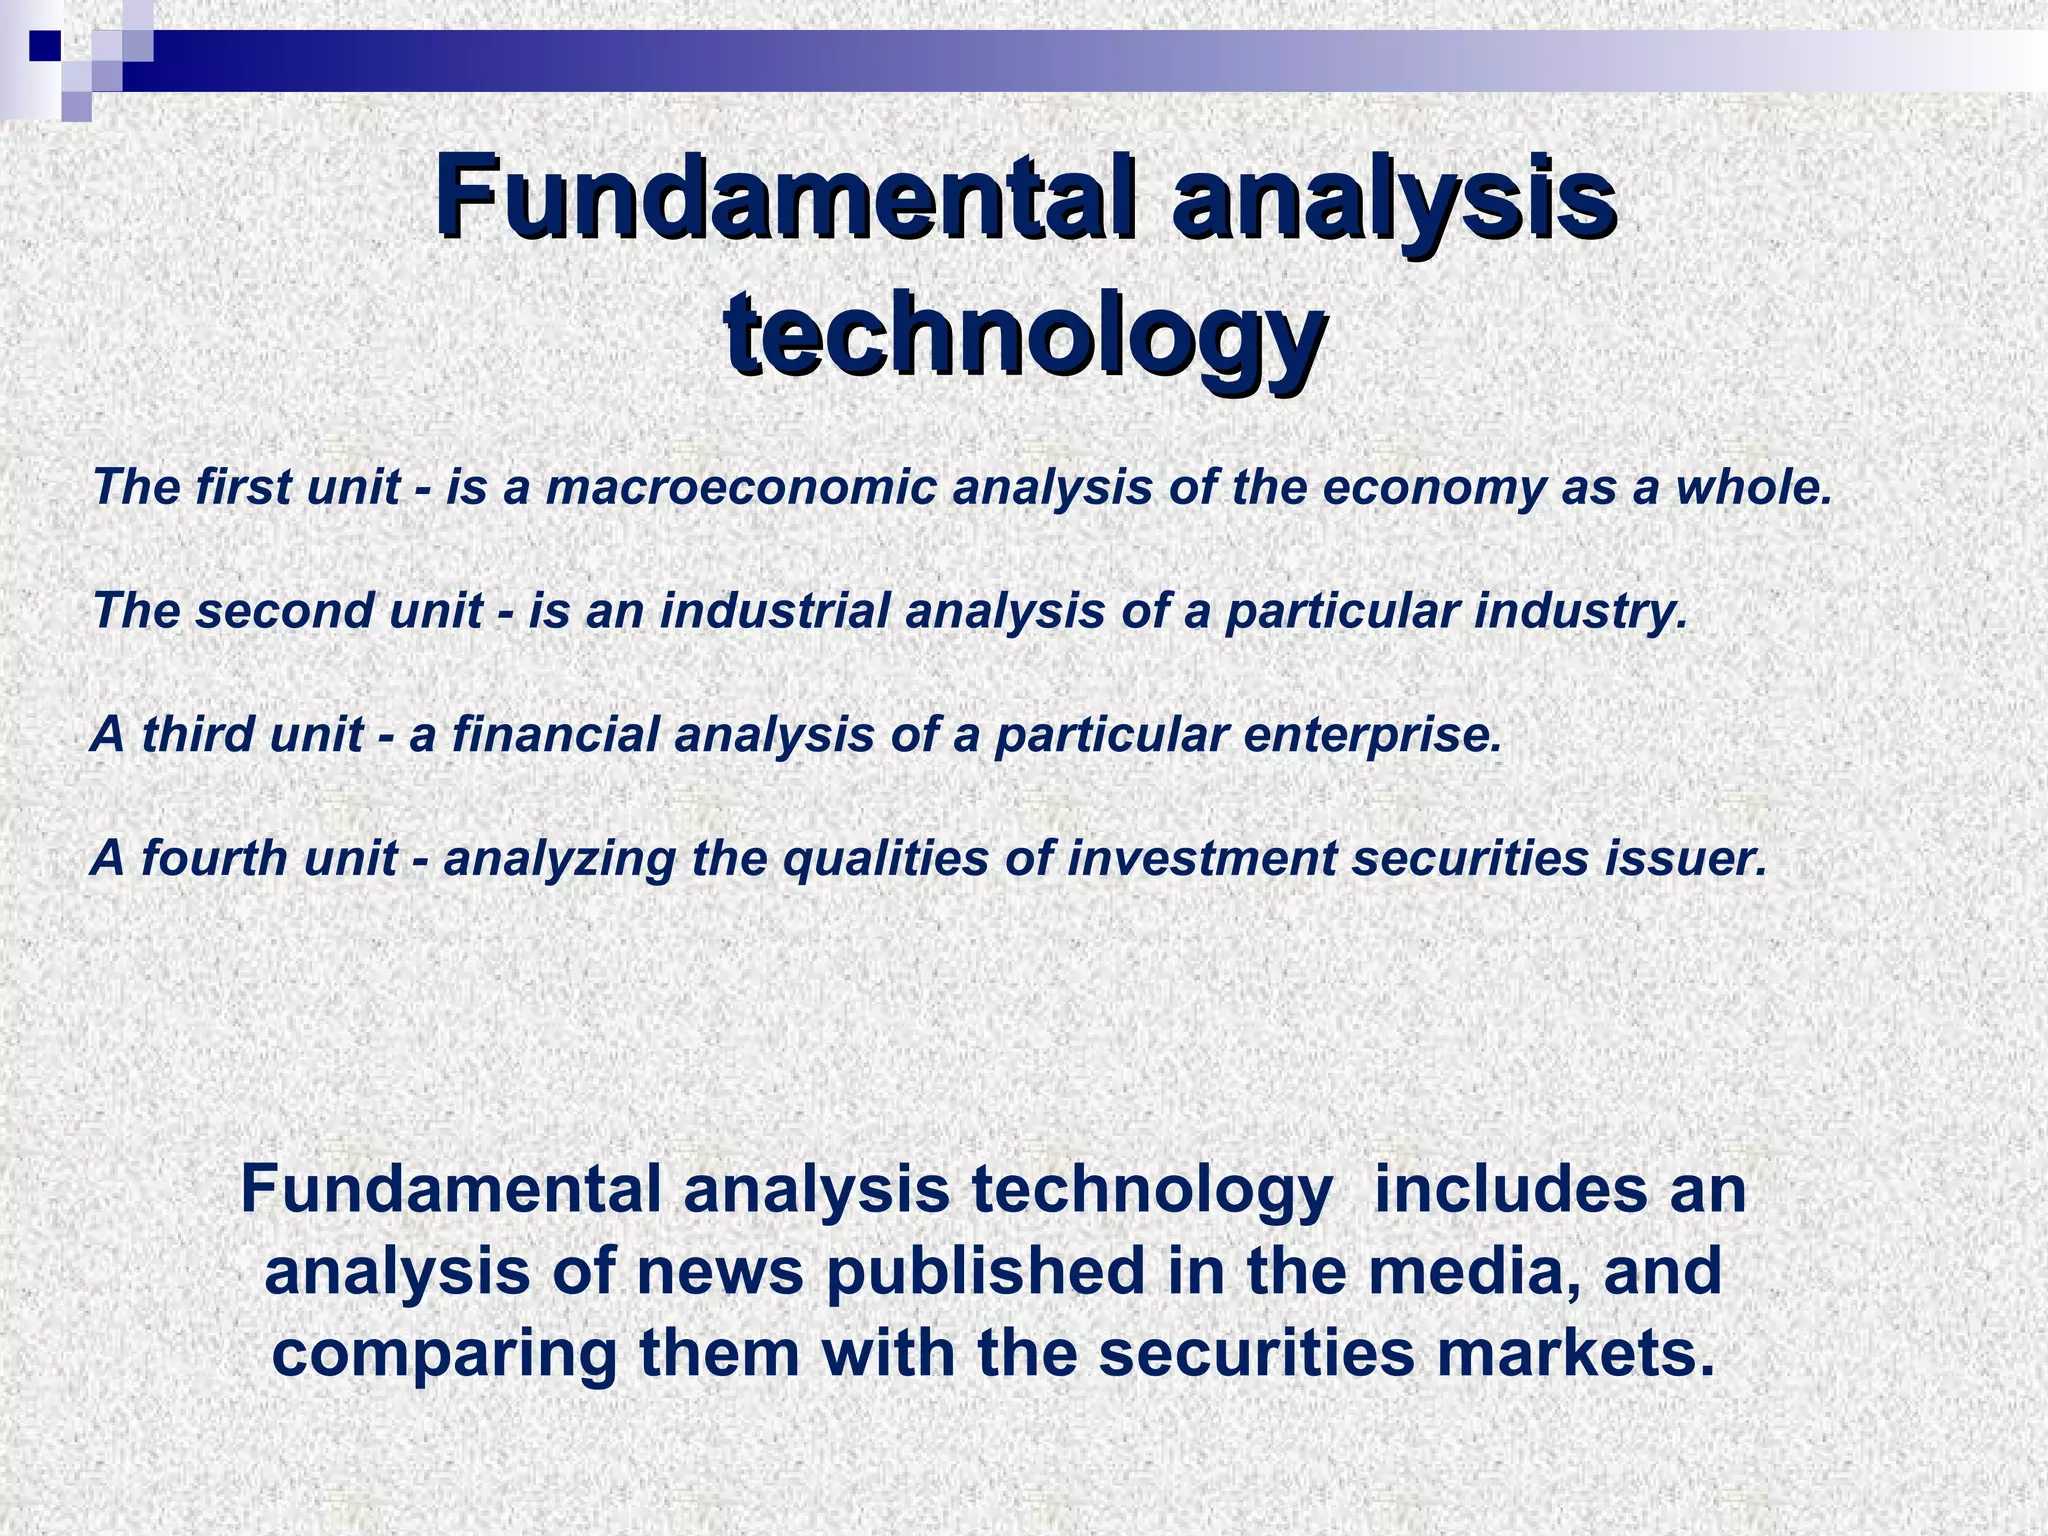
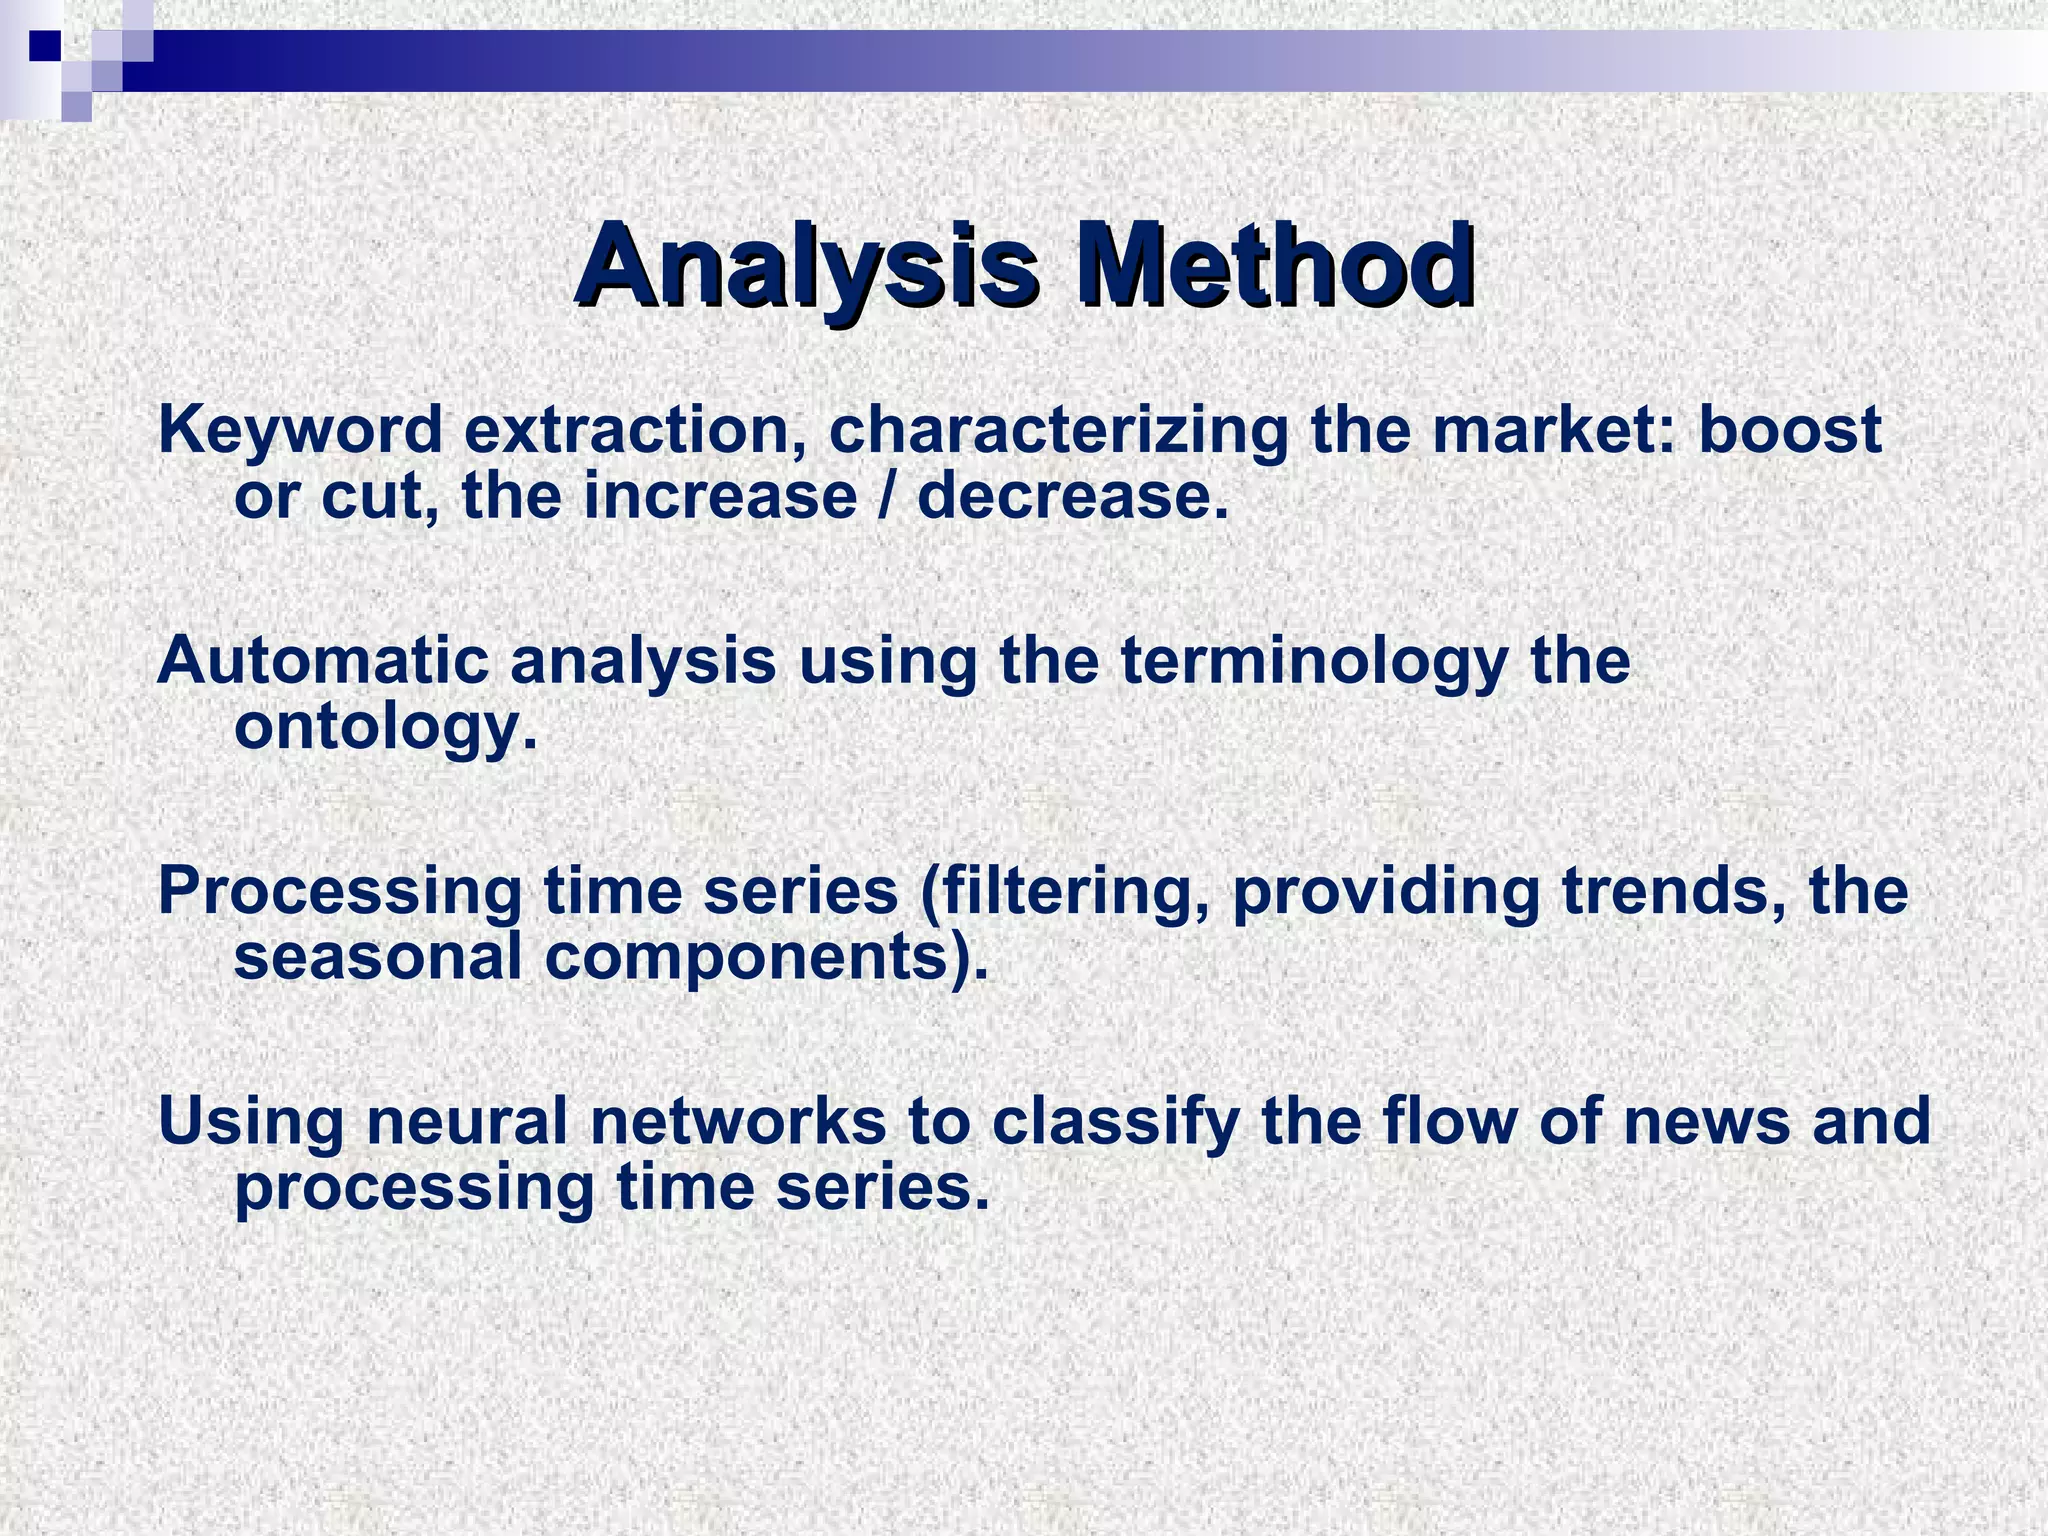
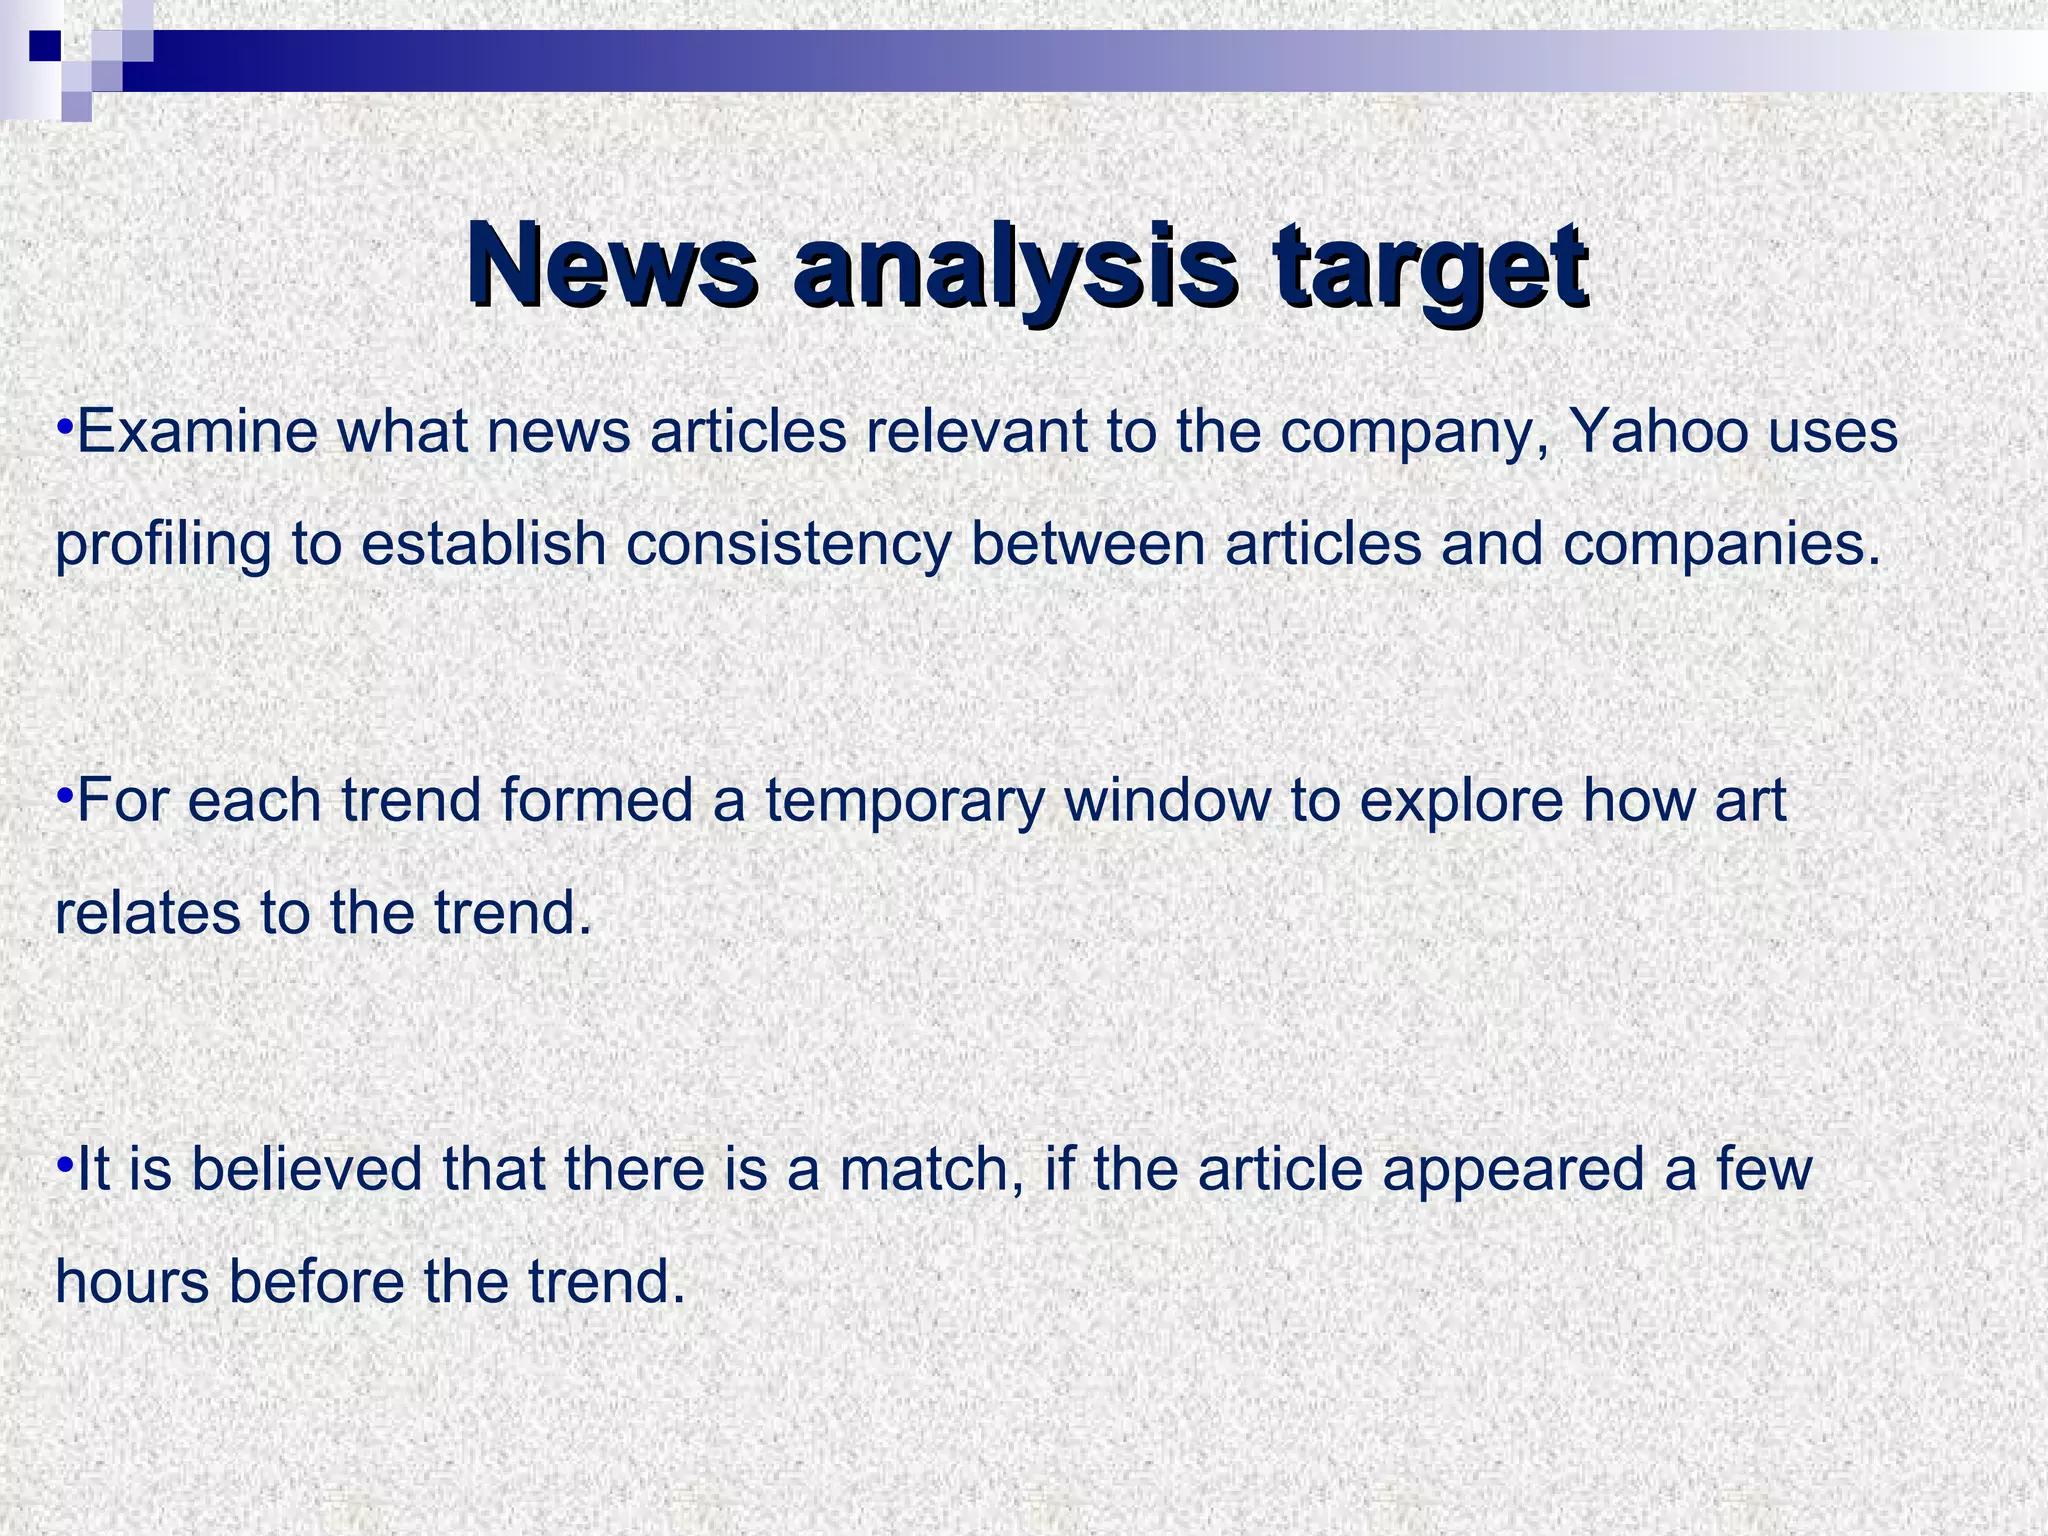
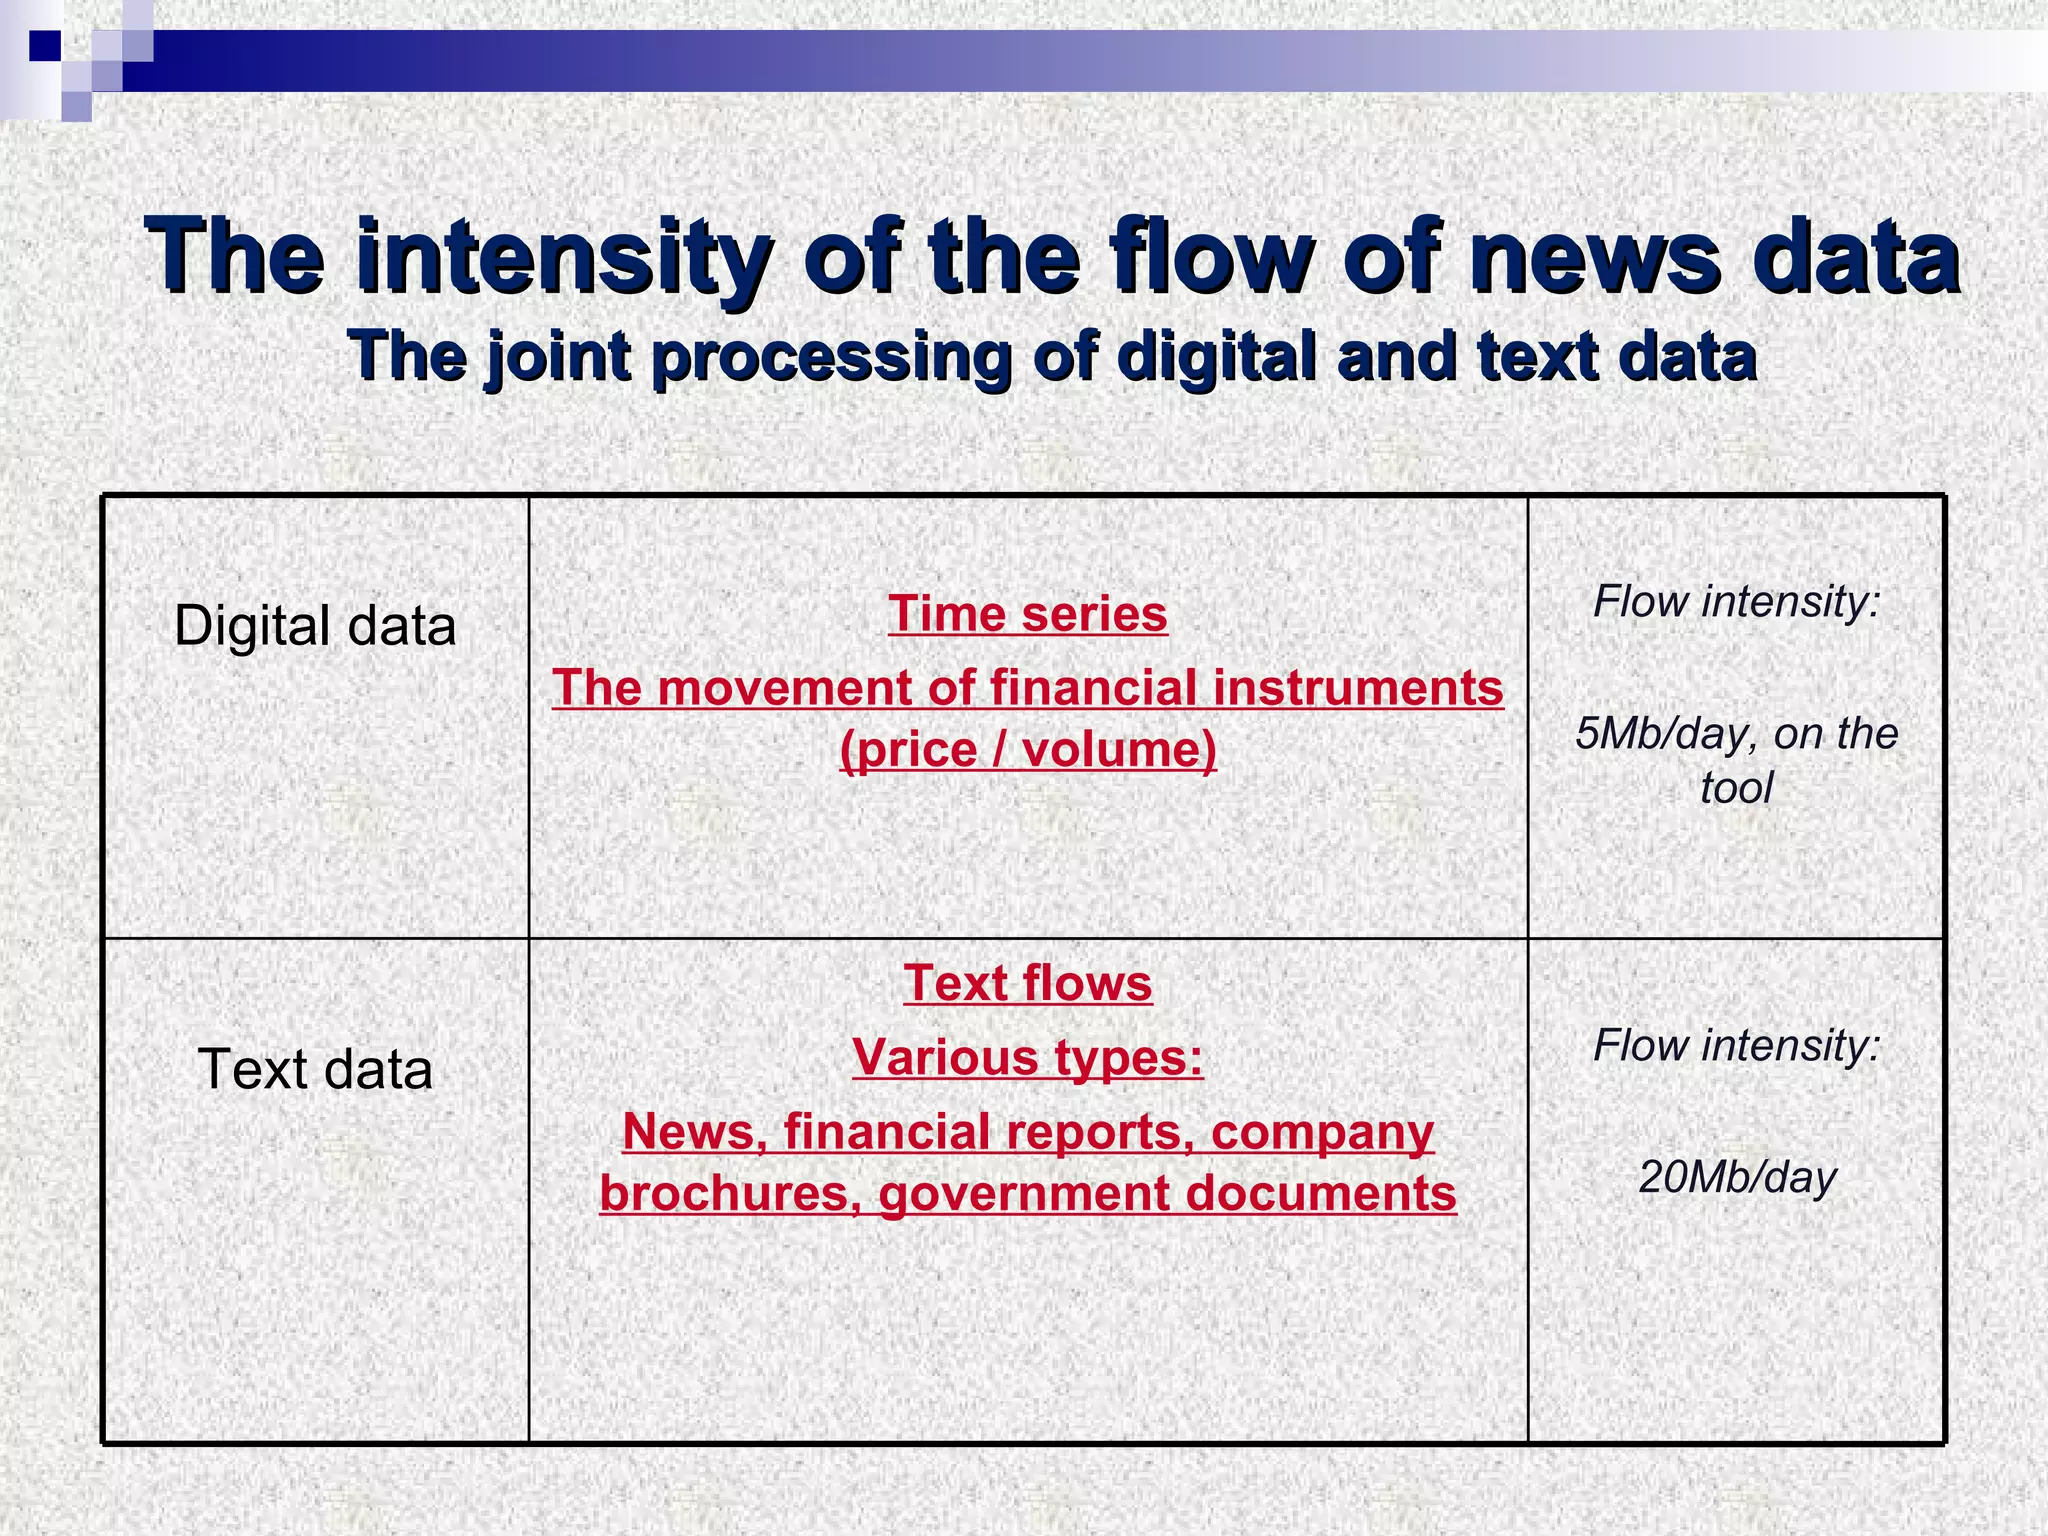

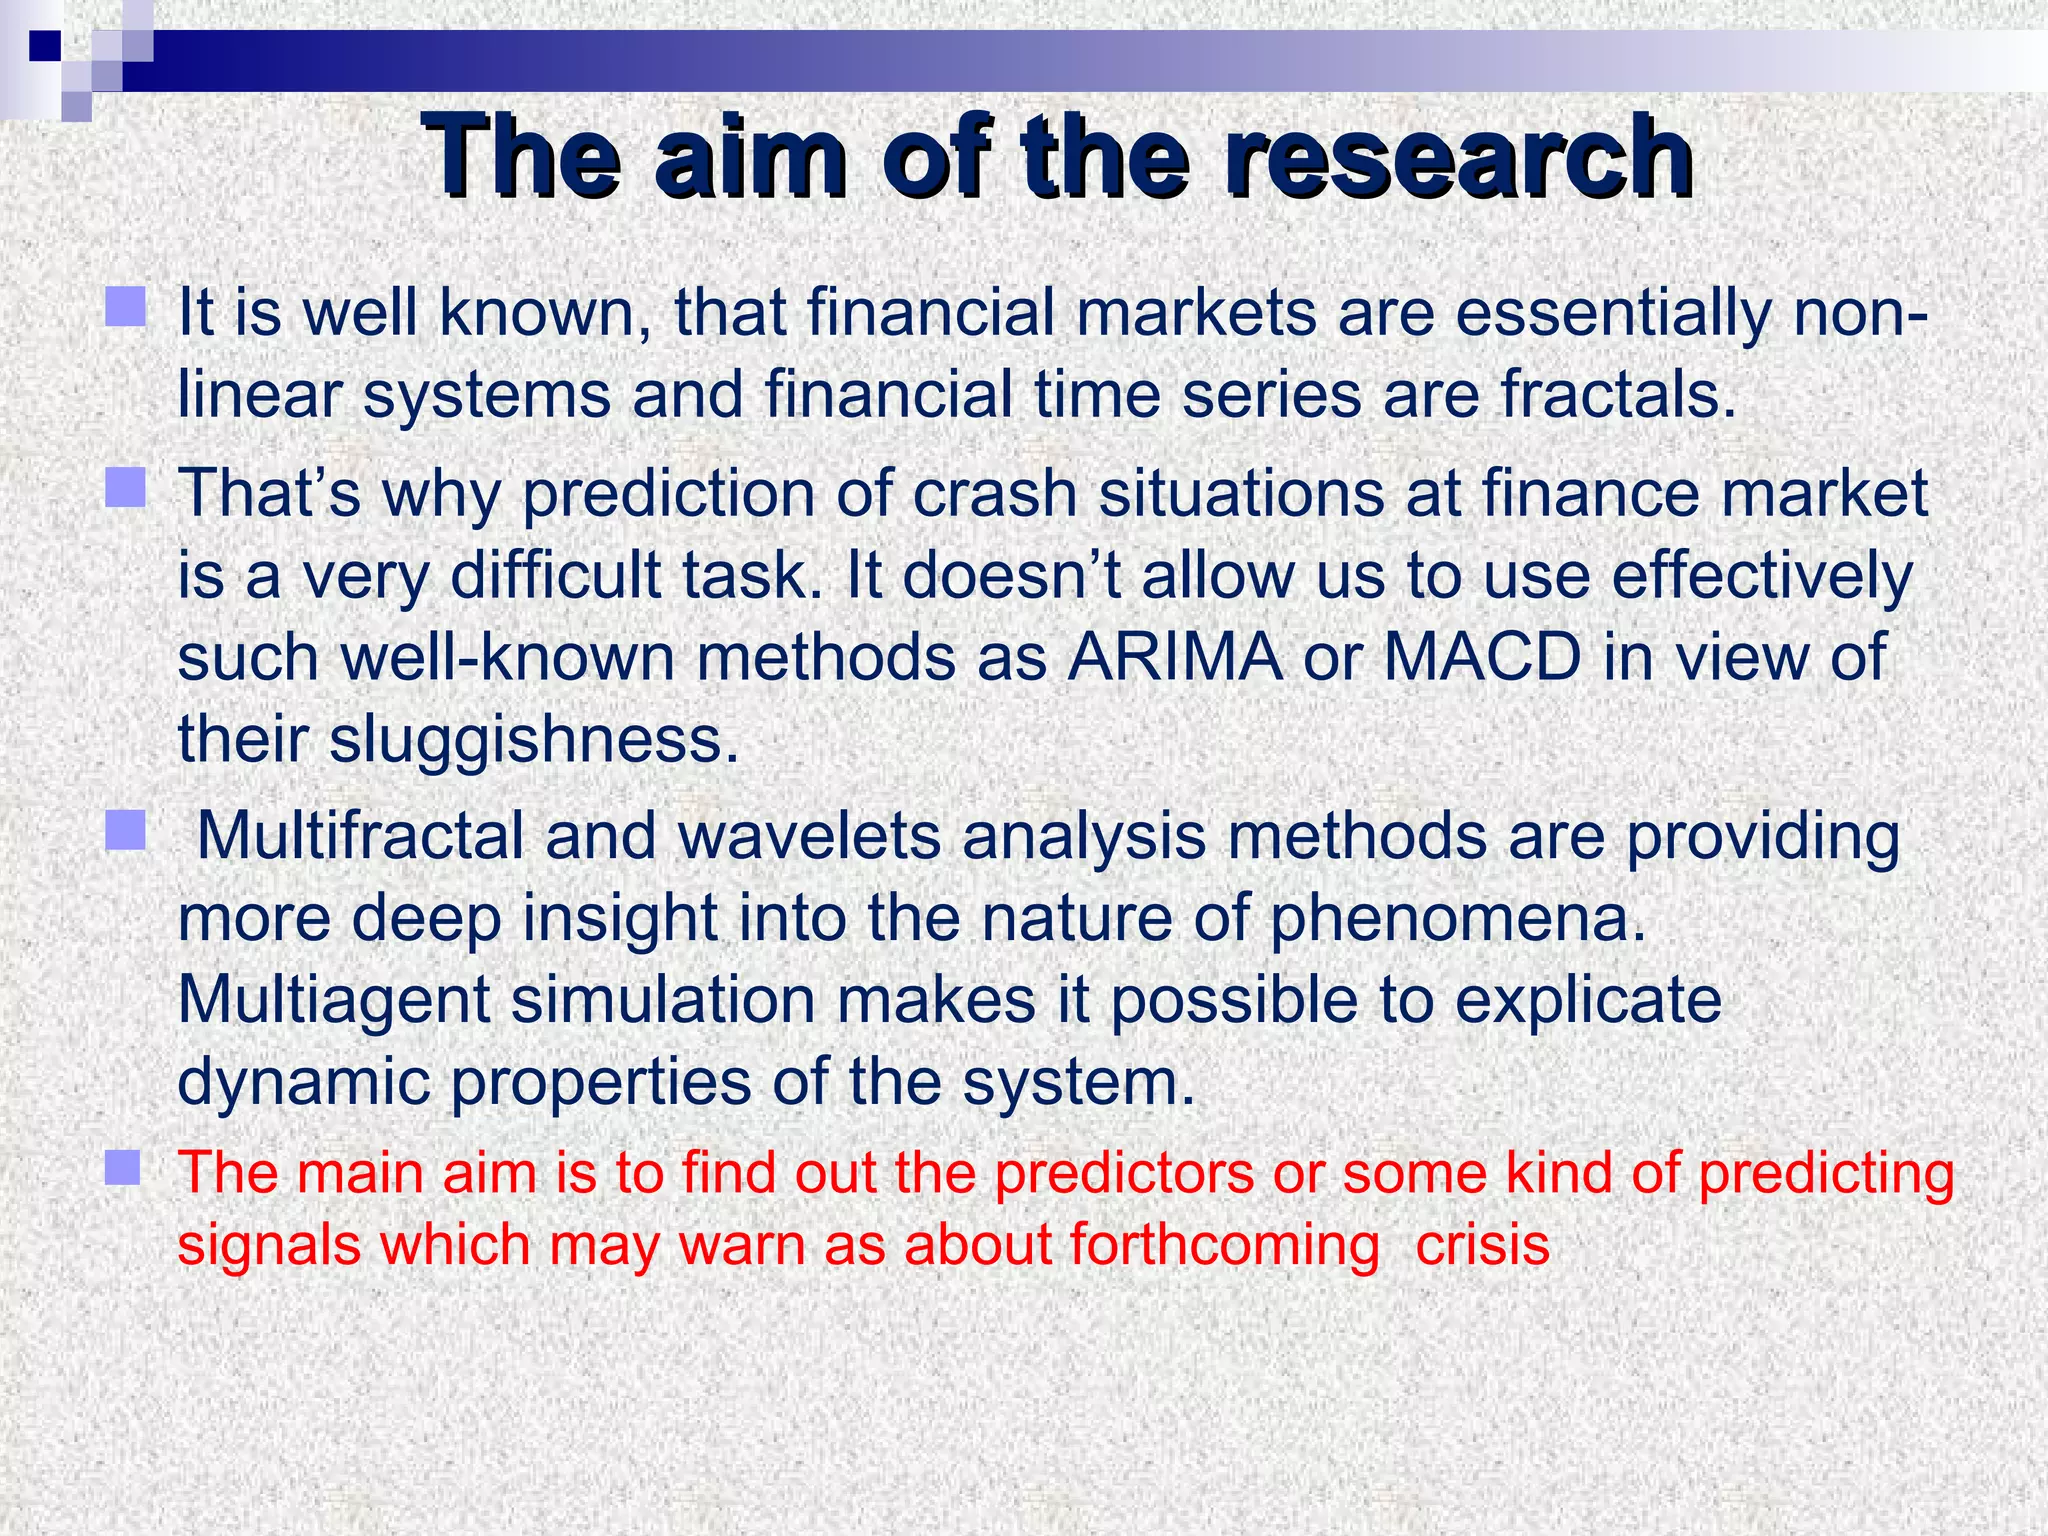
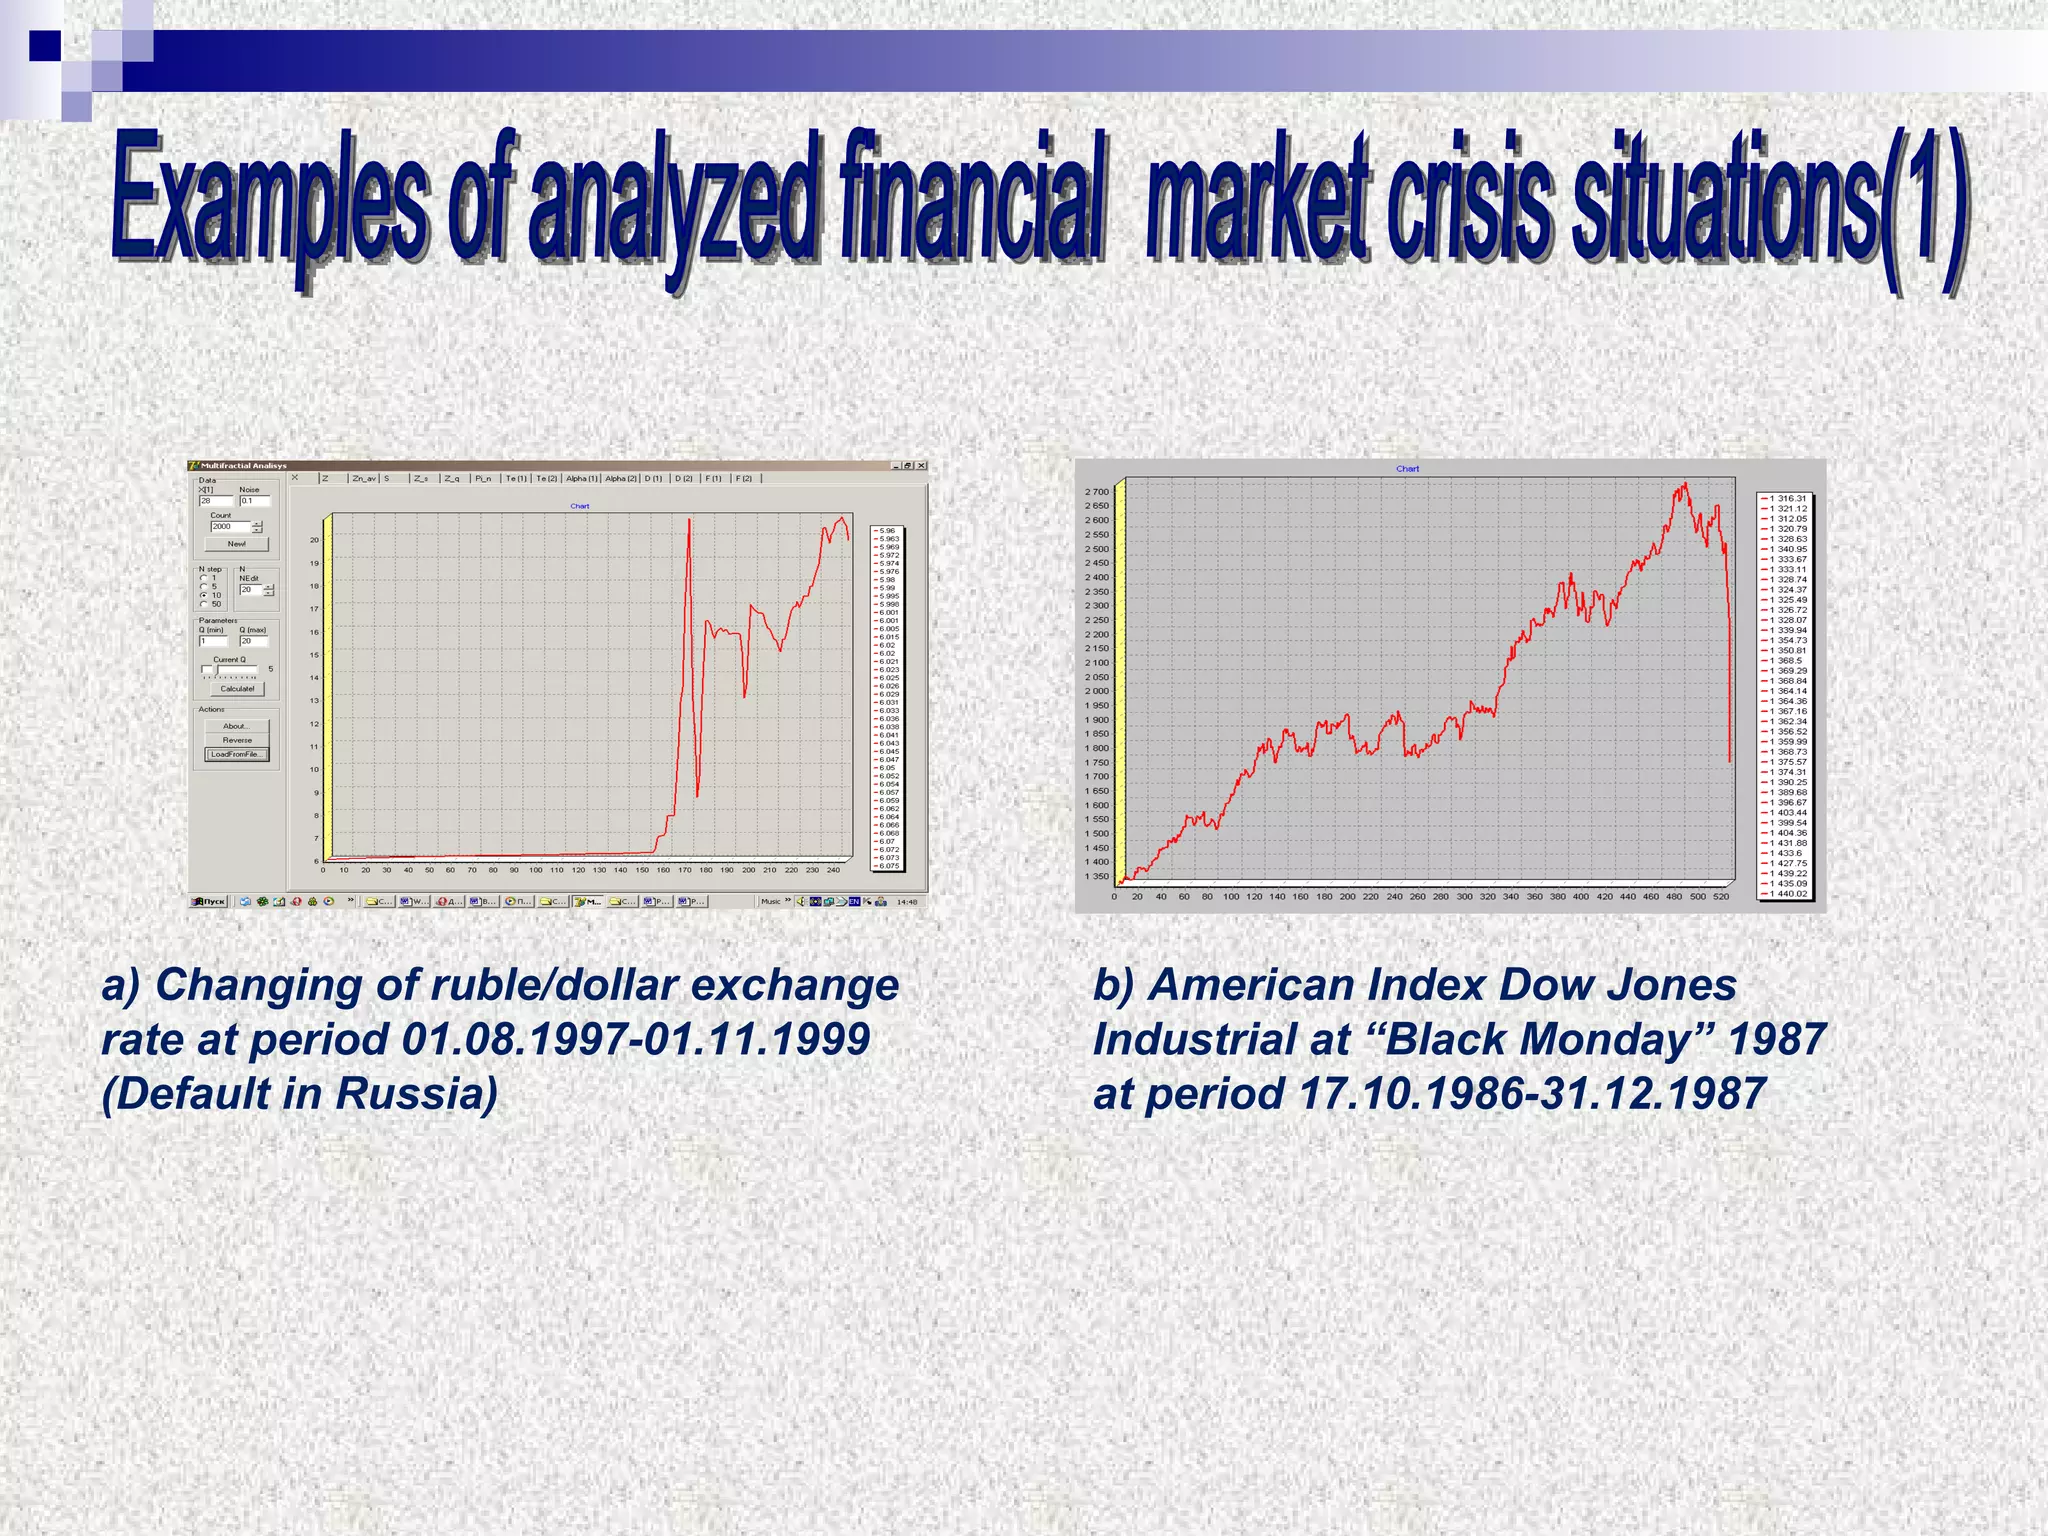
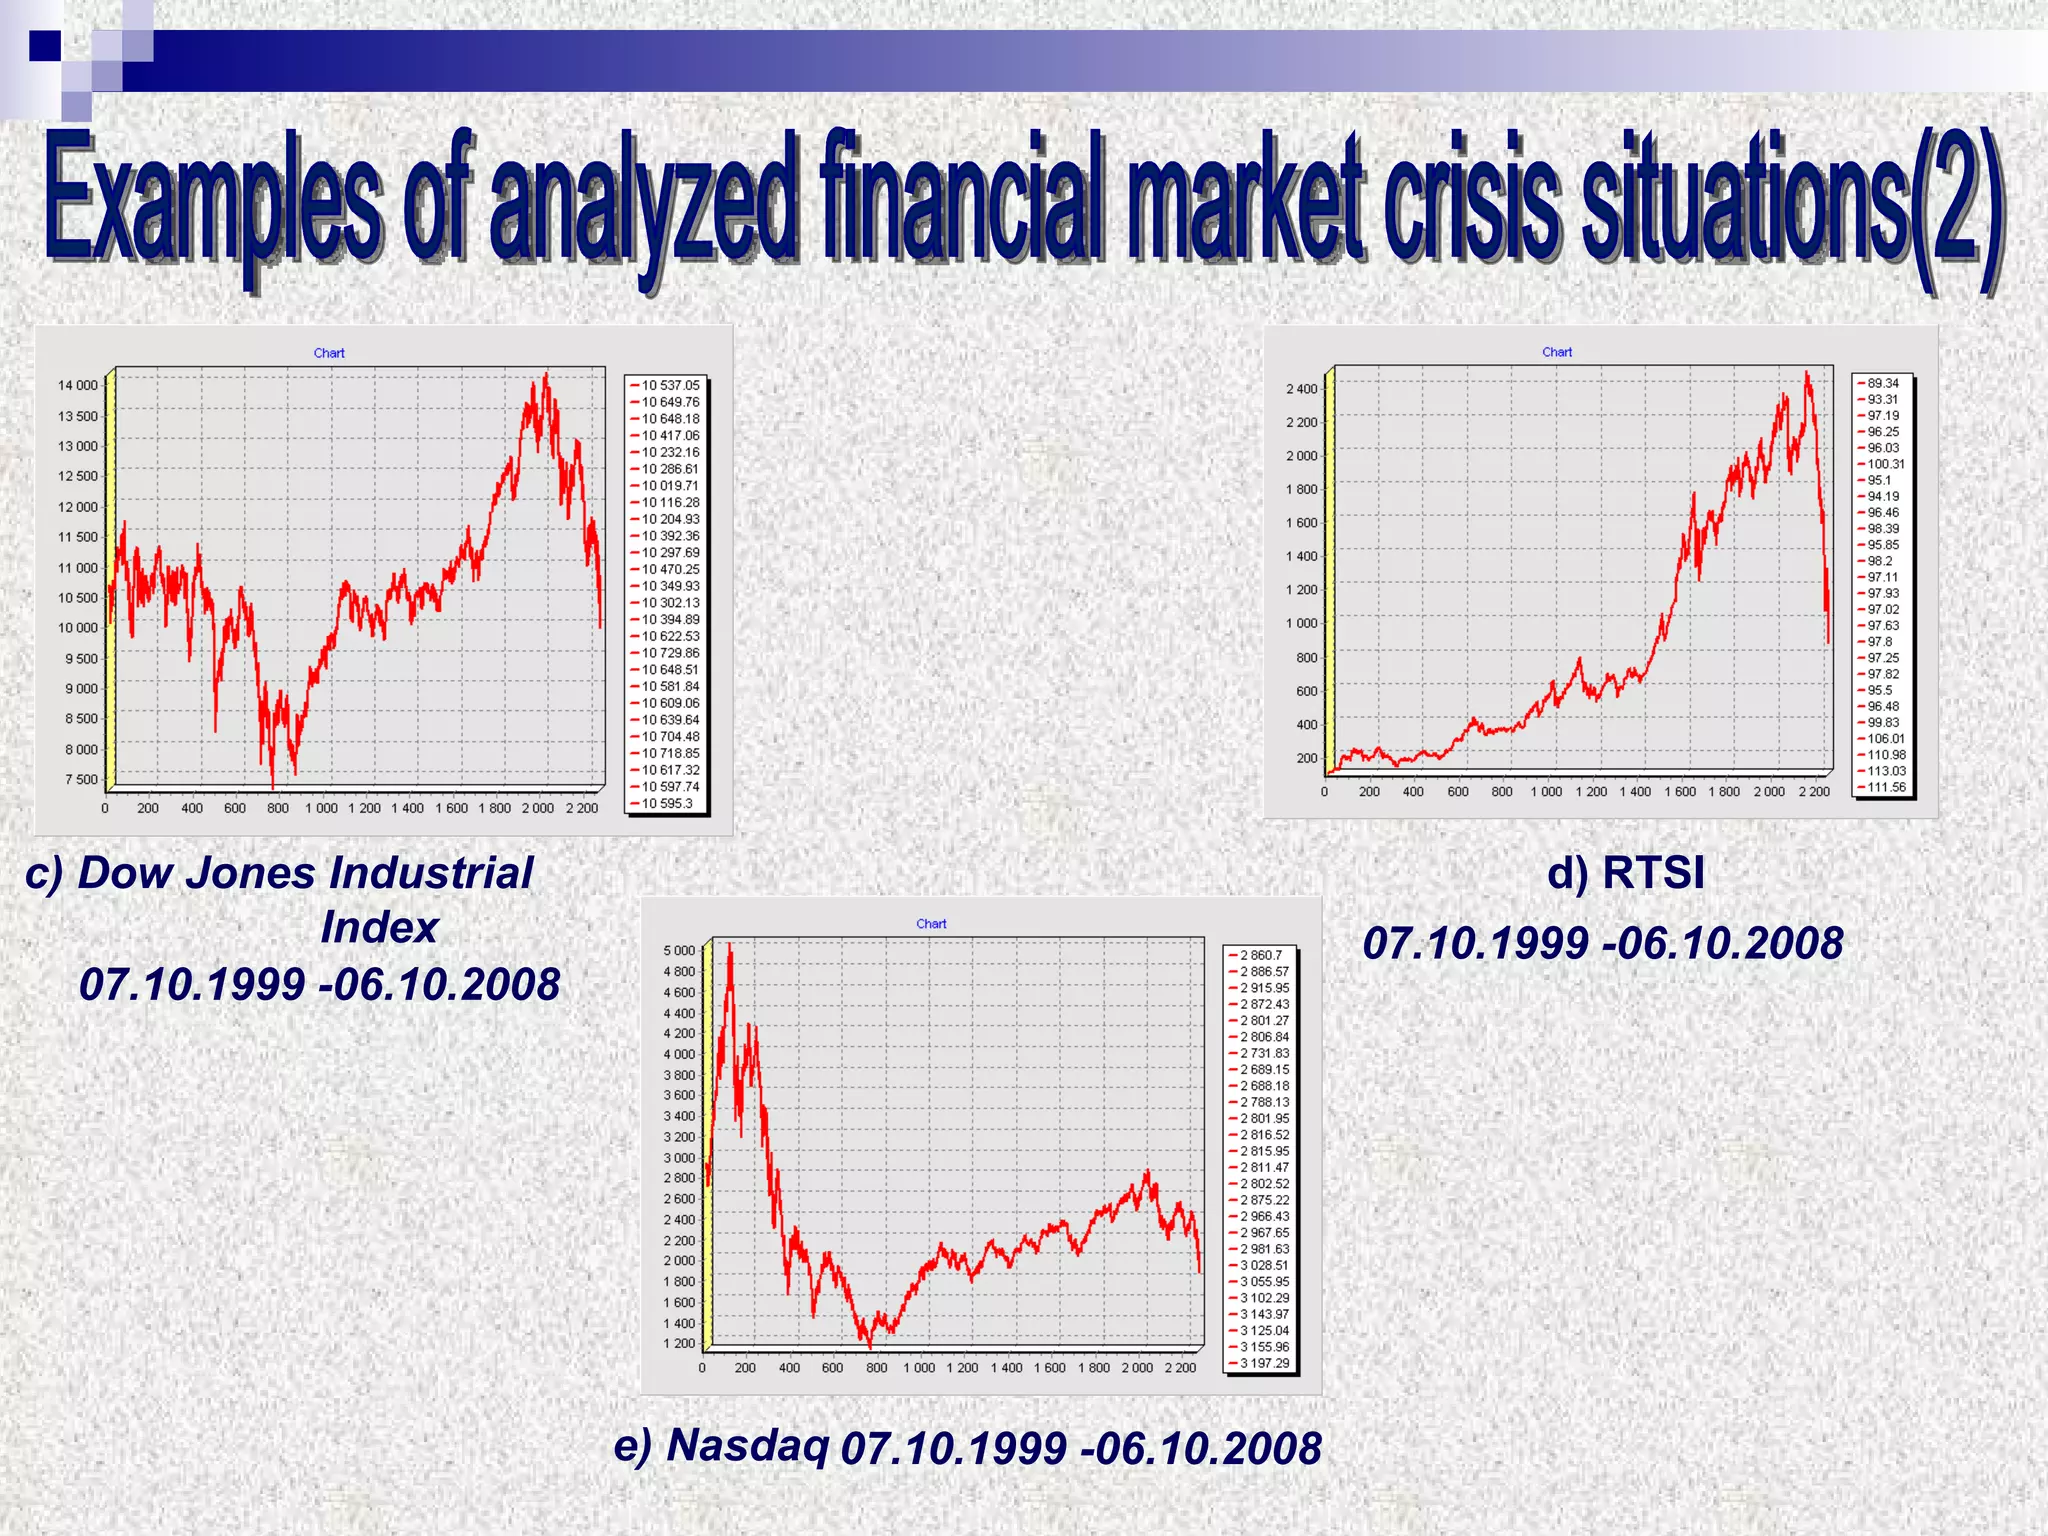
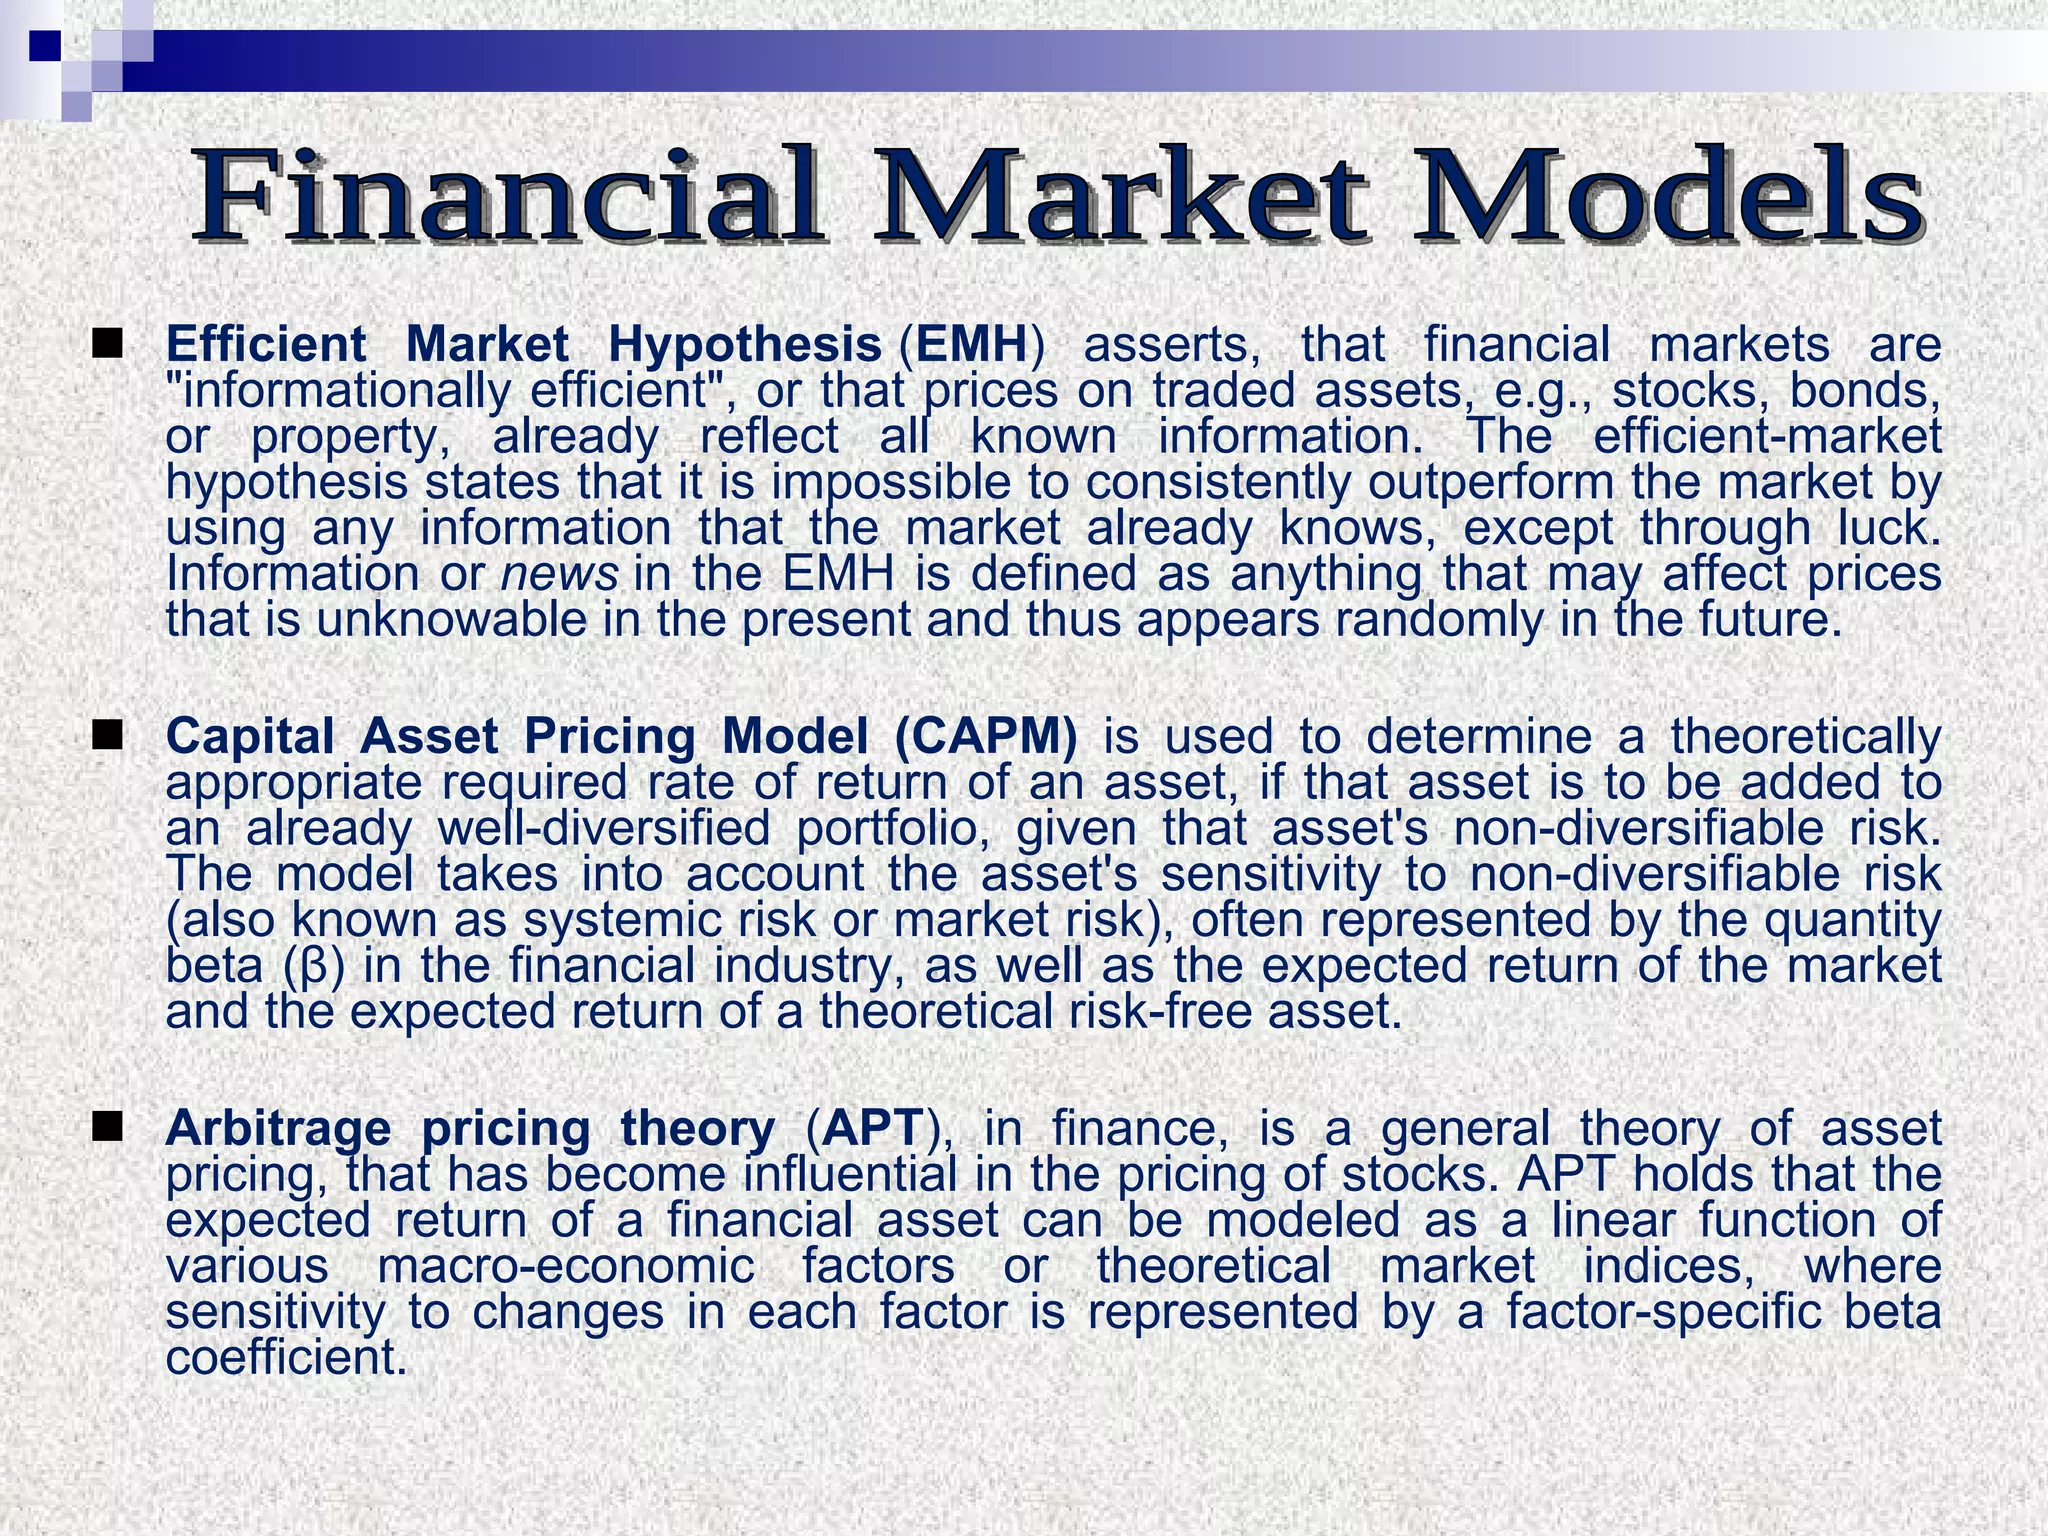
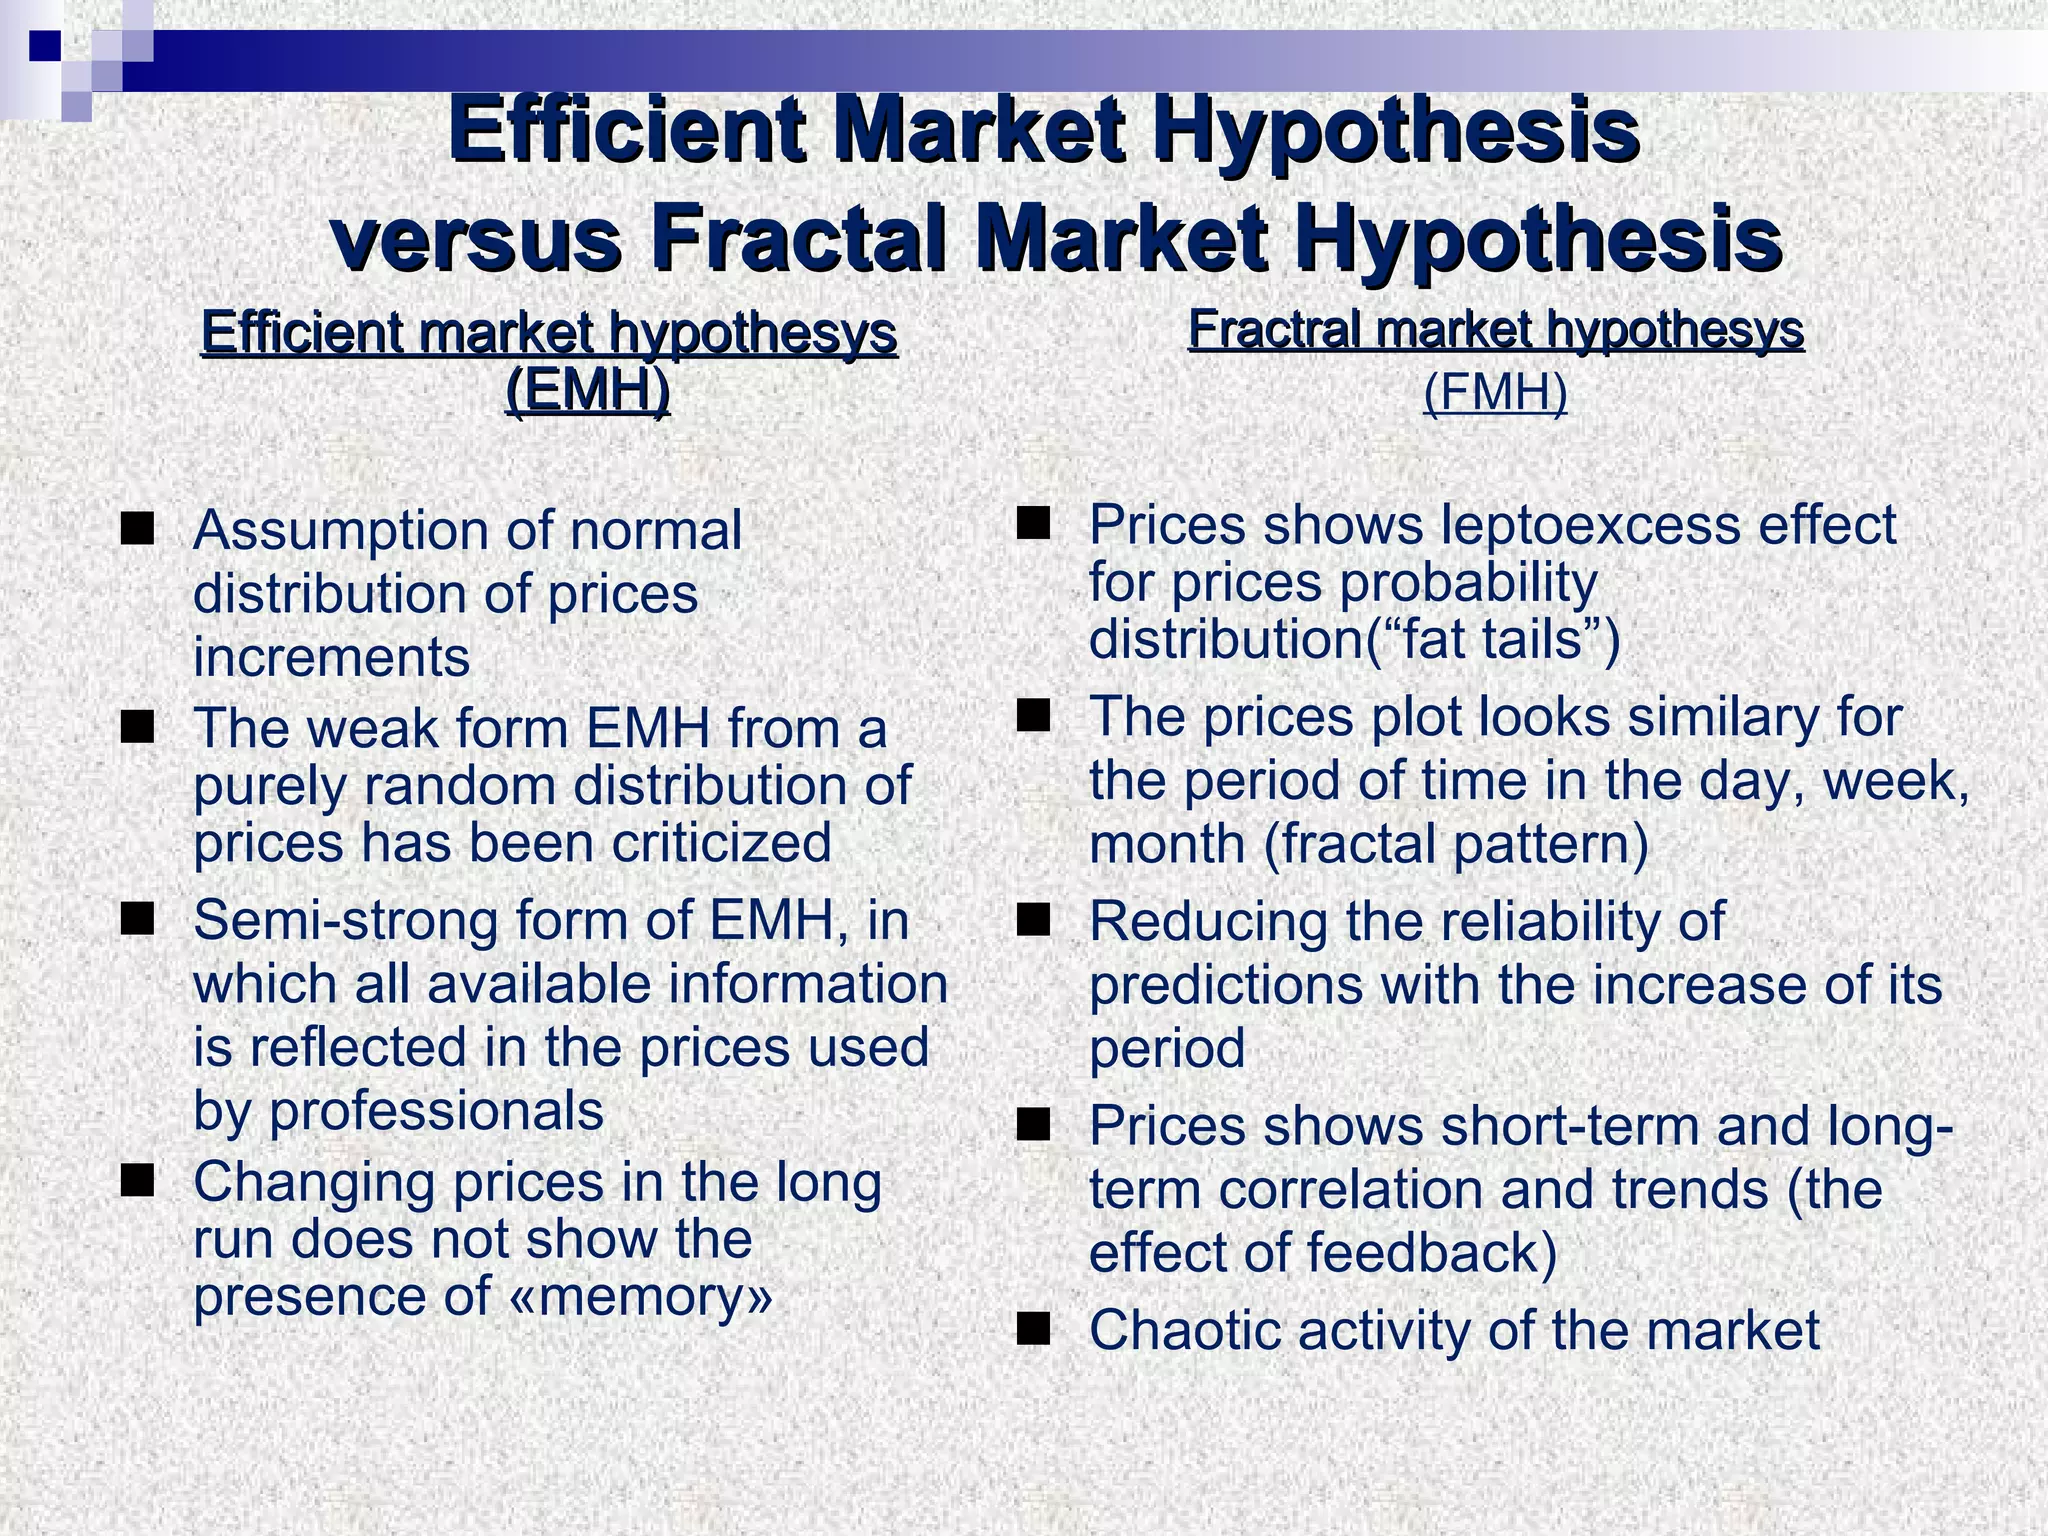
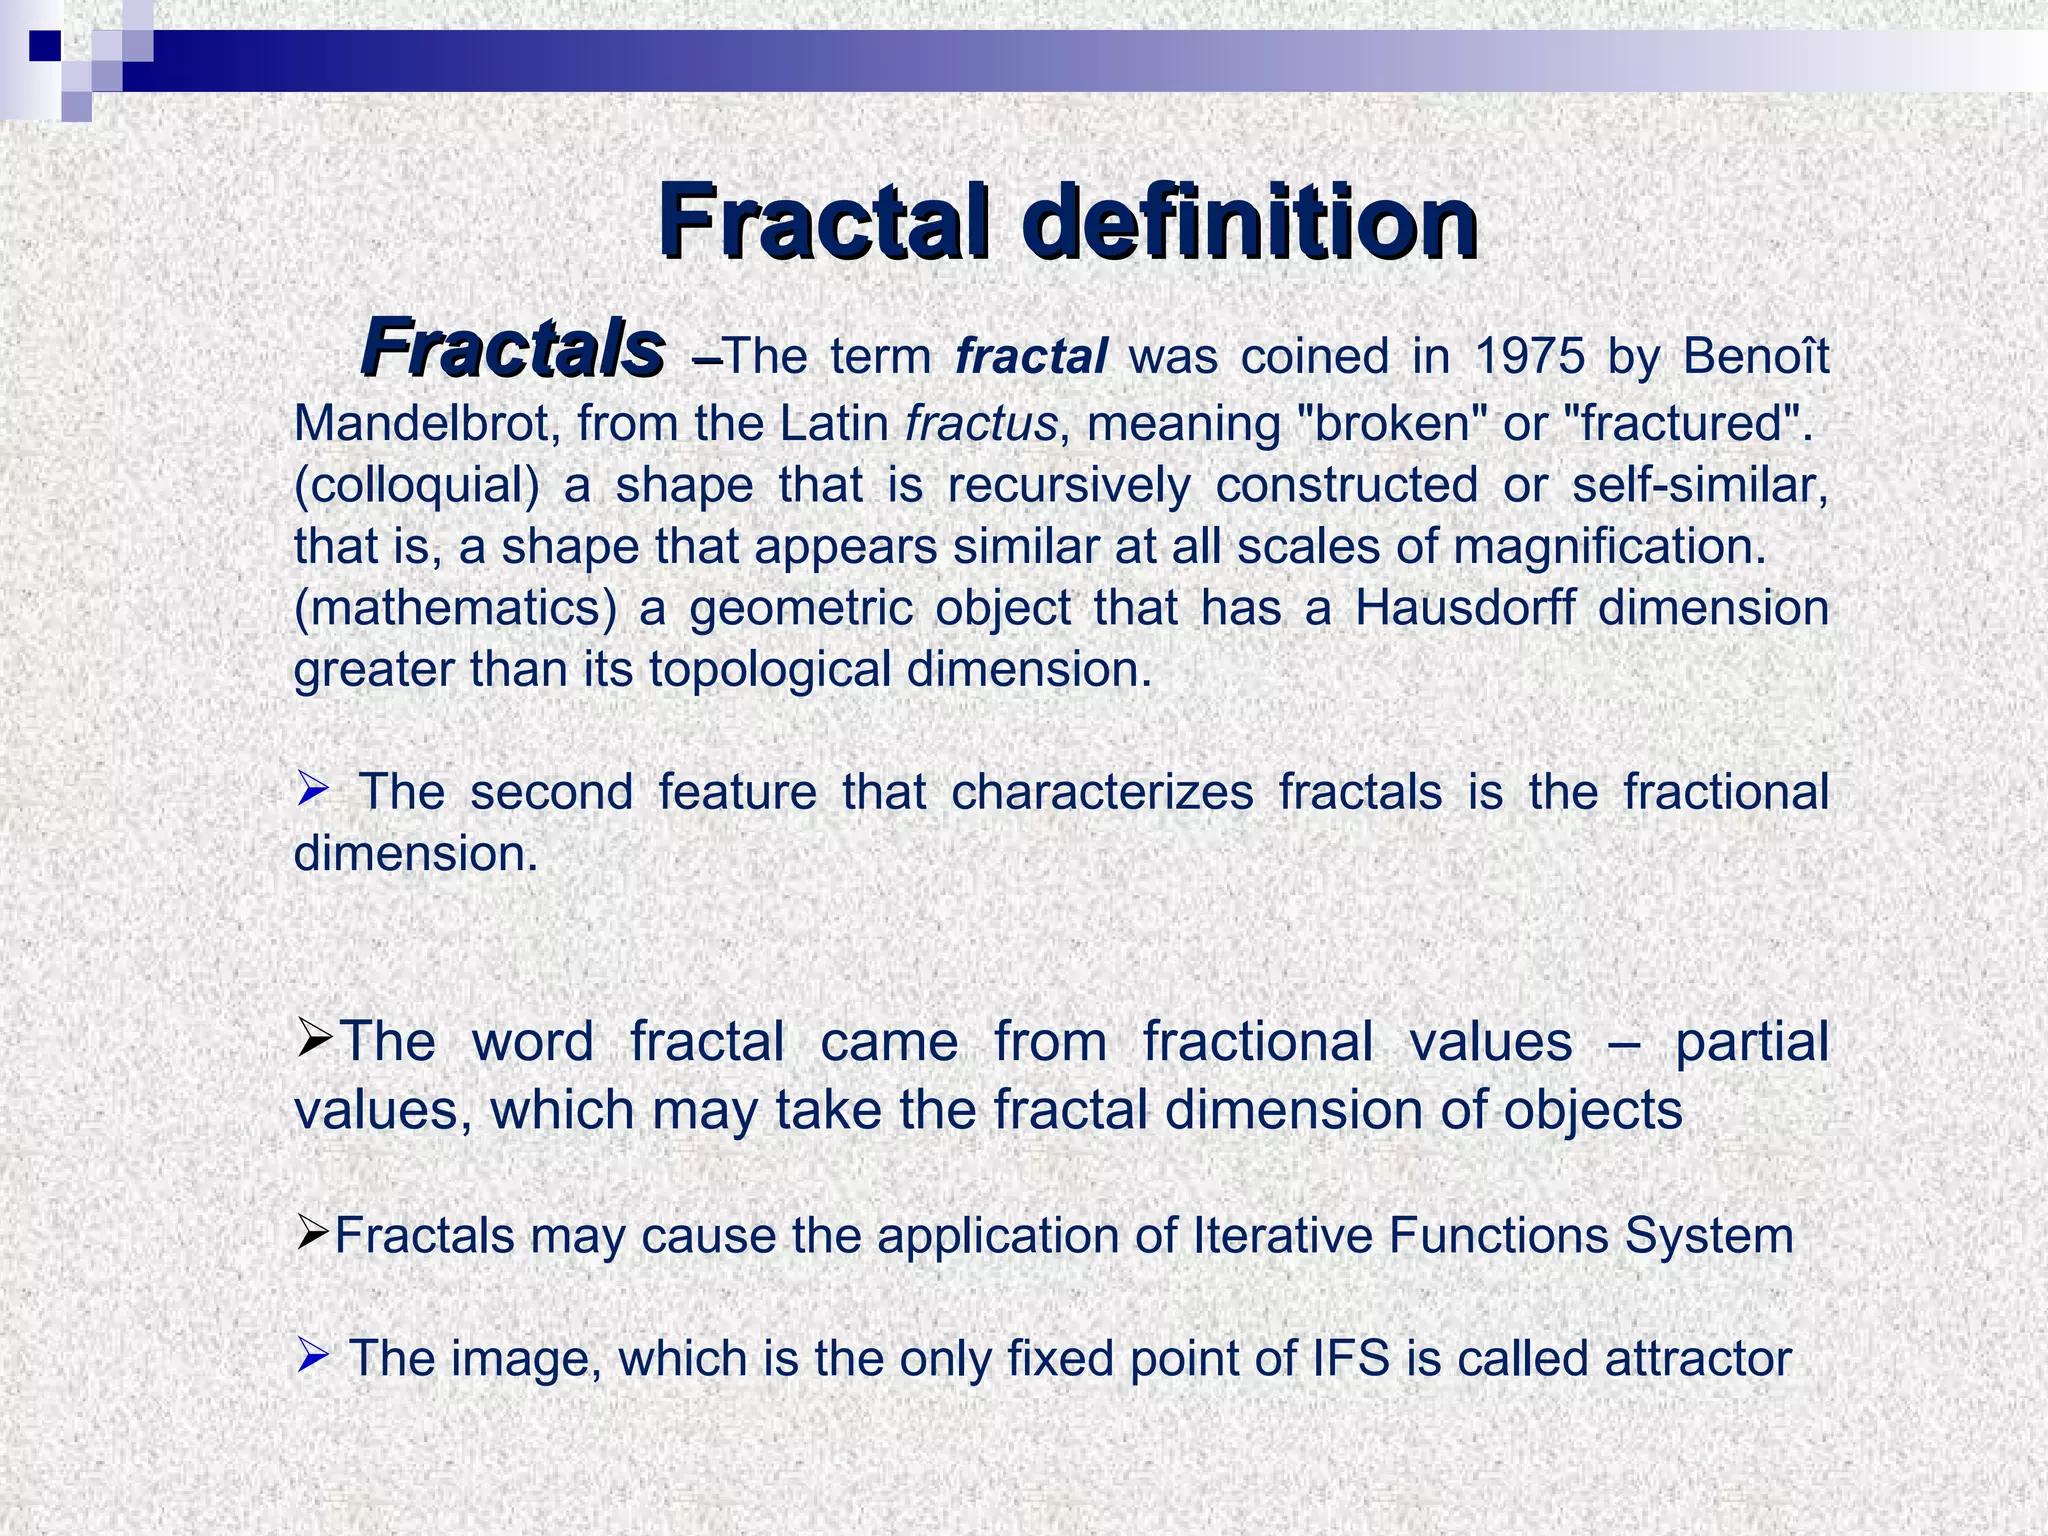
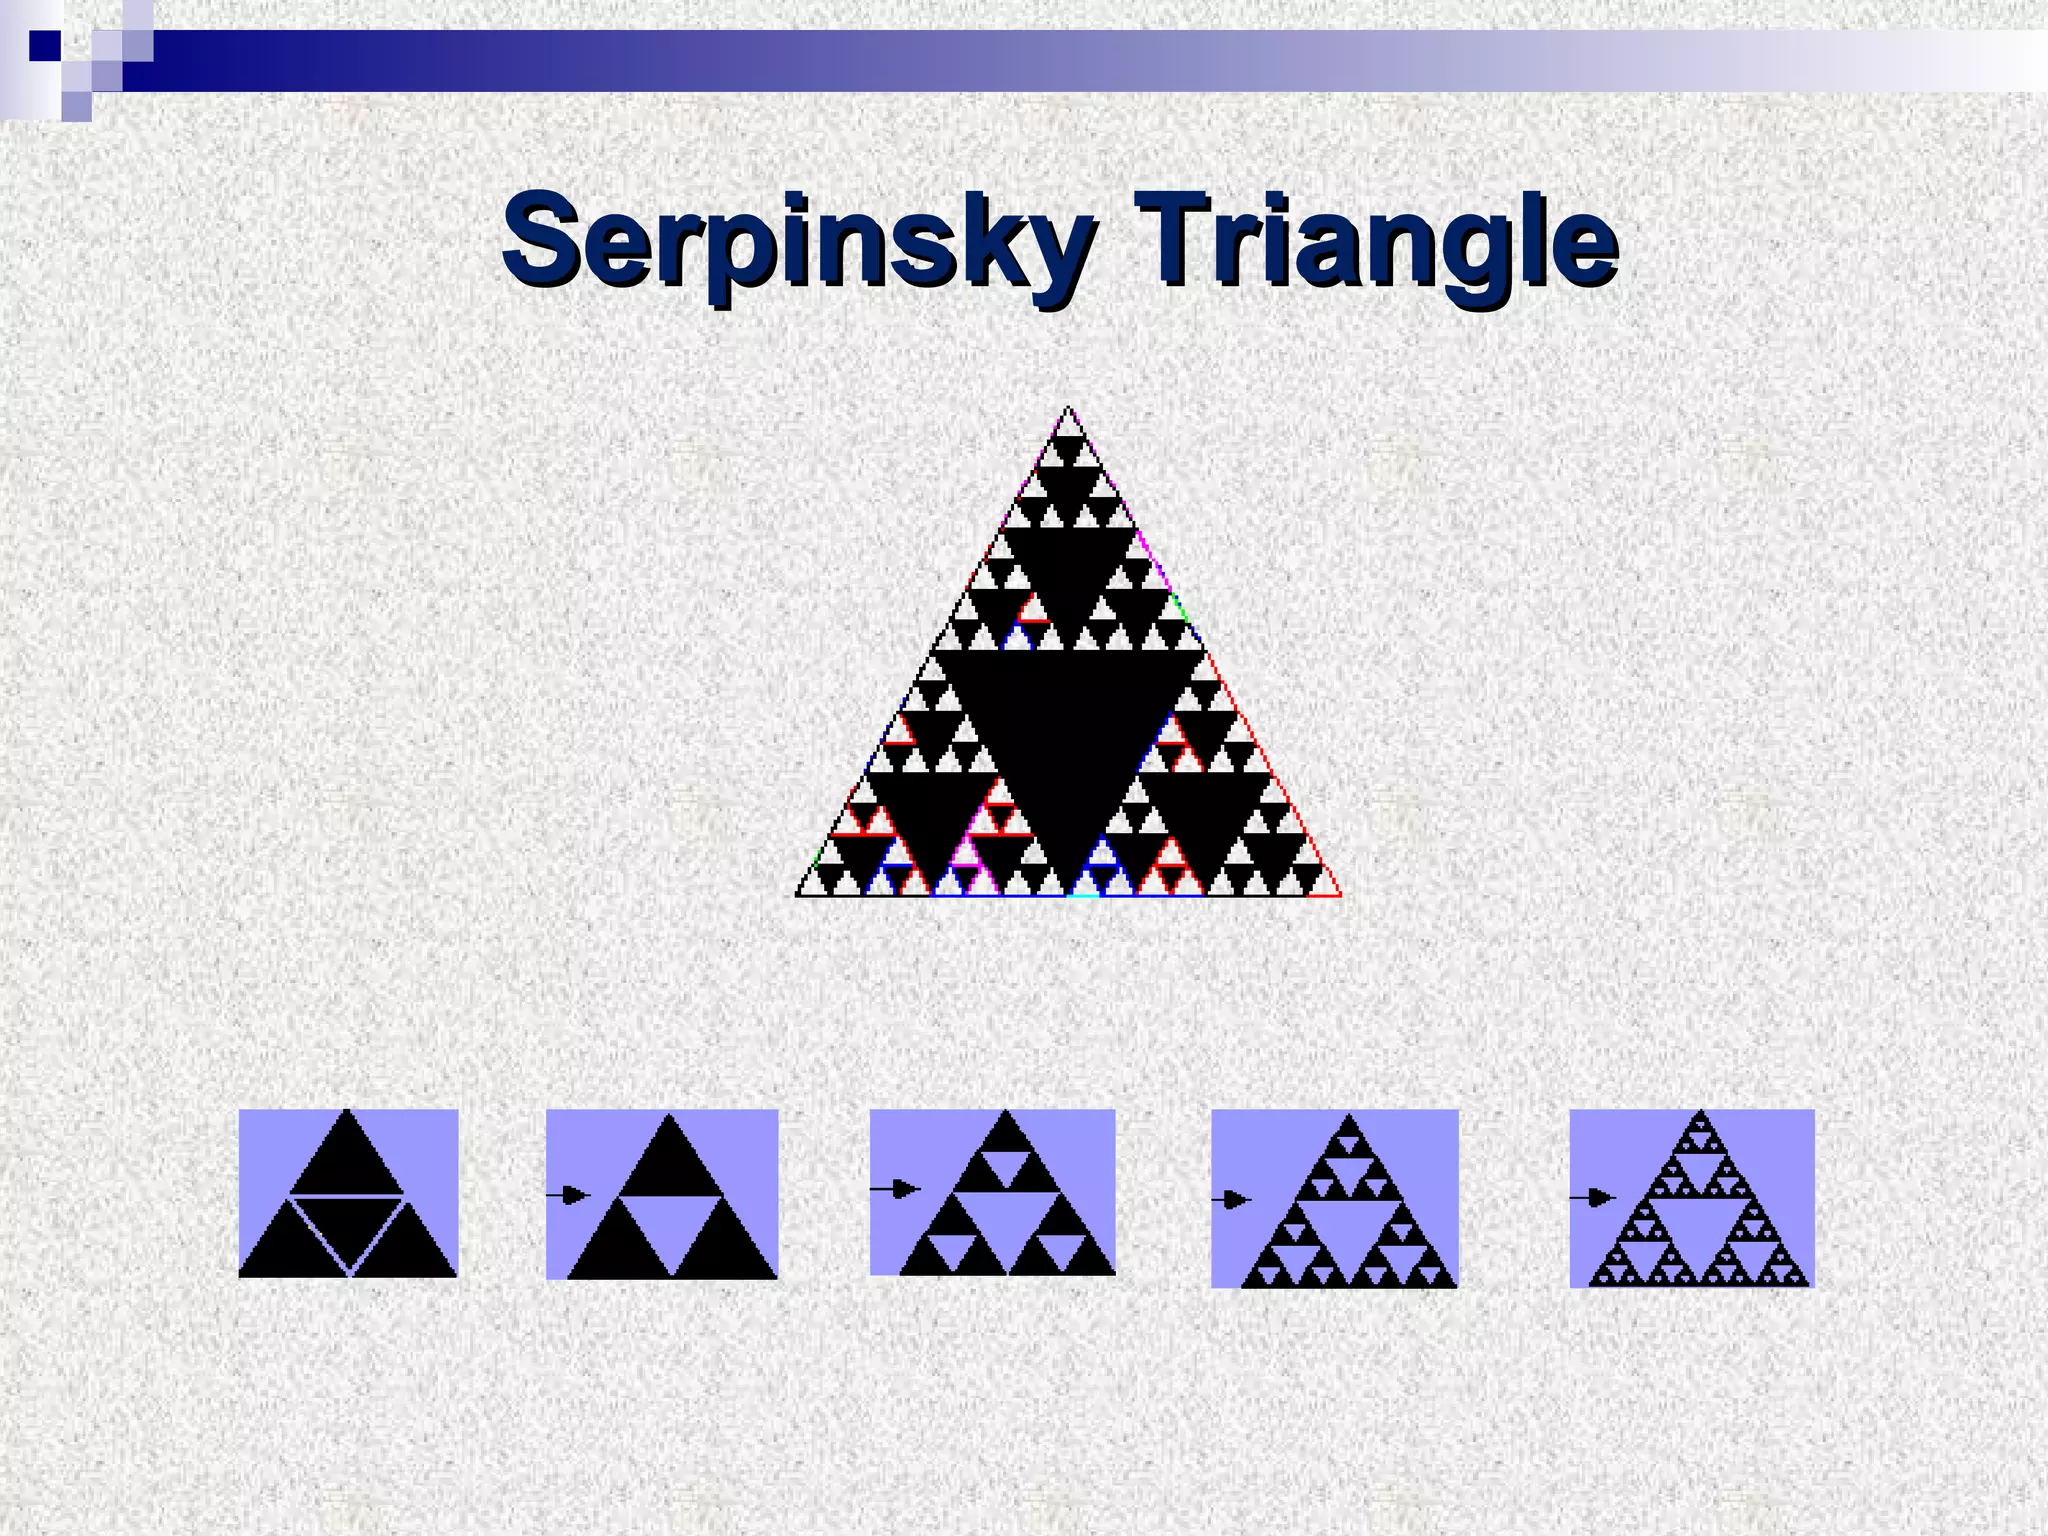
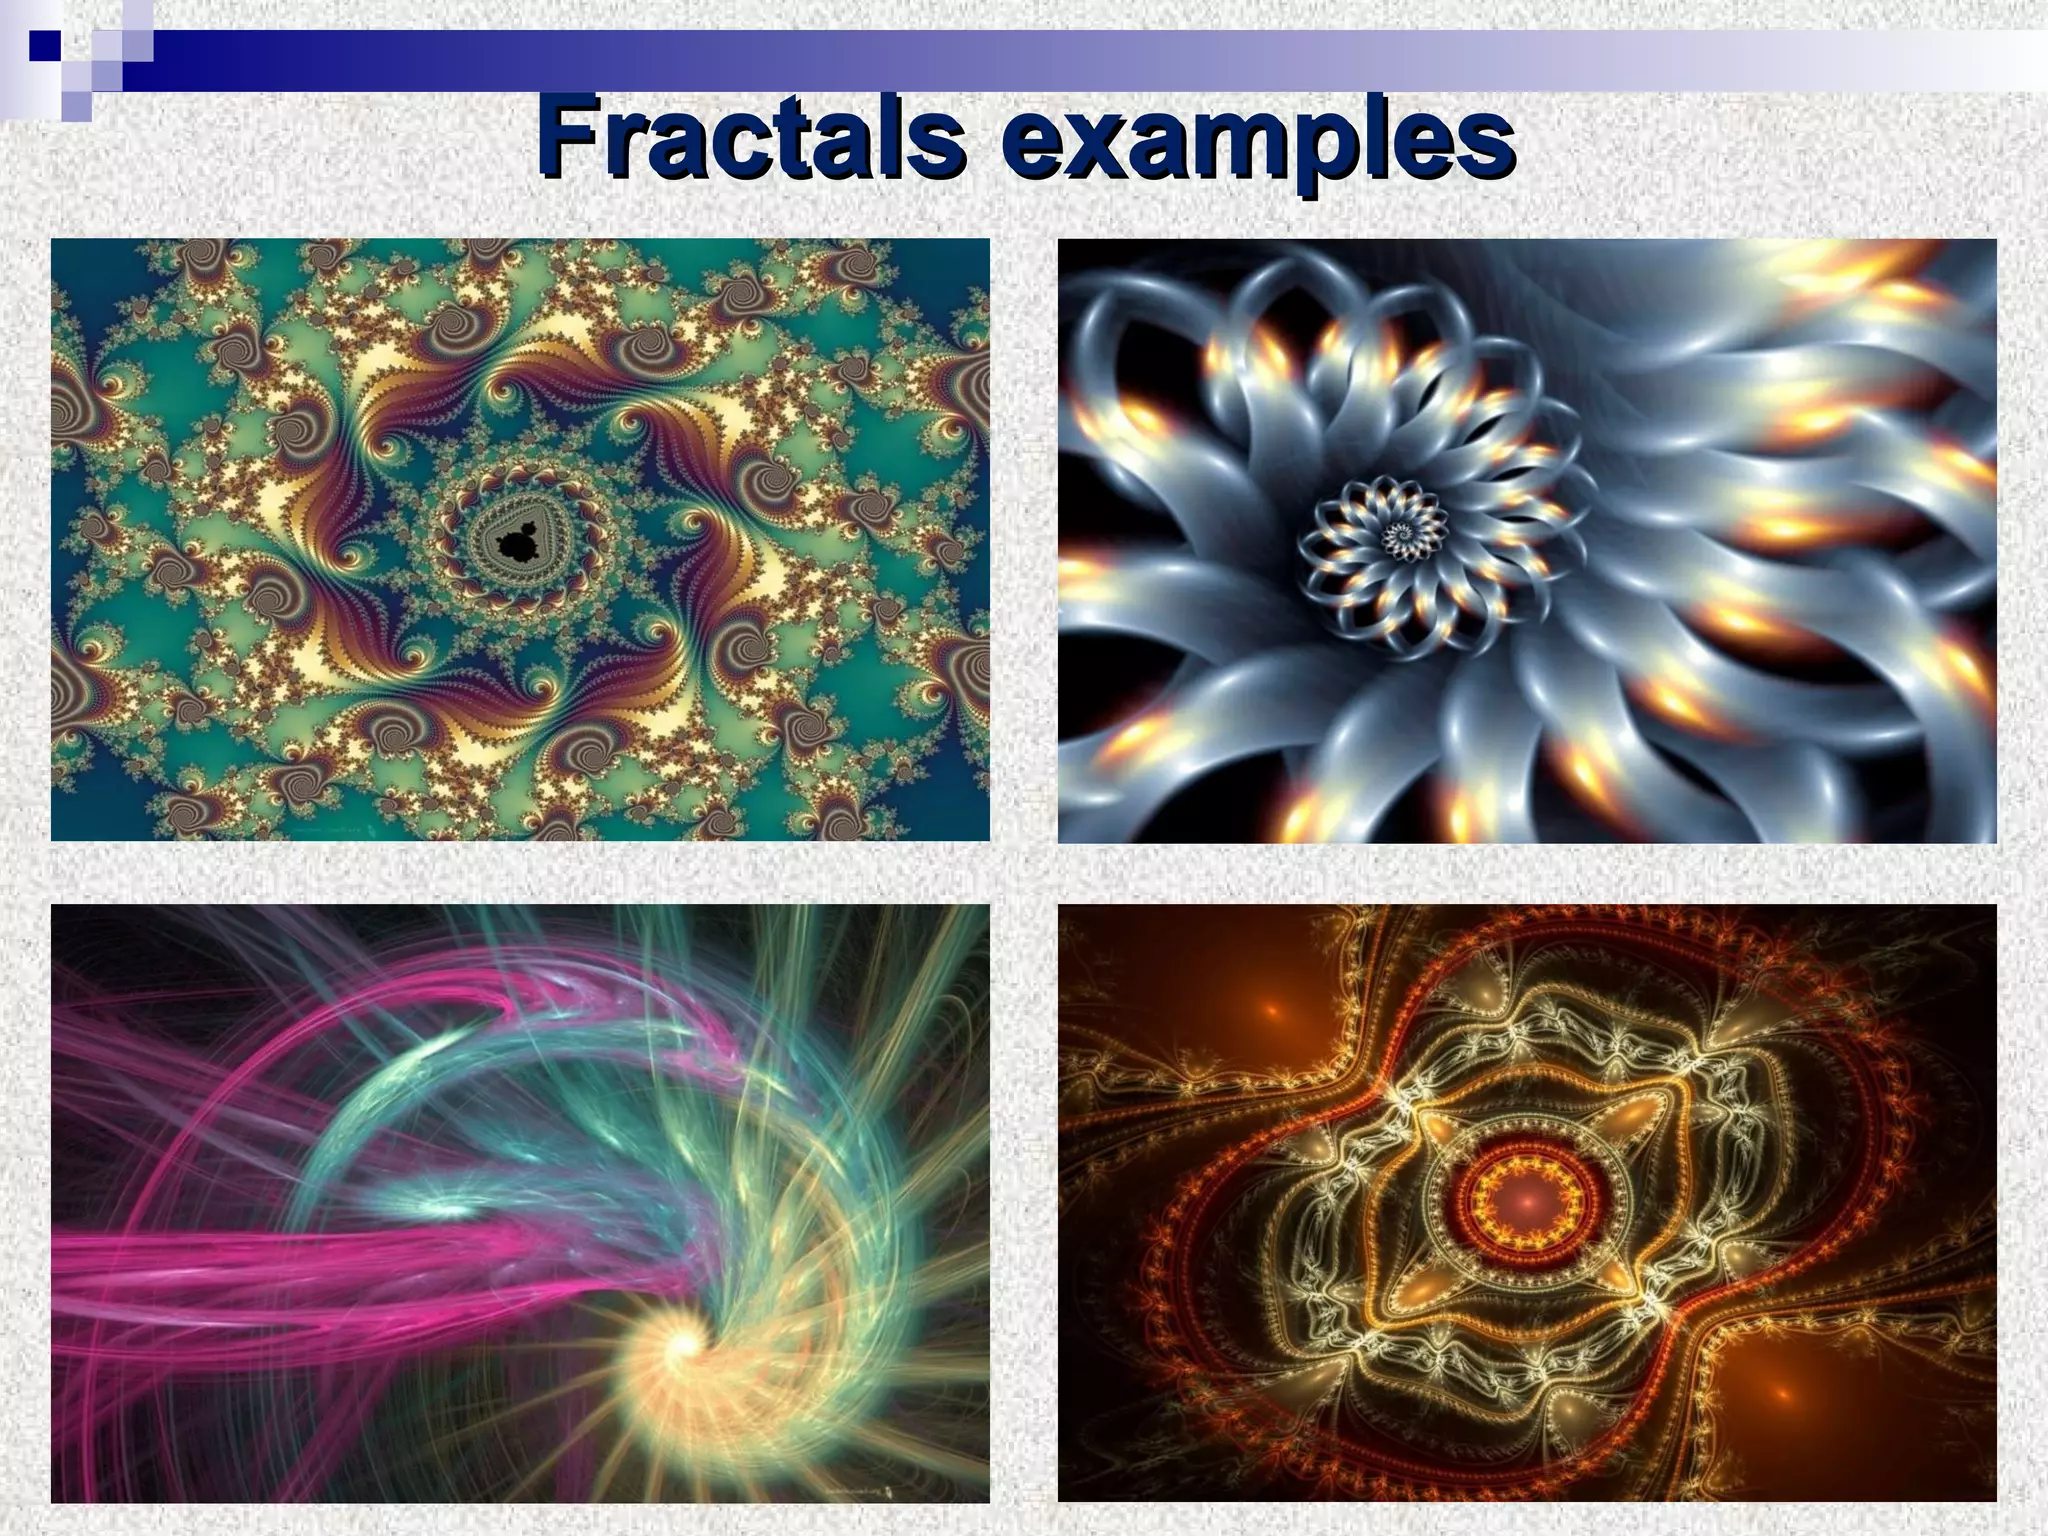
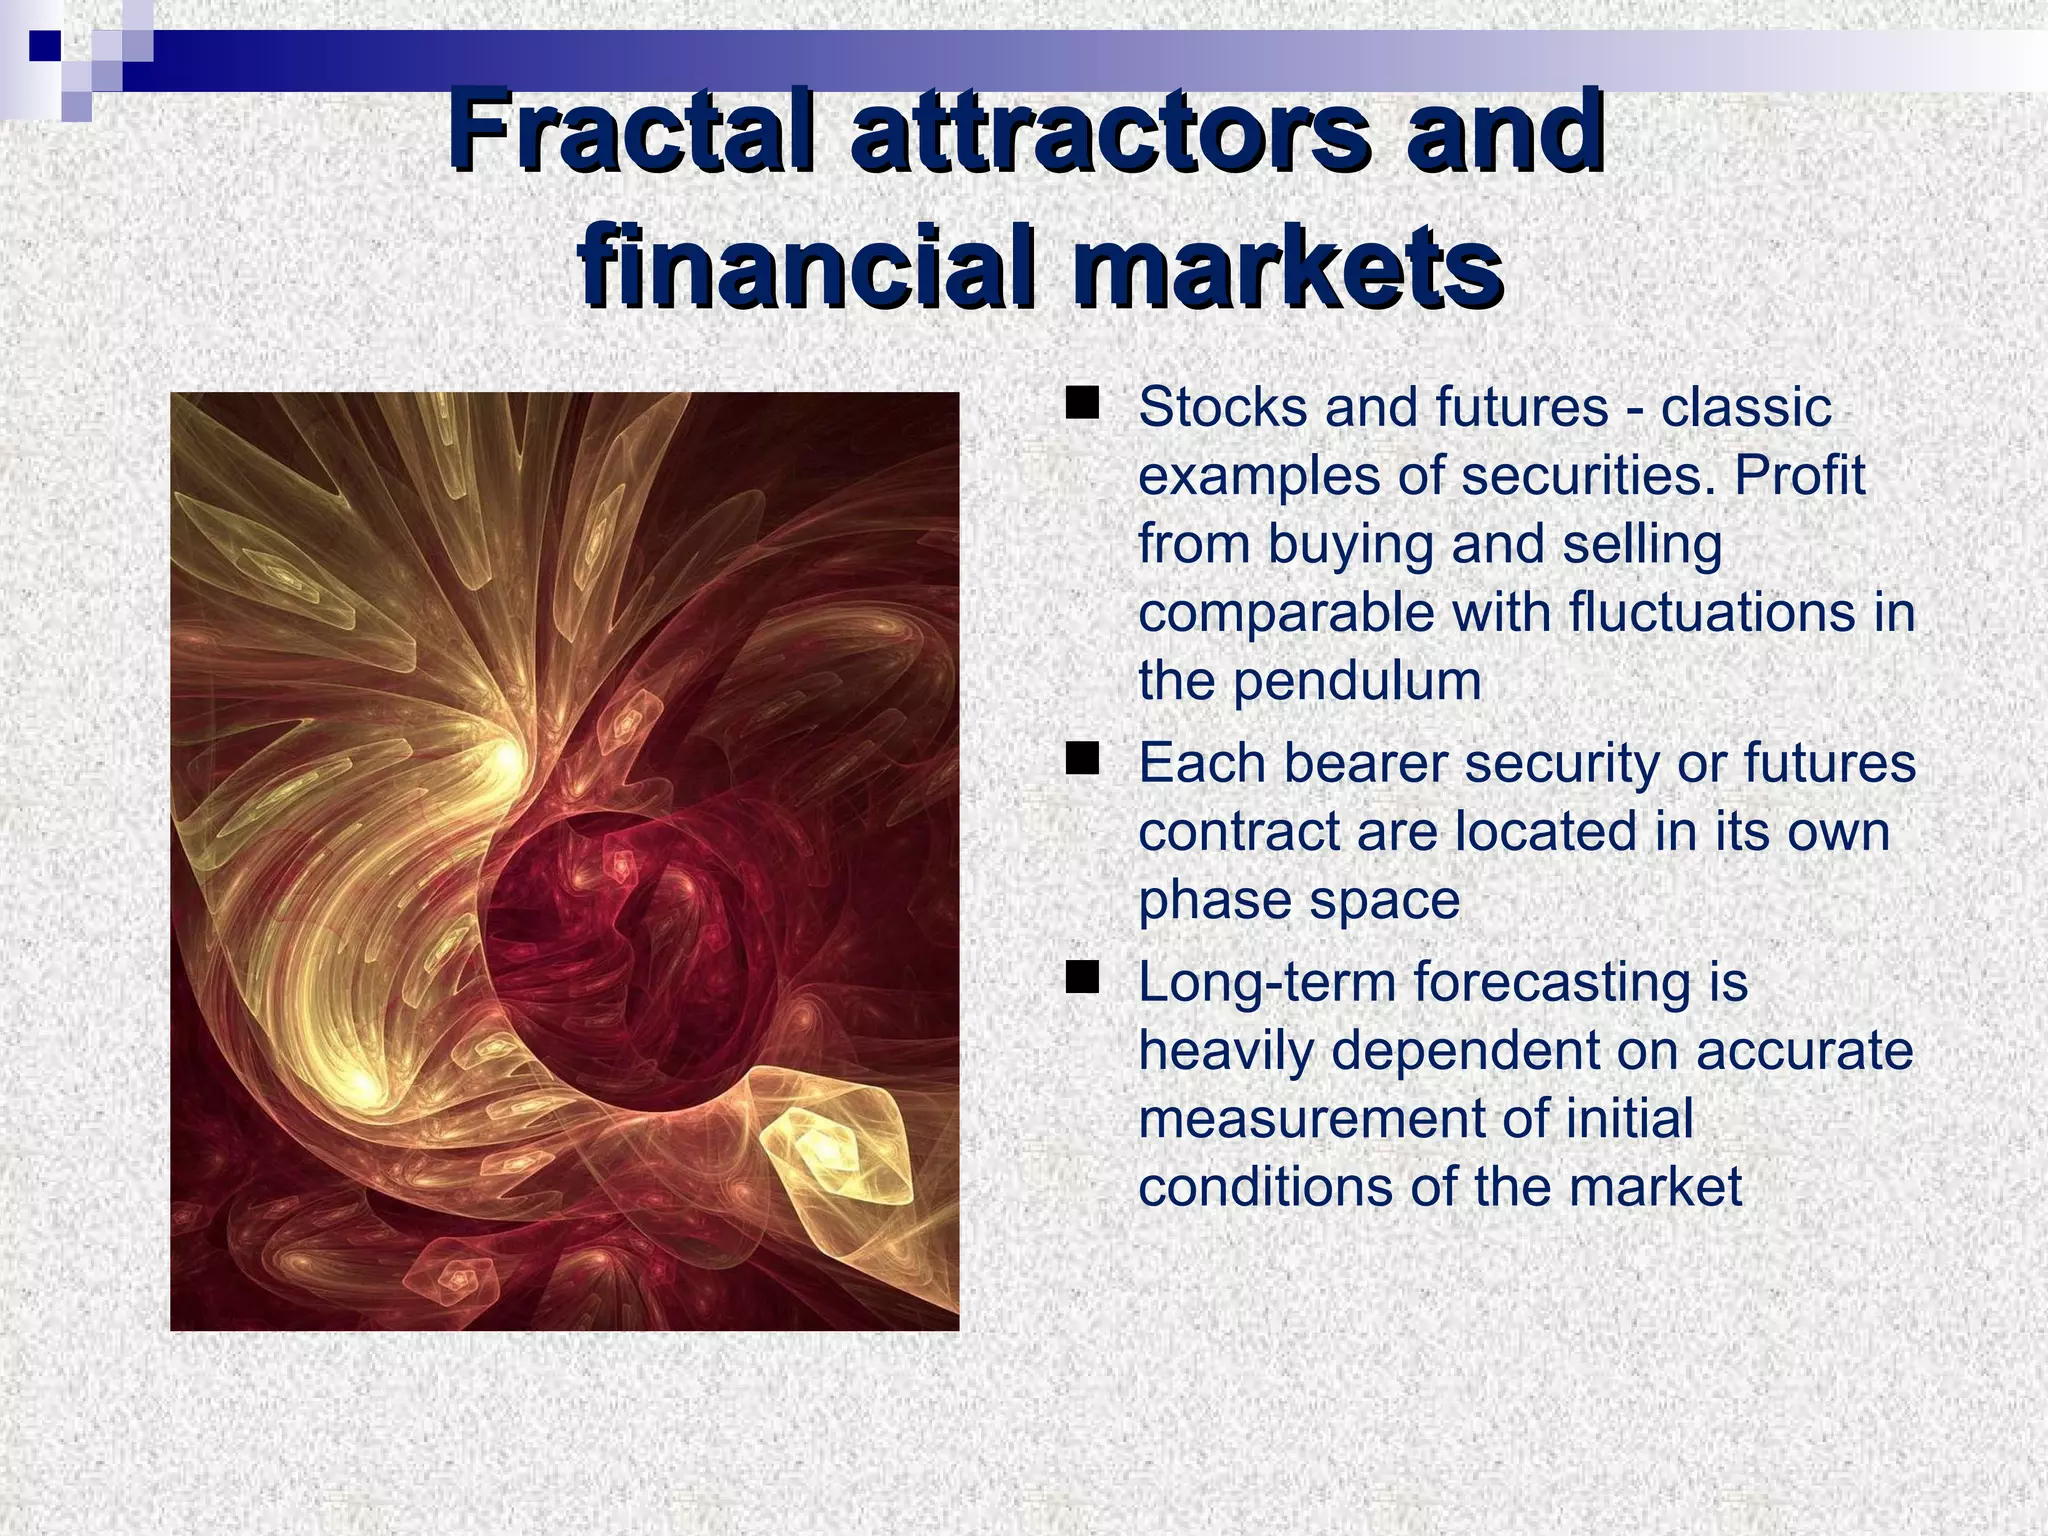
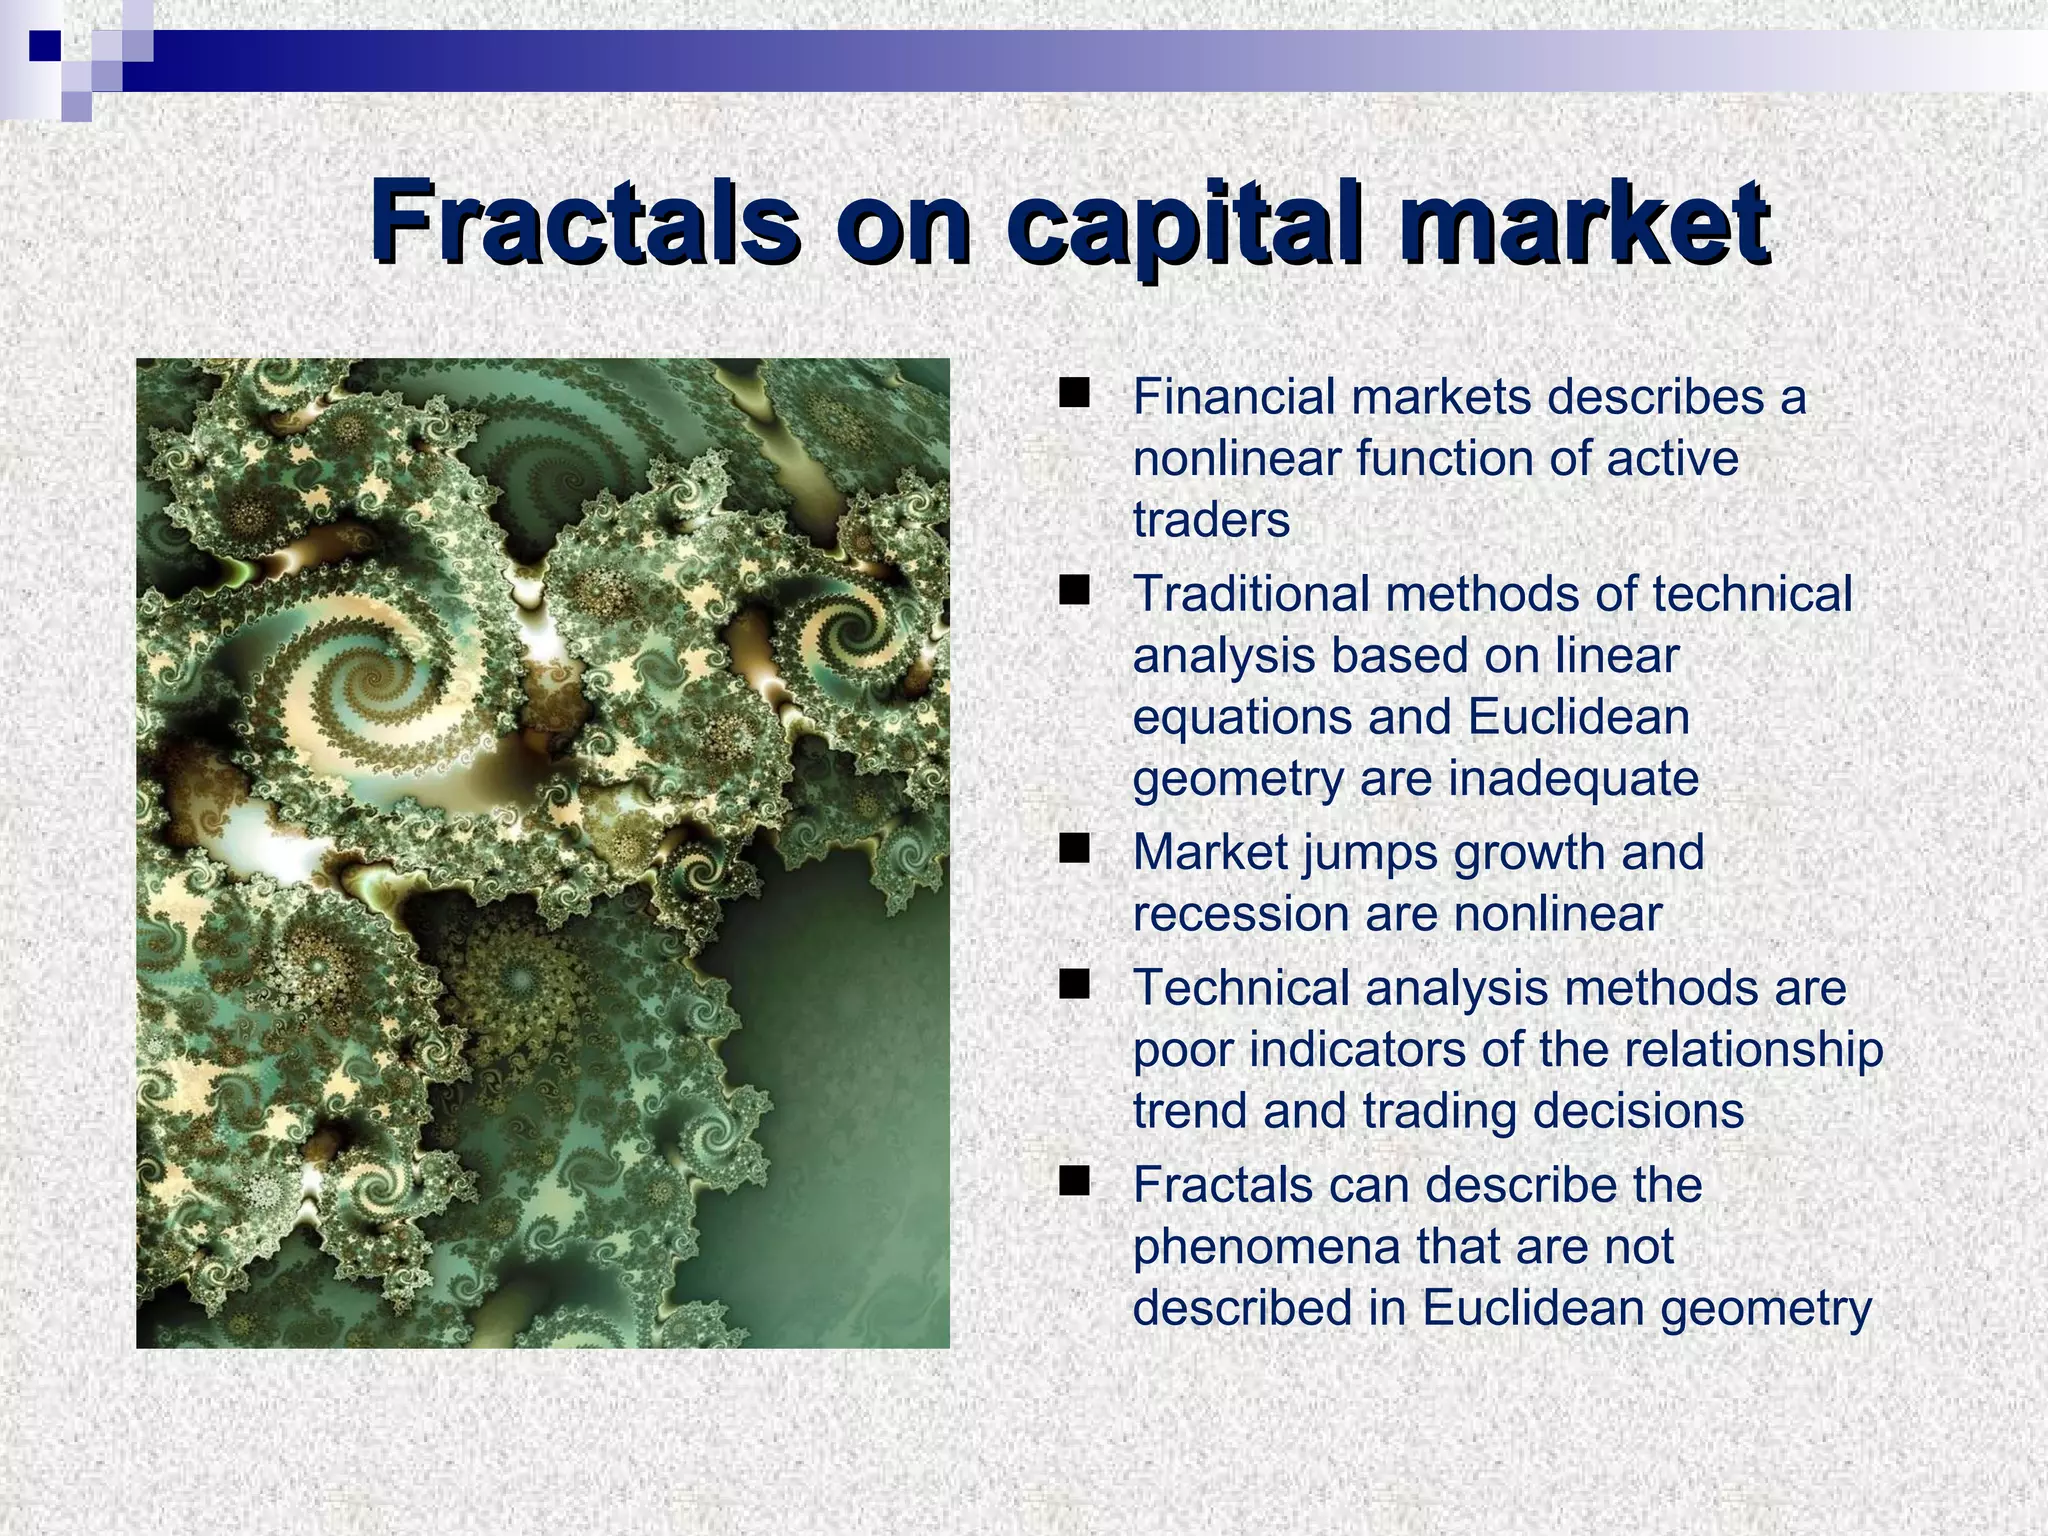
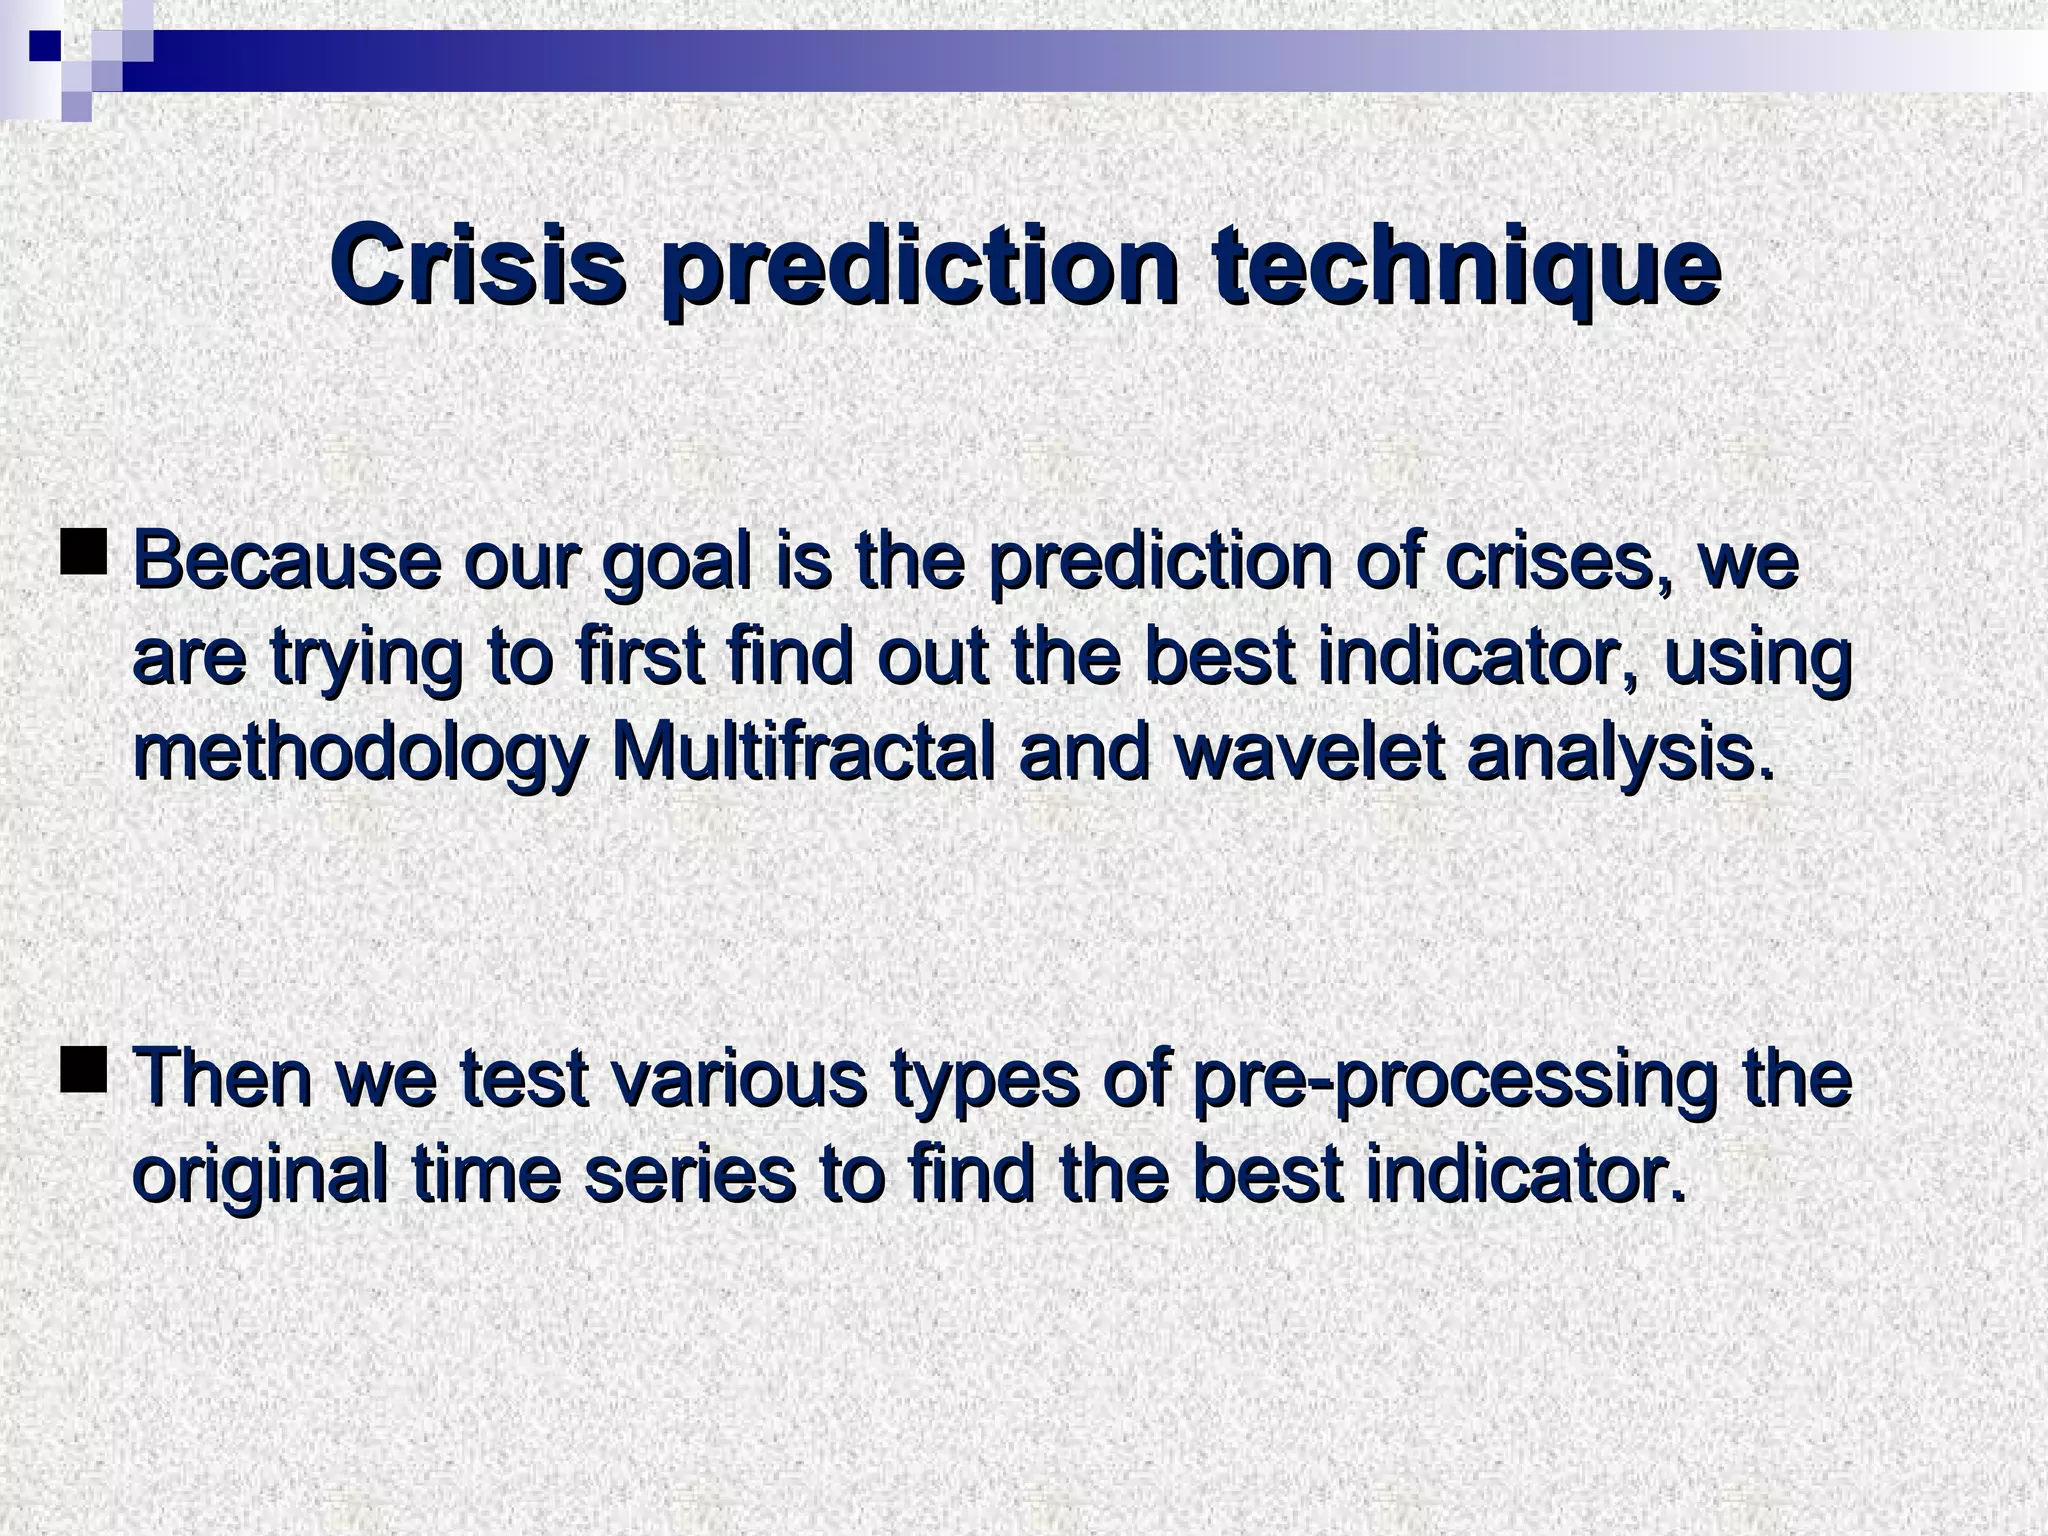
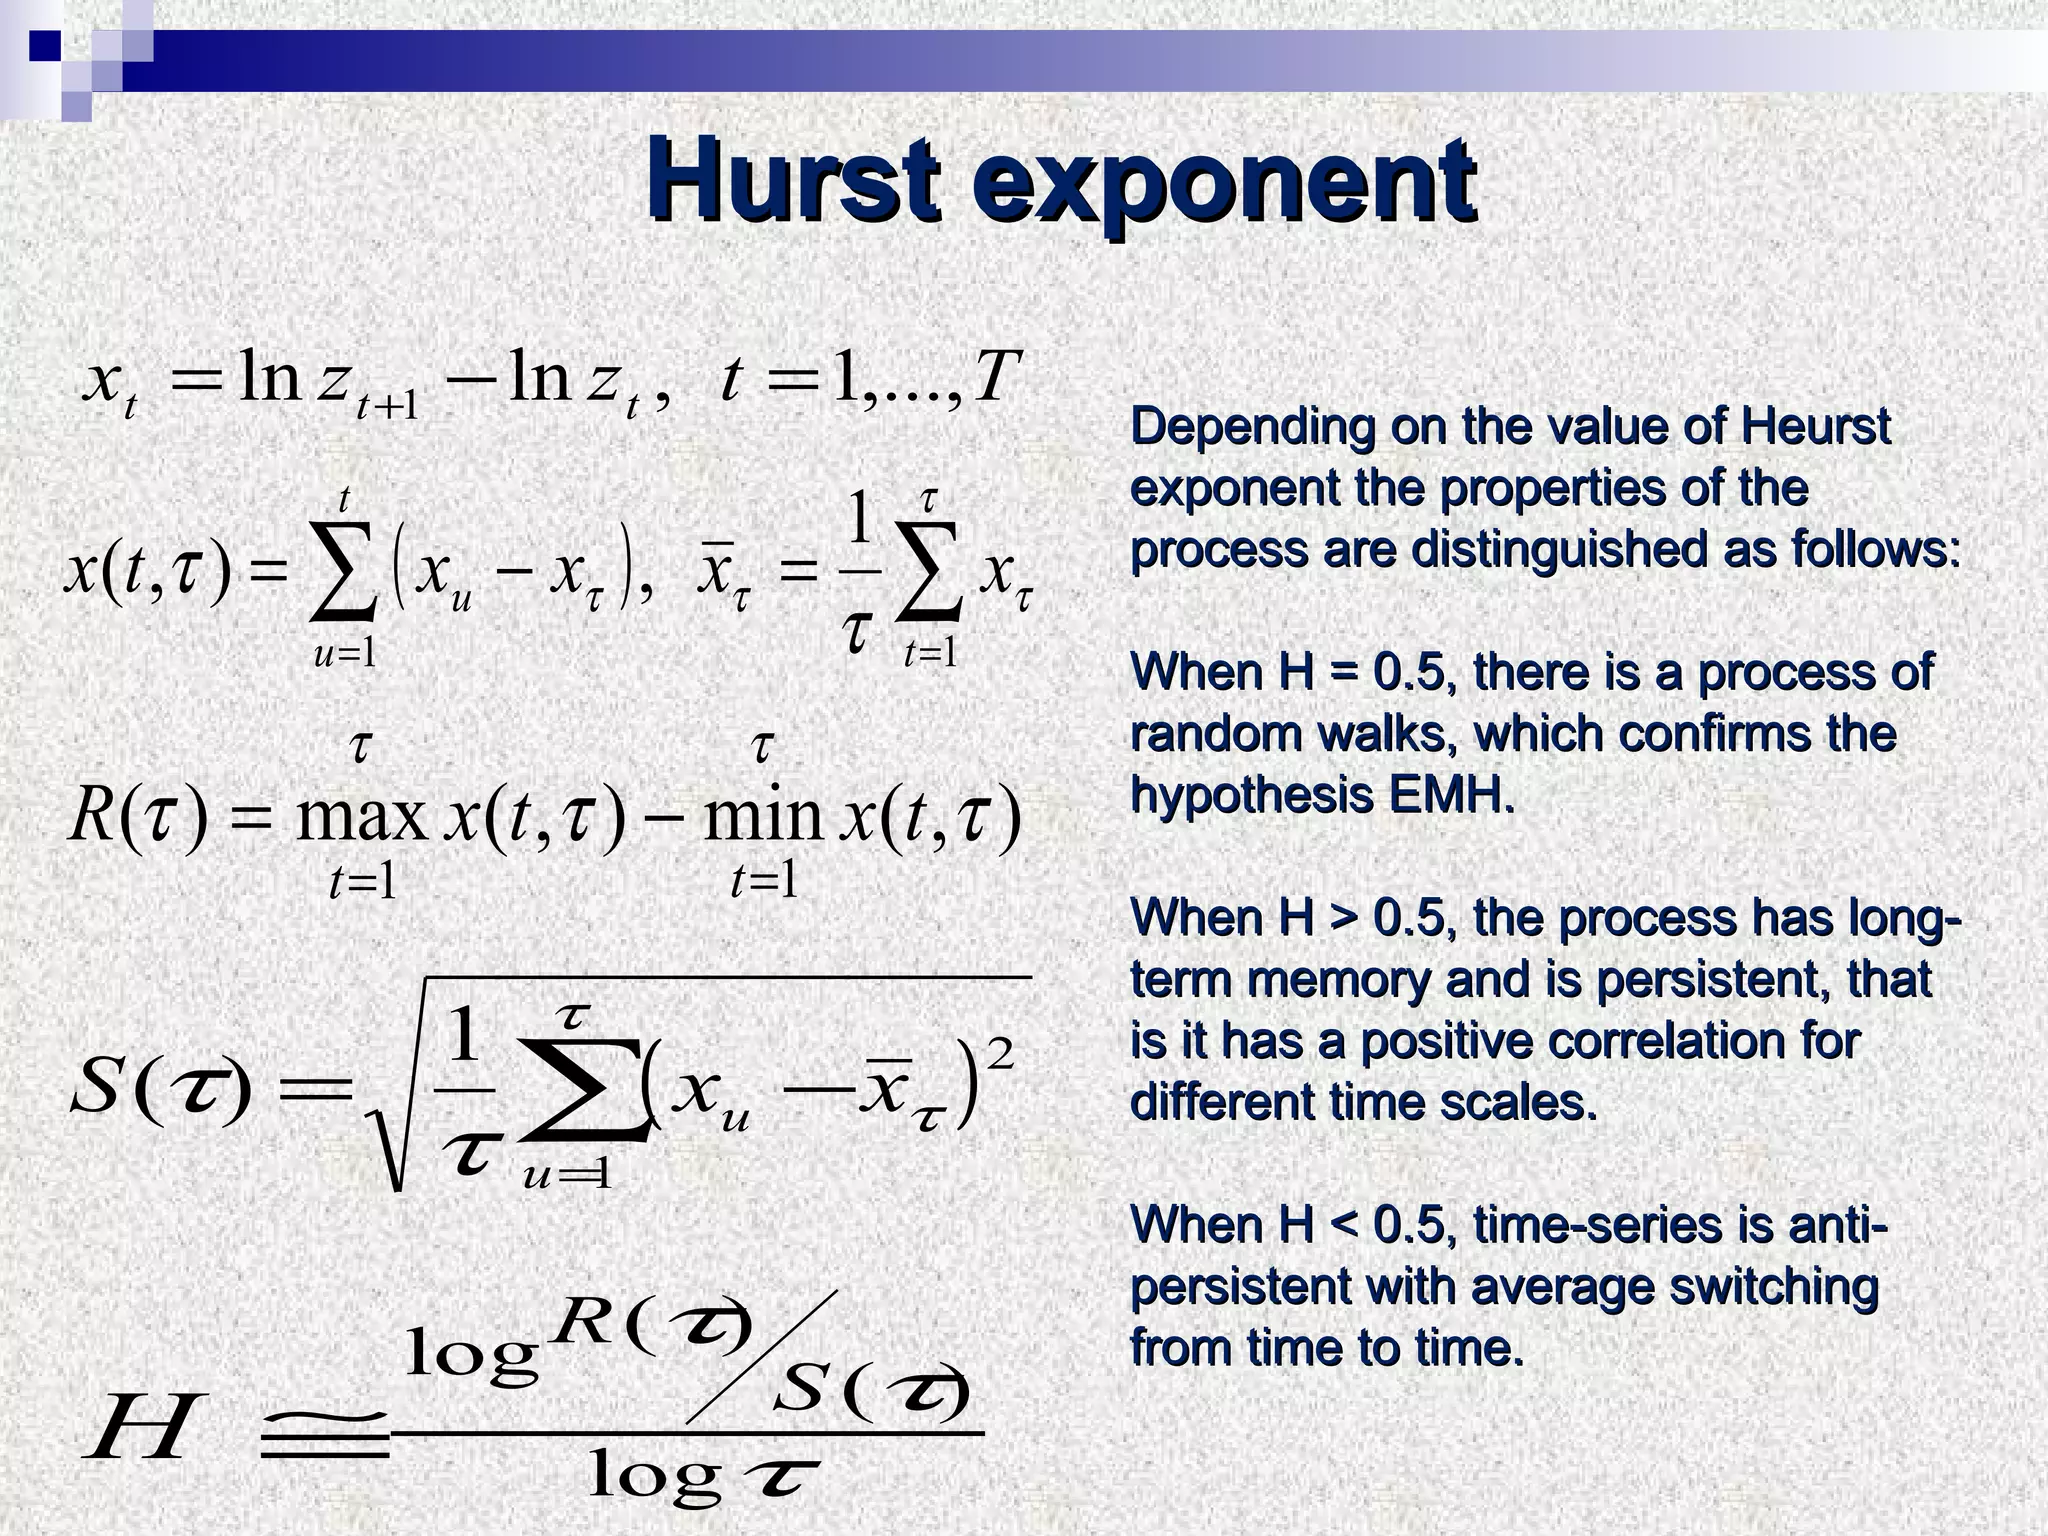
The document discusses using multifractal and wavelet analysis to predict financial market crises. It analyzes various financial market indices during crisis periods from 1987 to 2008. Fractals are described as shapes that appear similar at different scales and have non-integer dimensions. Financial markets exhibit fractal properties with long-term memory and volatility clustering. The researchers use techniques like Hurst exponent analysis, time series partitioning, and calculating partition functions and fractal dimension spectra to analyze indices for signs of an impending crisis. The width of the multifractal spectrum is proposed as an indicator, with wider widths preceding crashes.


![Presentation for iccms [автосохраненный]](https://cdn.slidesharecdn.com/ss_thumbnails/presentationforiccms-150703201043-lva1-app6892-thumbnail.jpg?width=640&height=640&fit=bounds)


![Presentation for iccms [автосохраненный]](https://cdn.slidesharecdn.com/ss_thumbnails/presentationforiccms-150222140158-conversion-gate02-thumbnail.jpg?width=640&height=640&fit=bounds)


