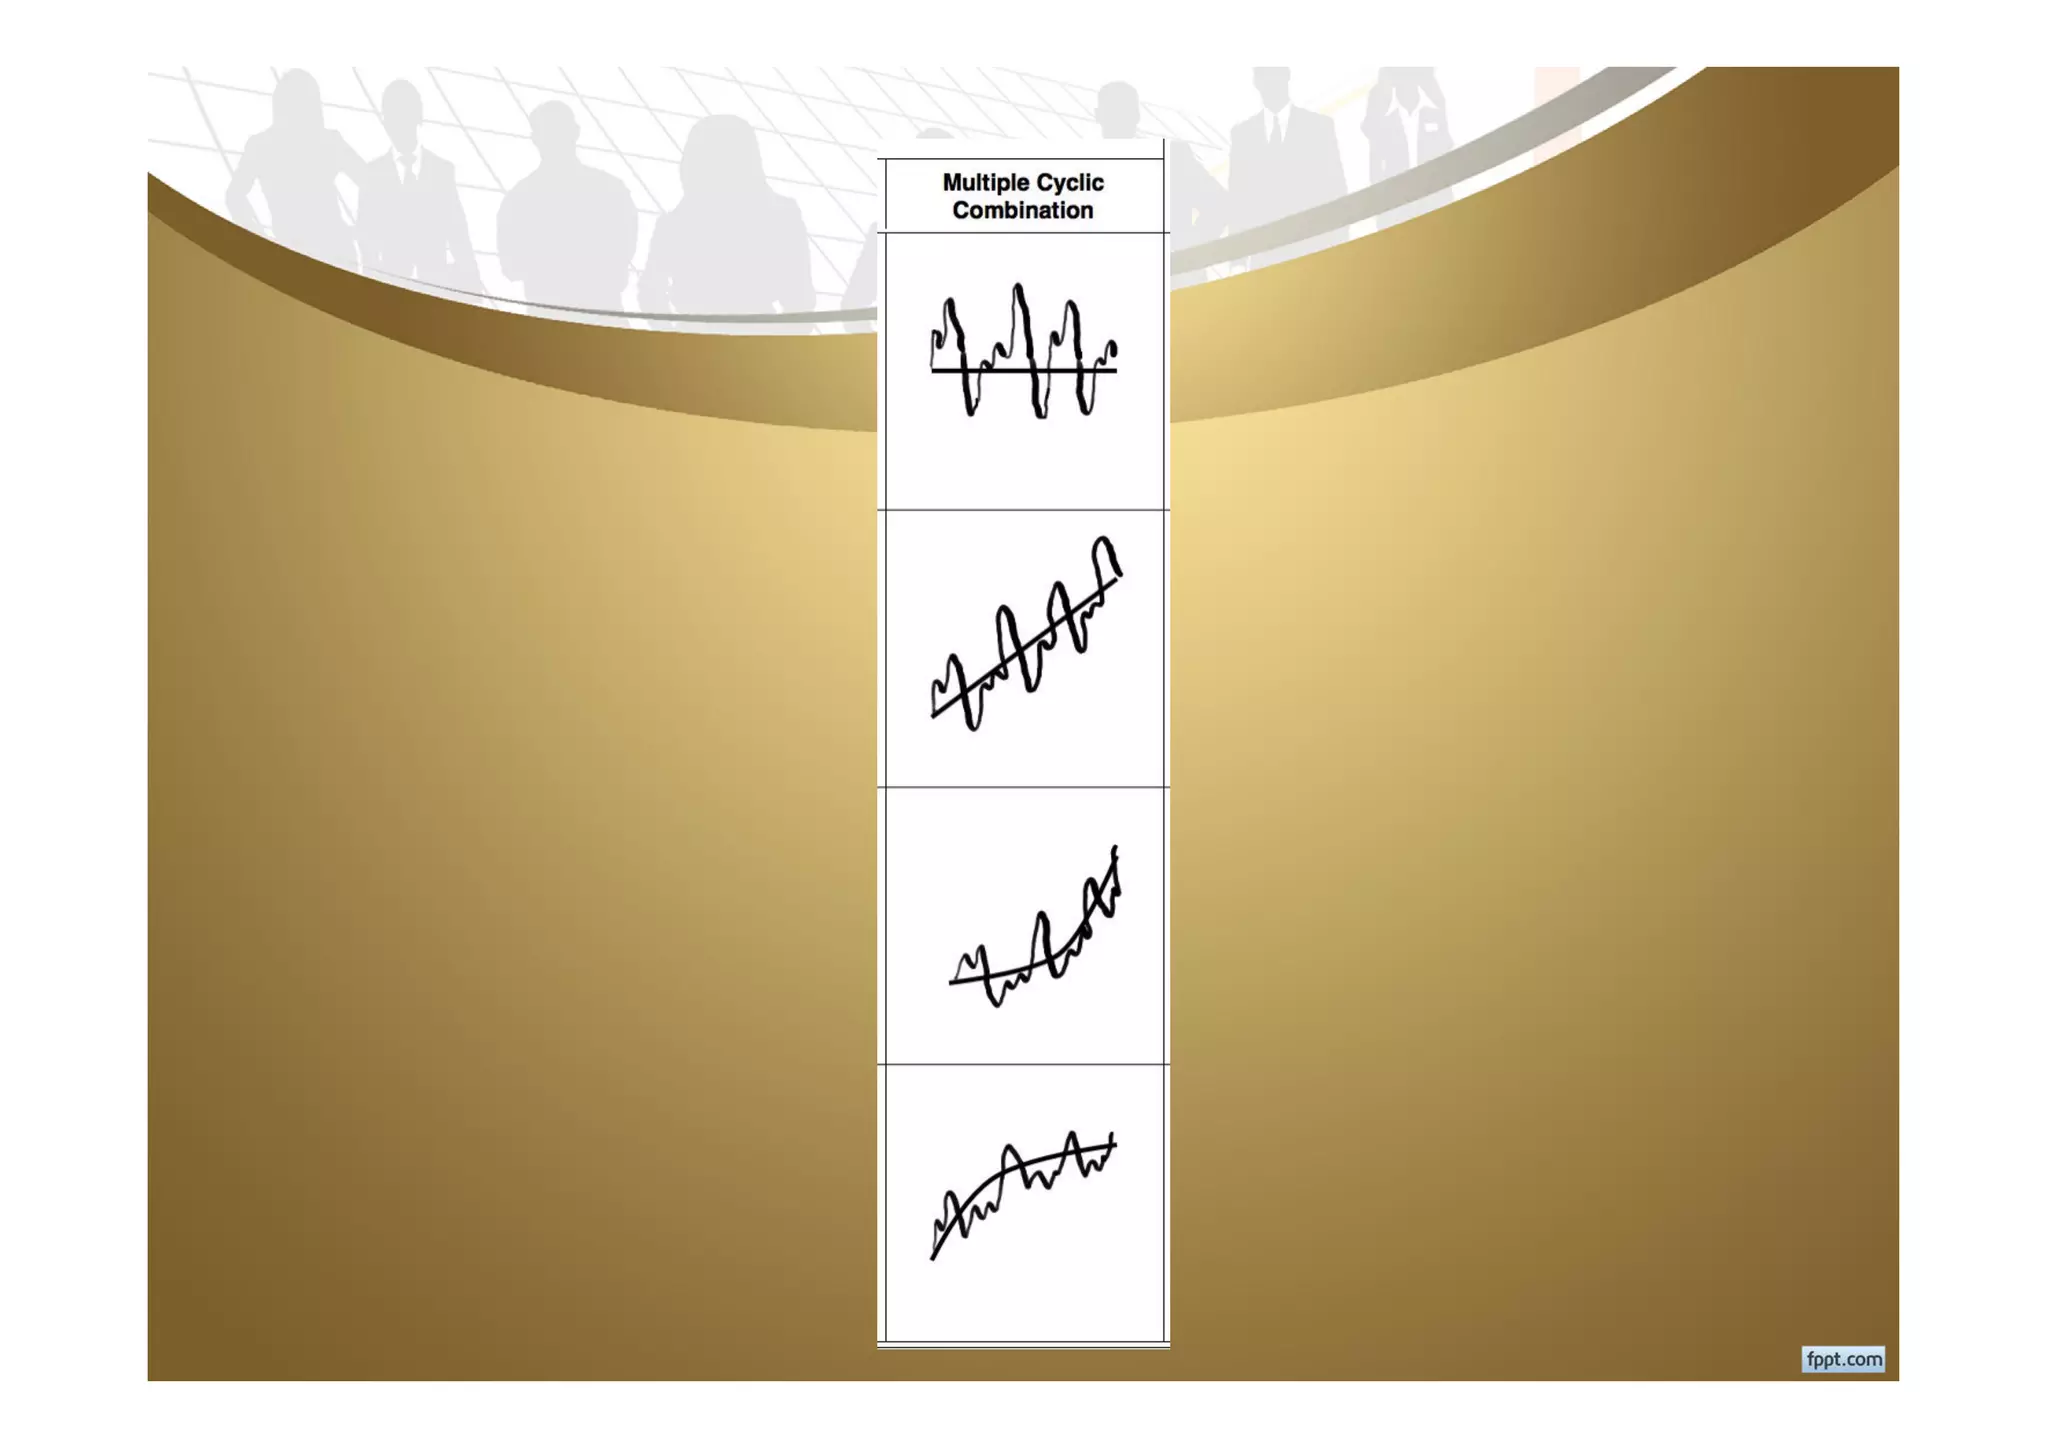
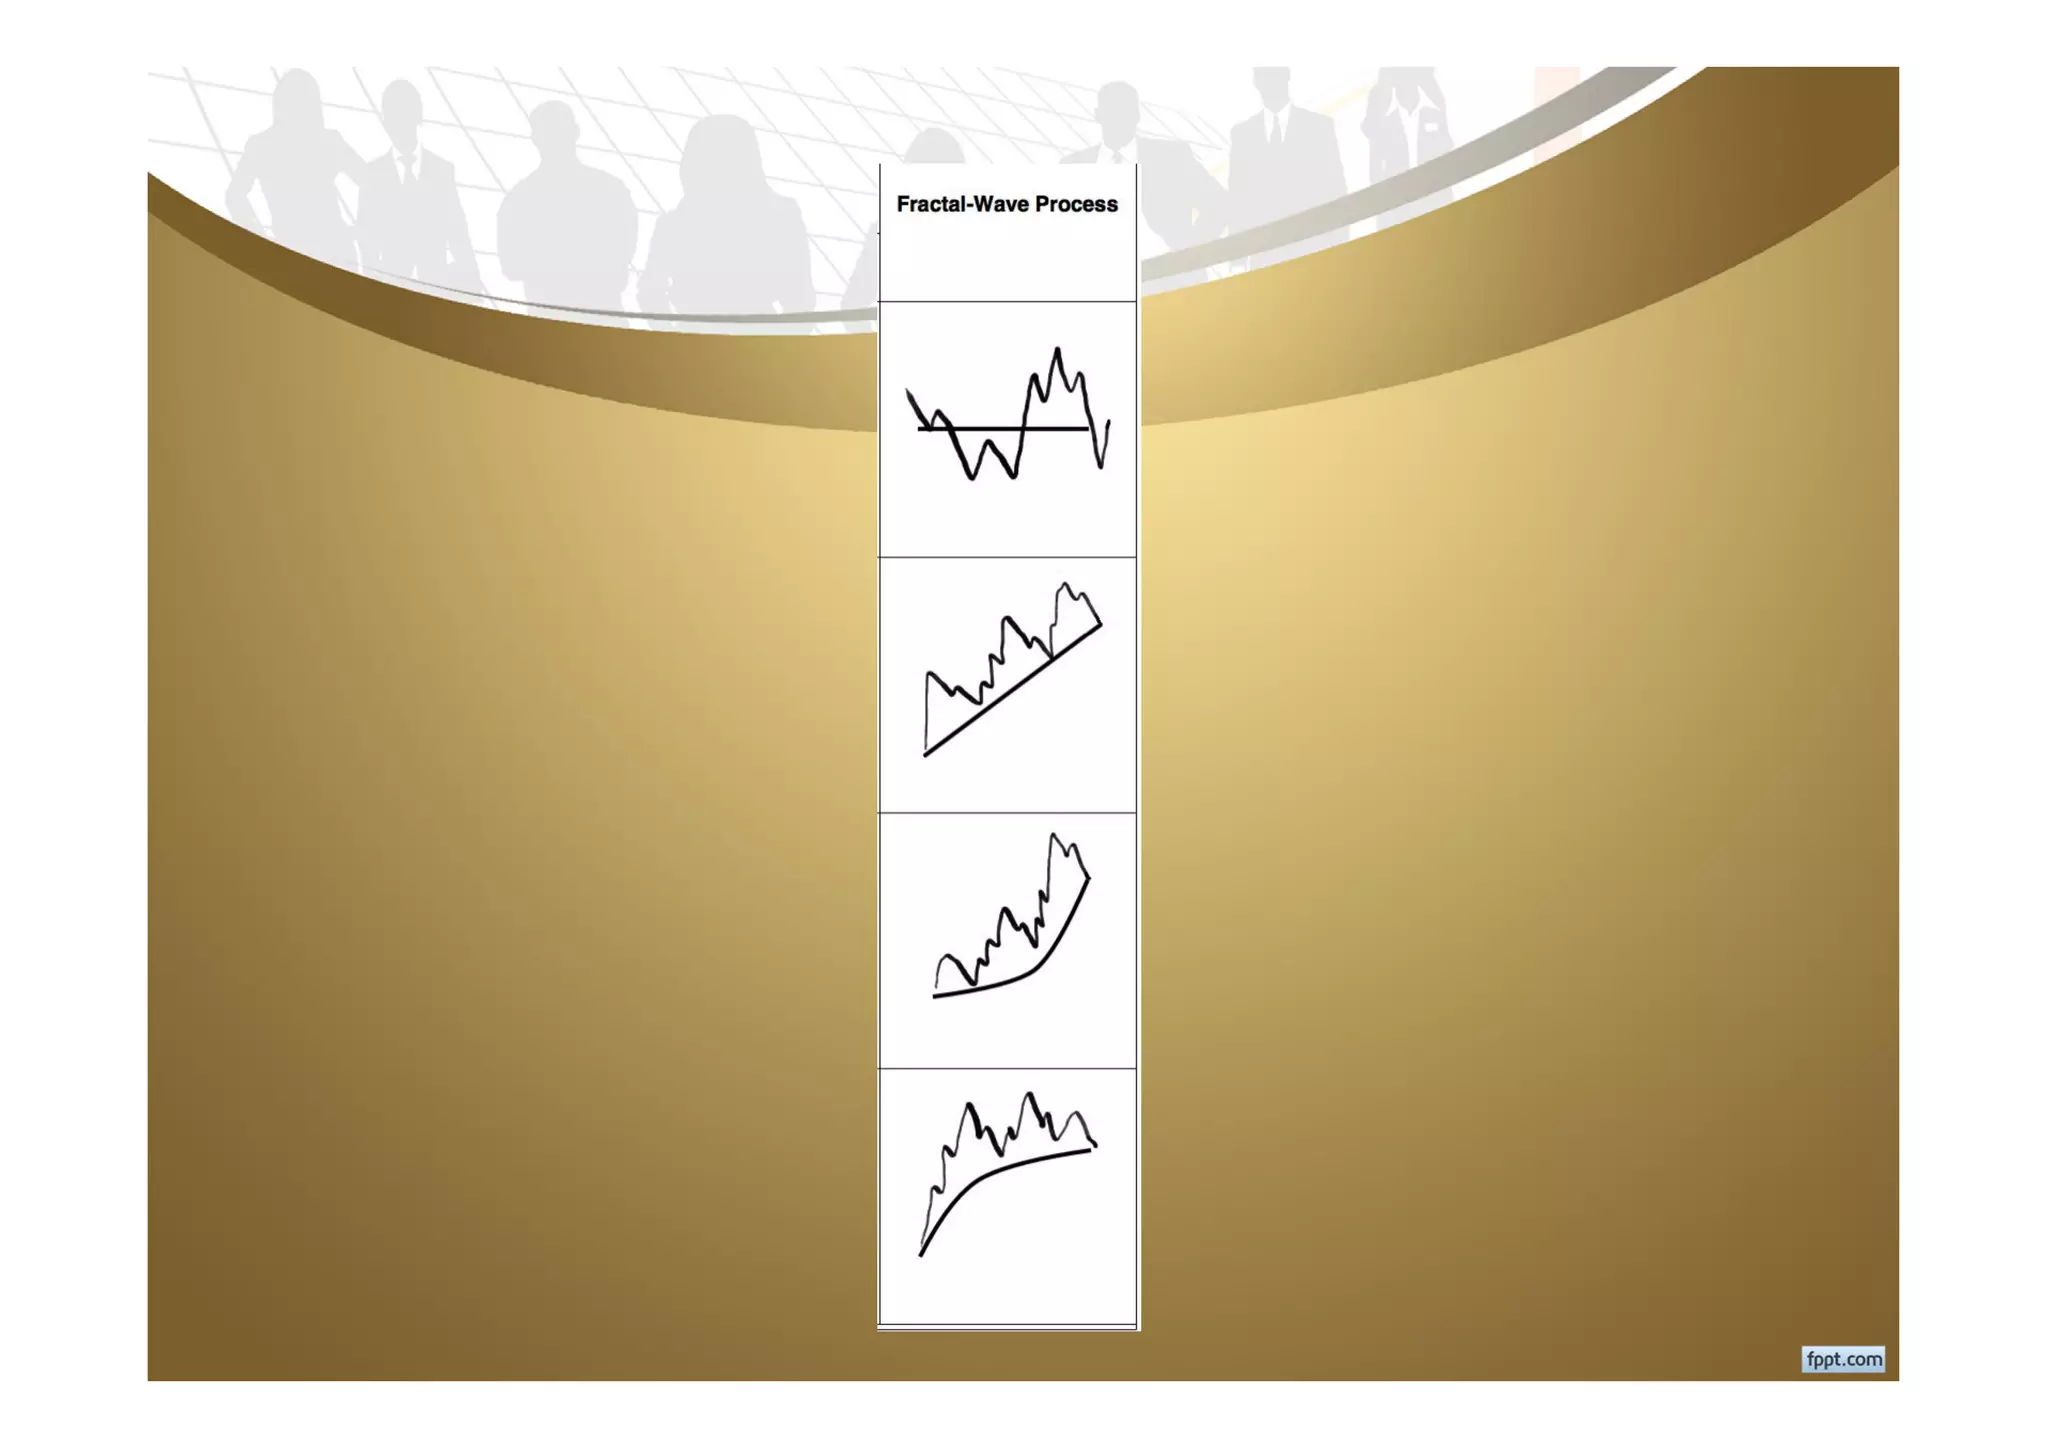
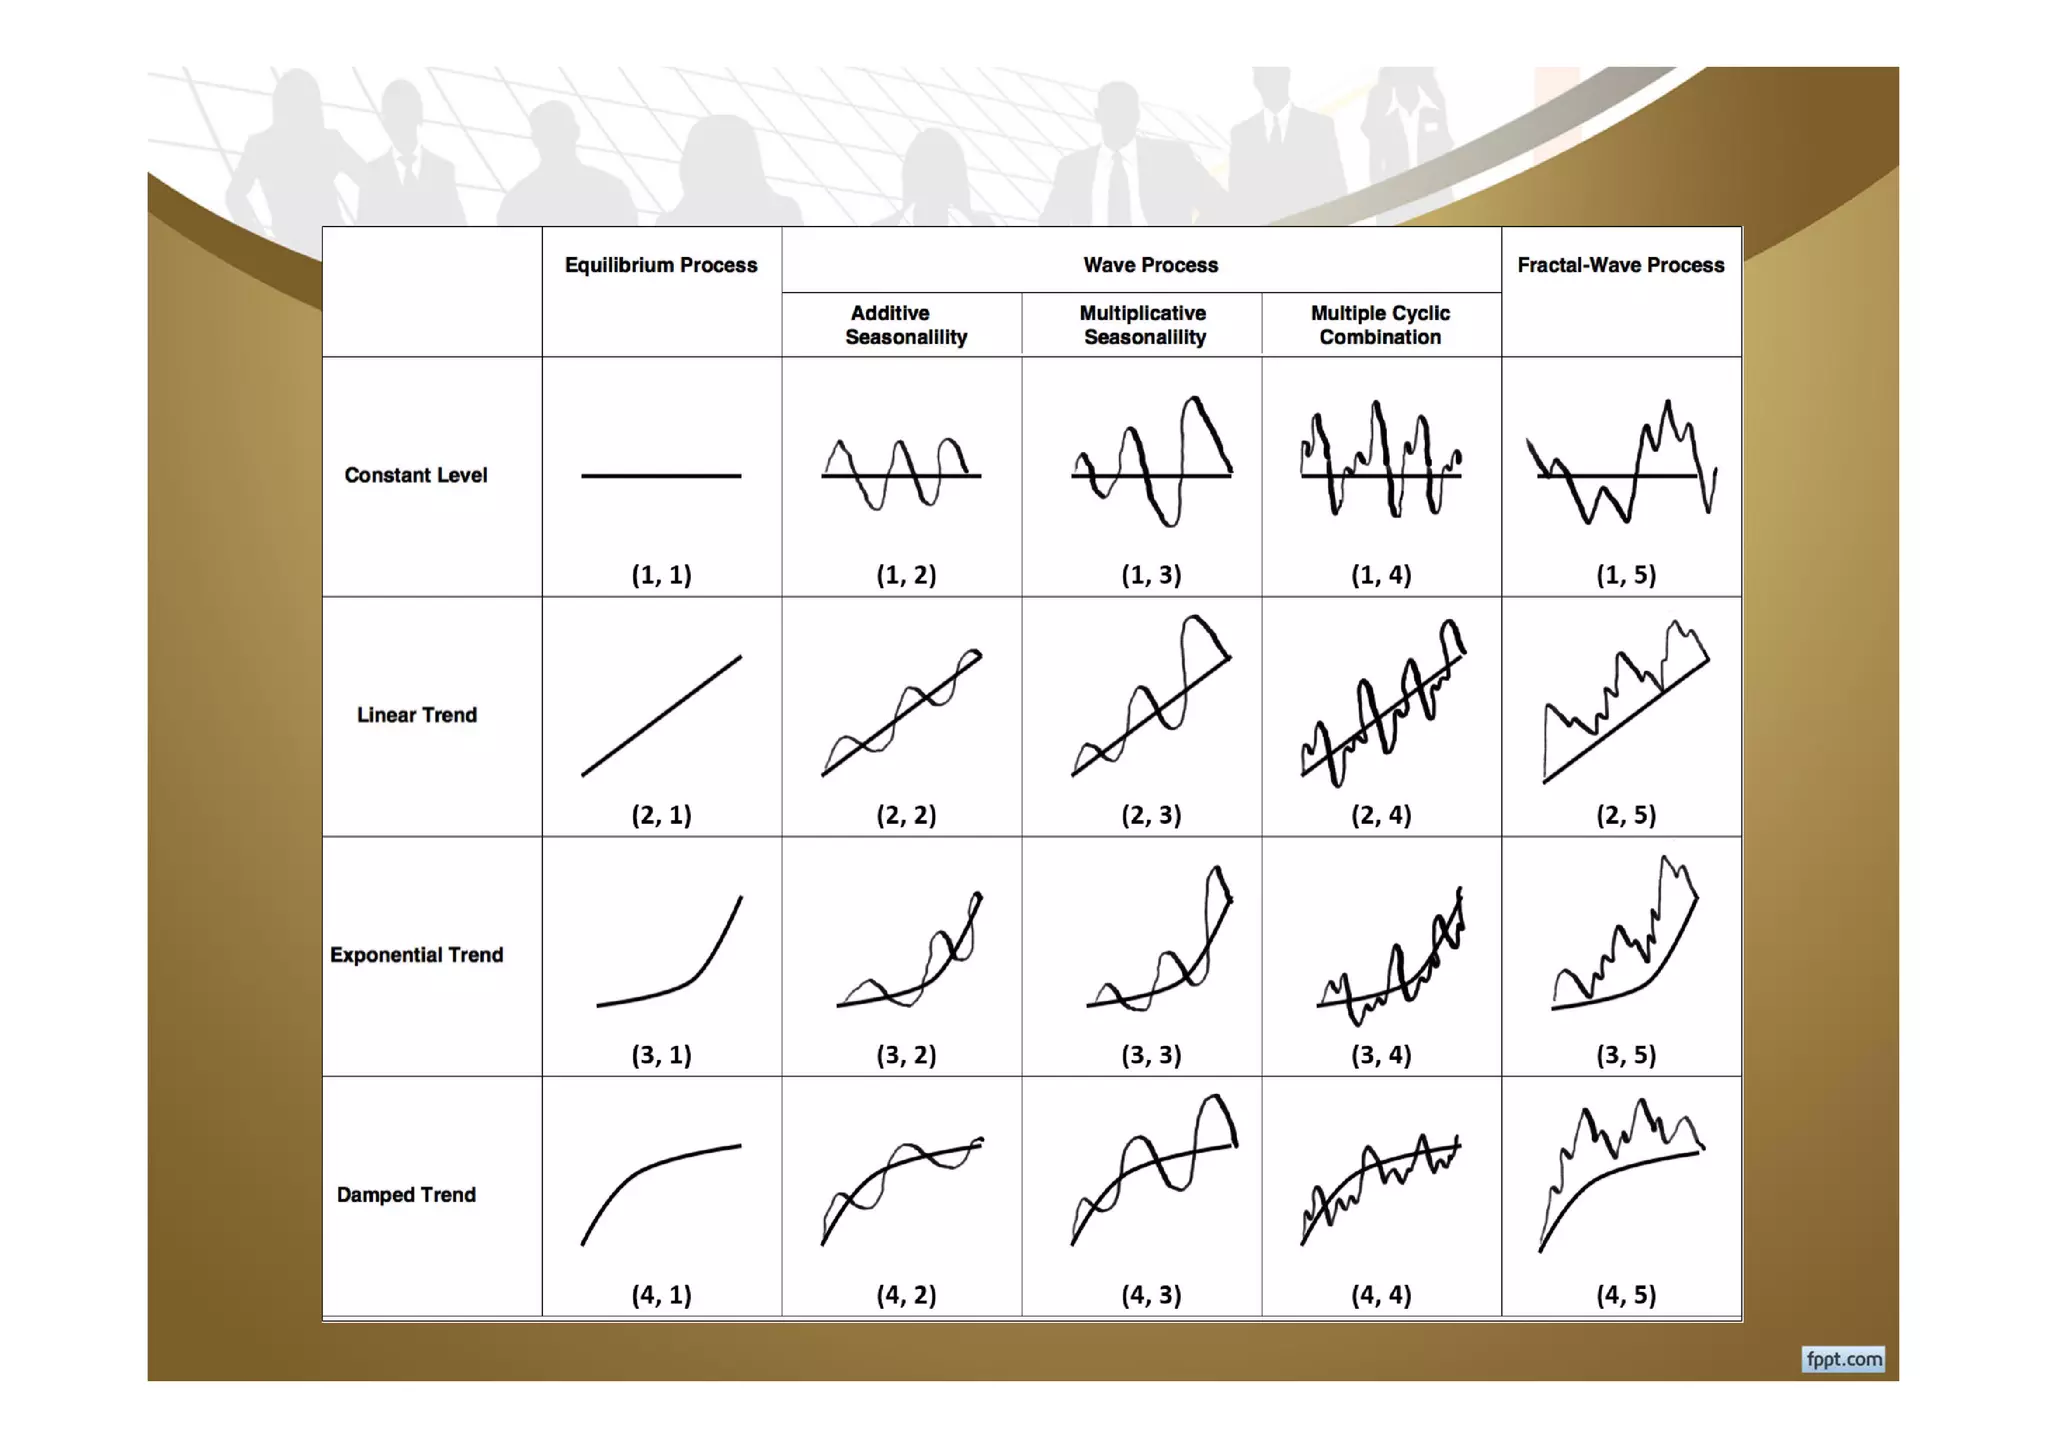
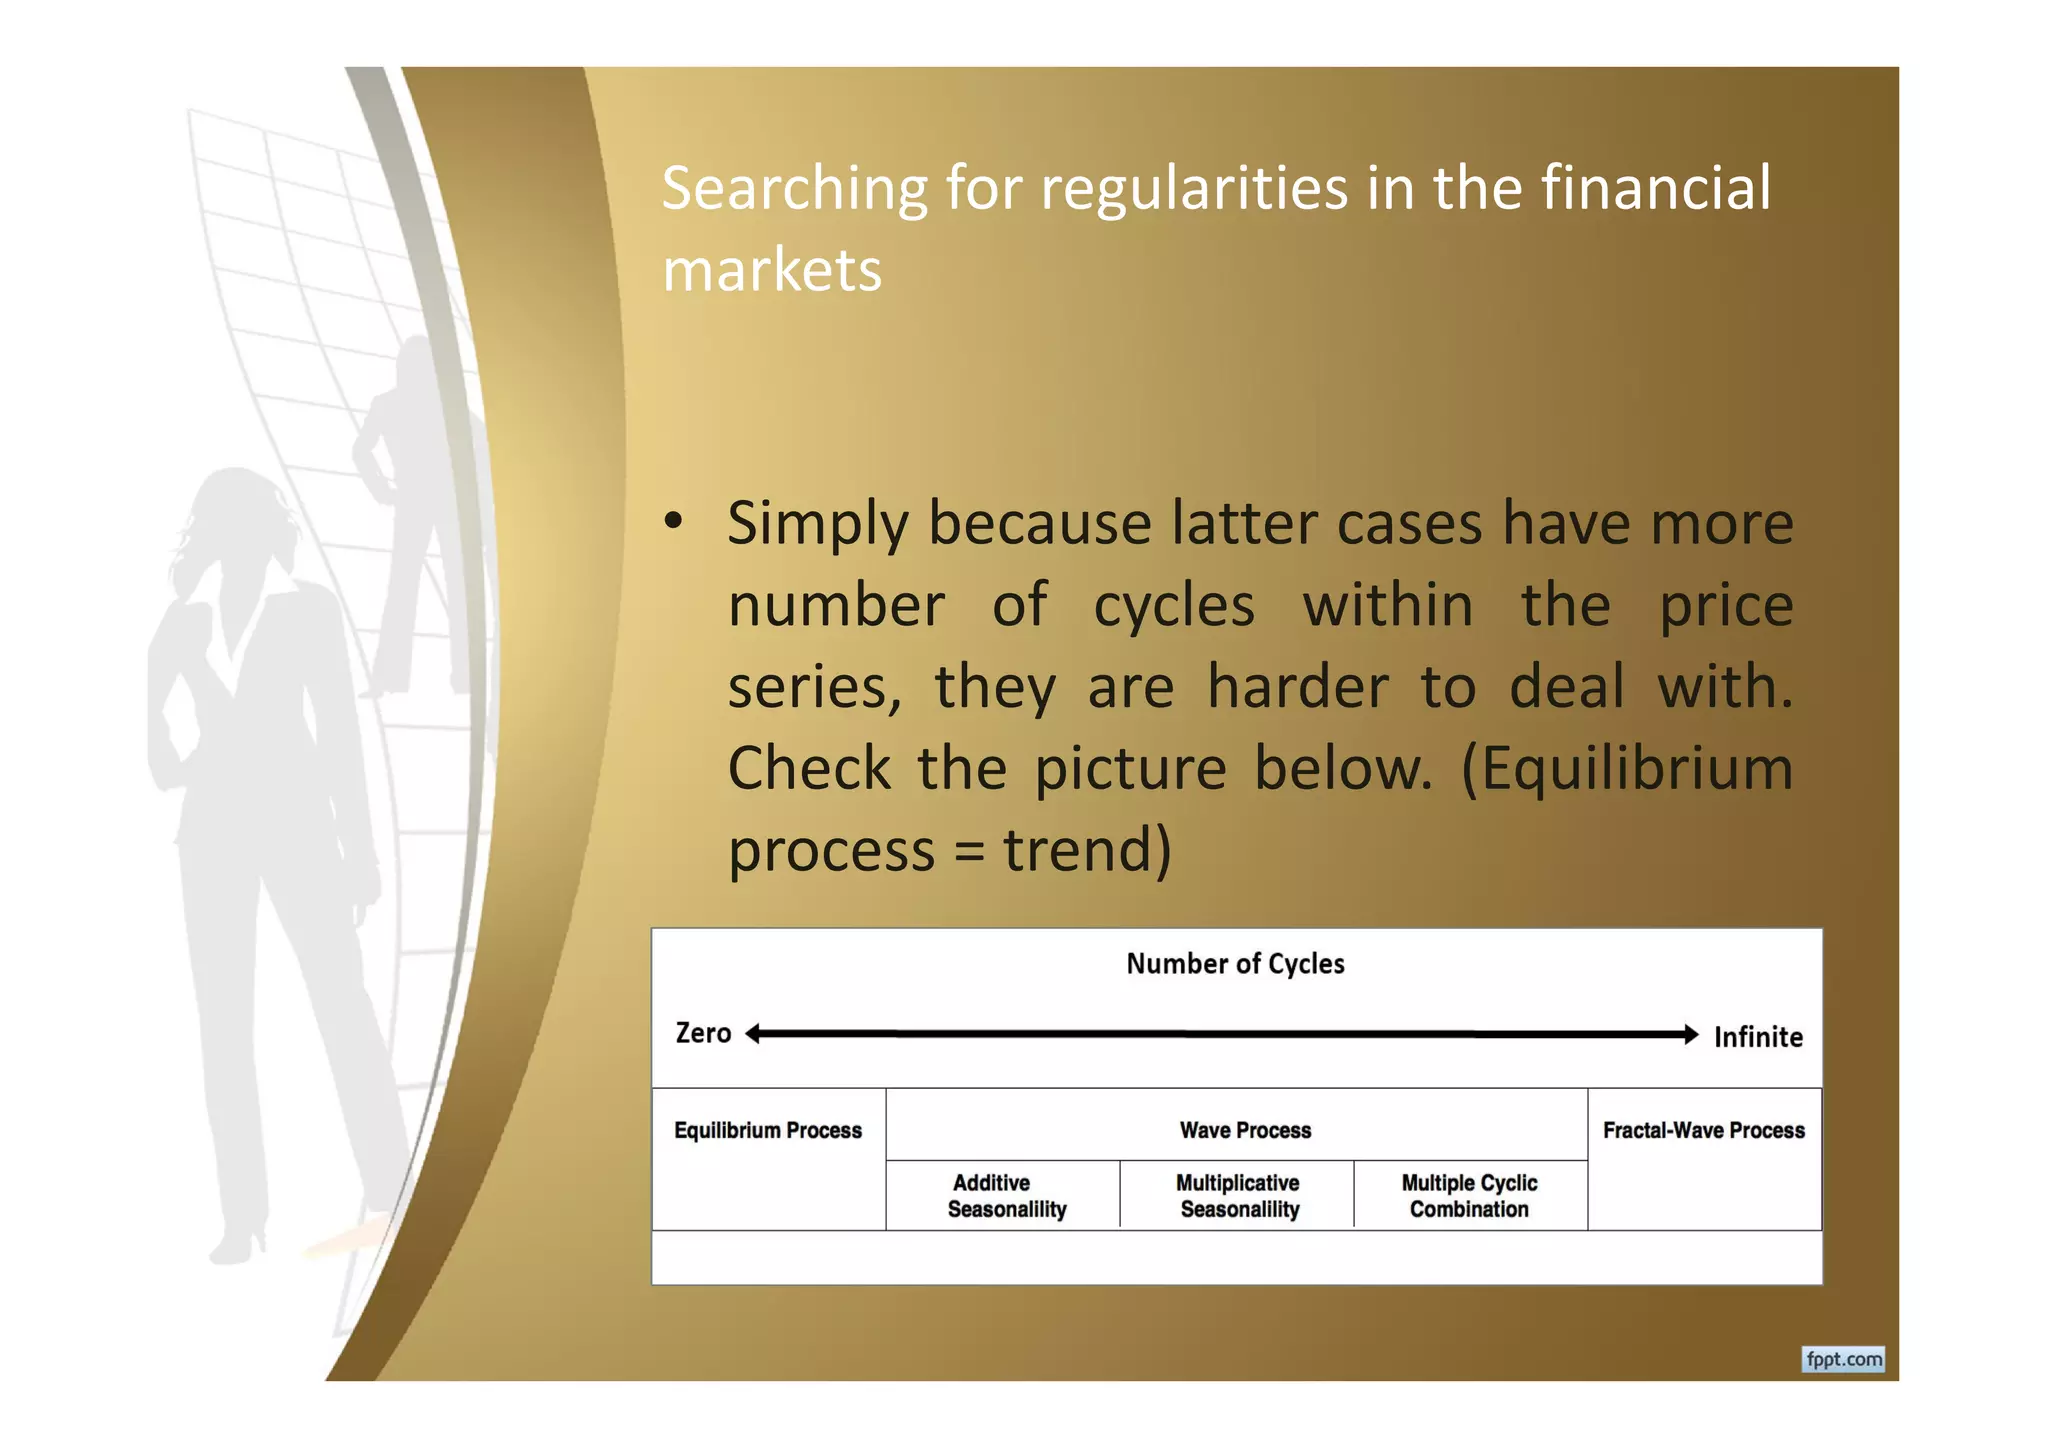
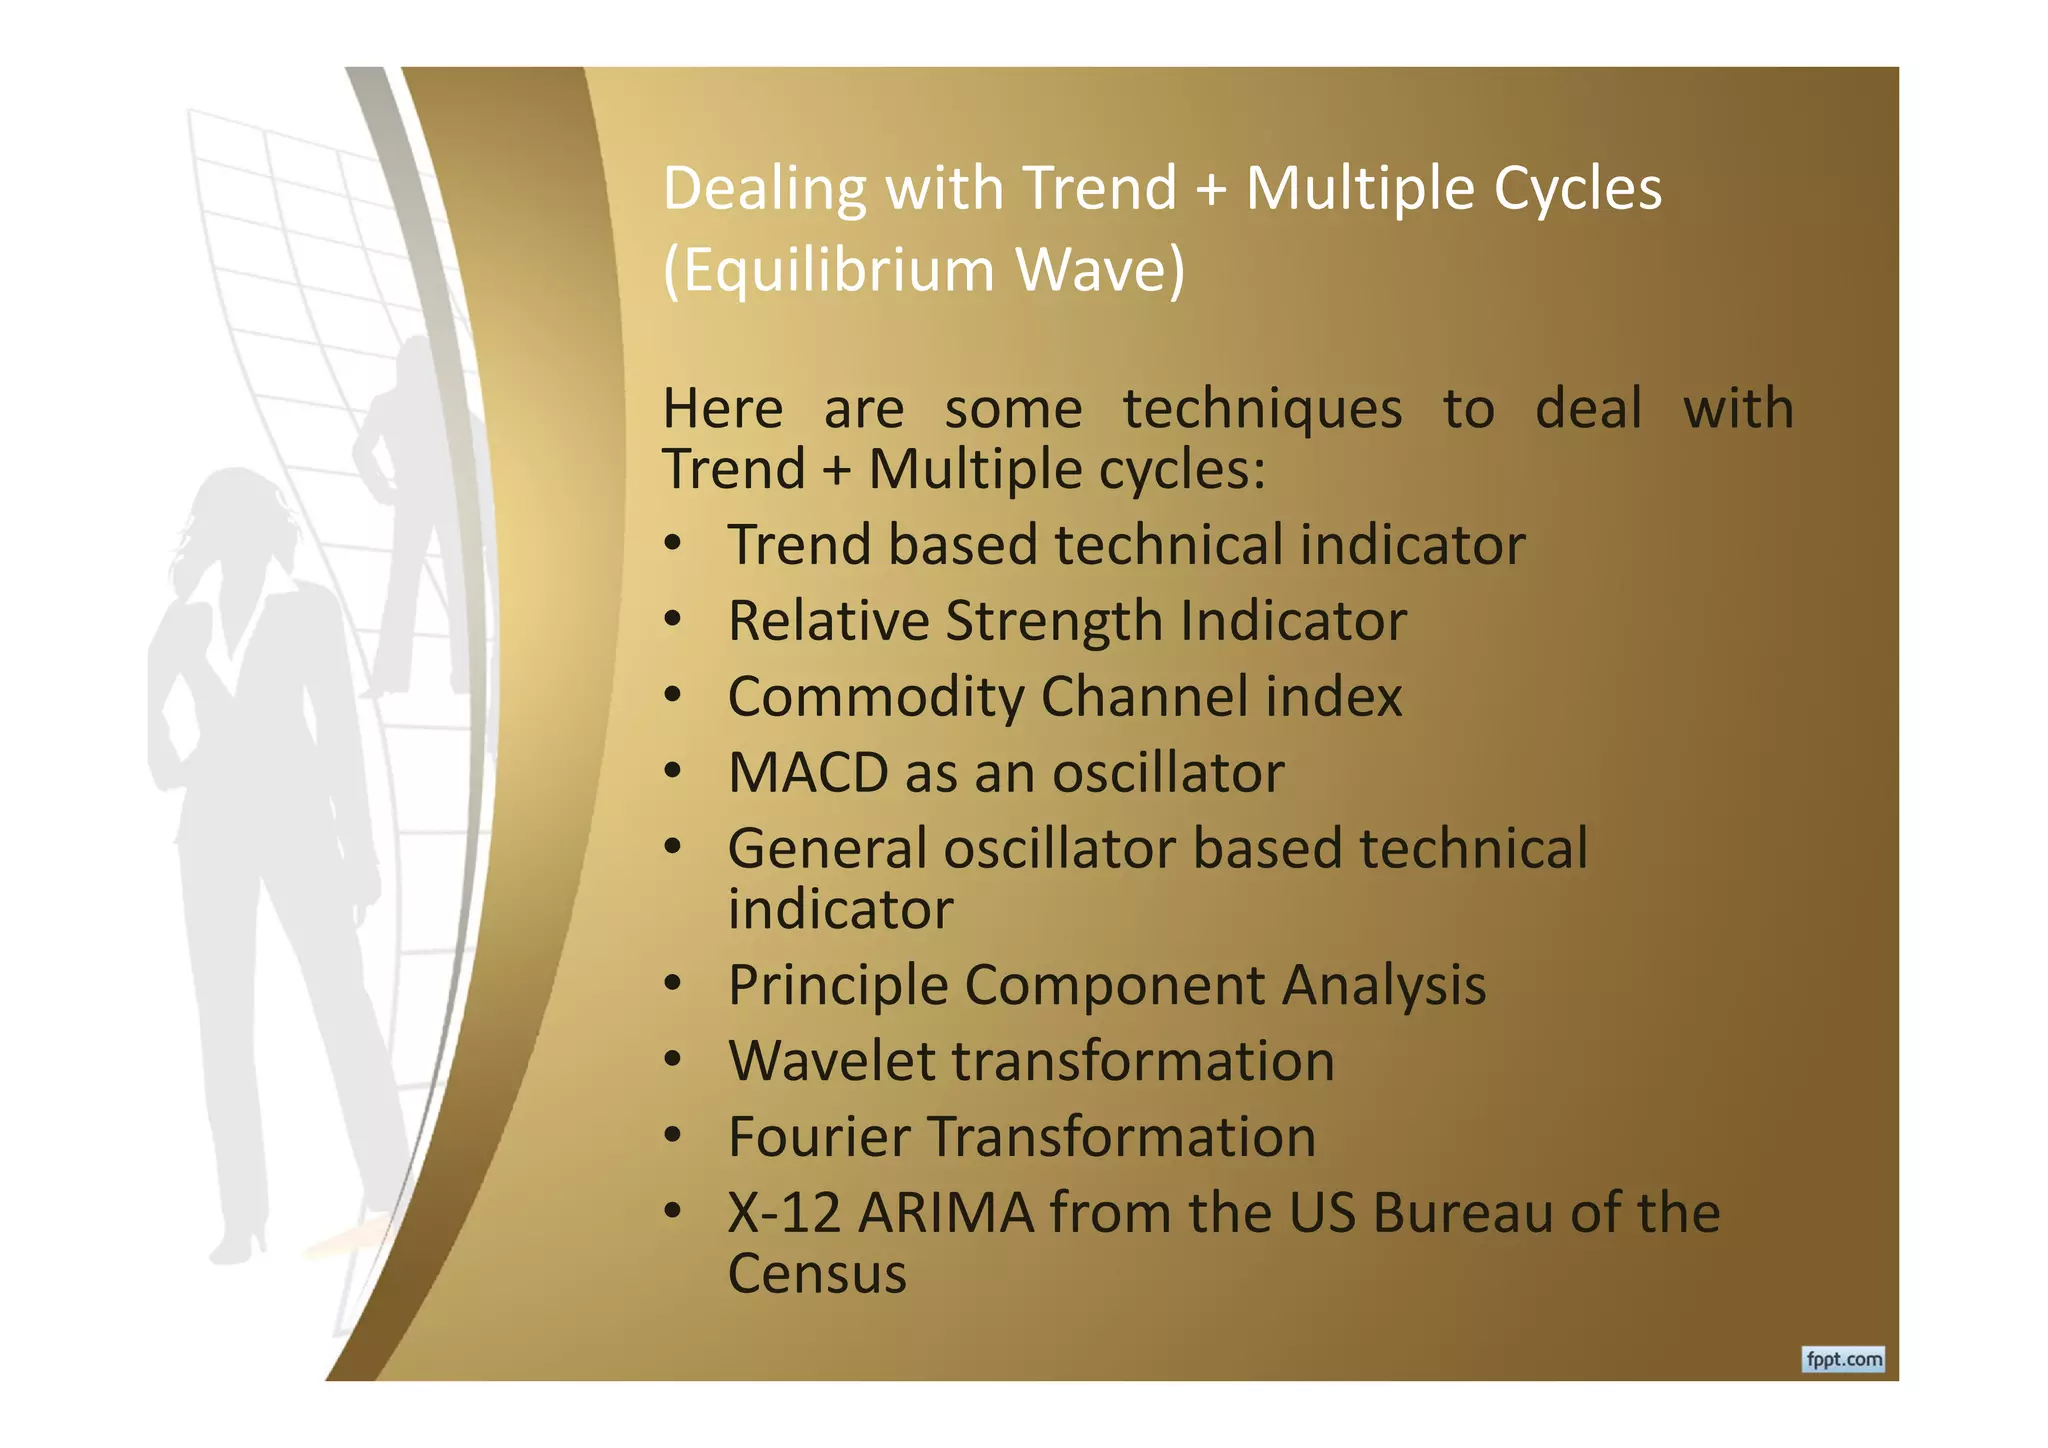
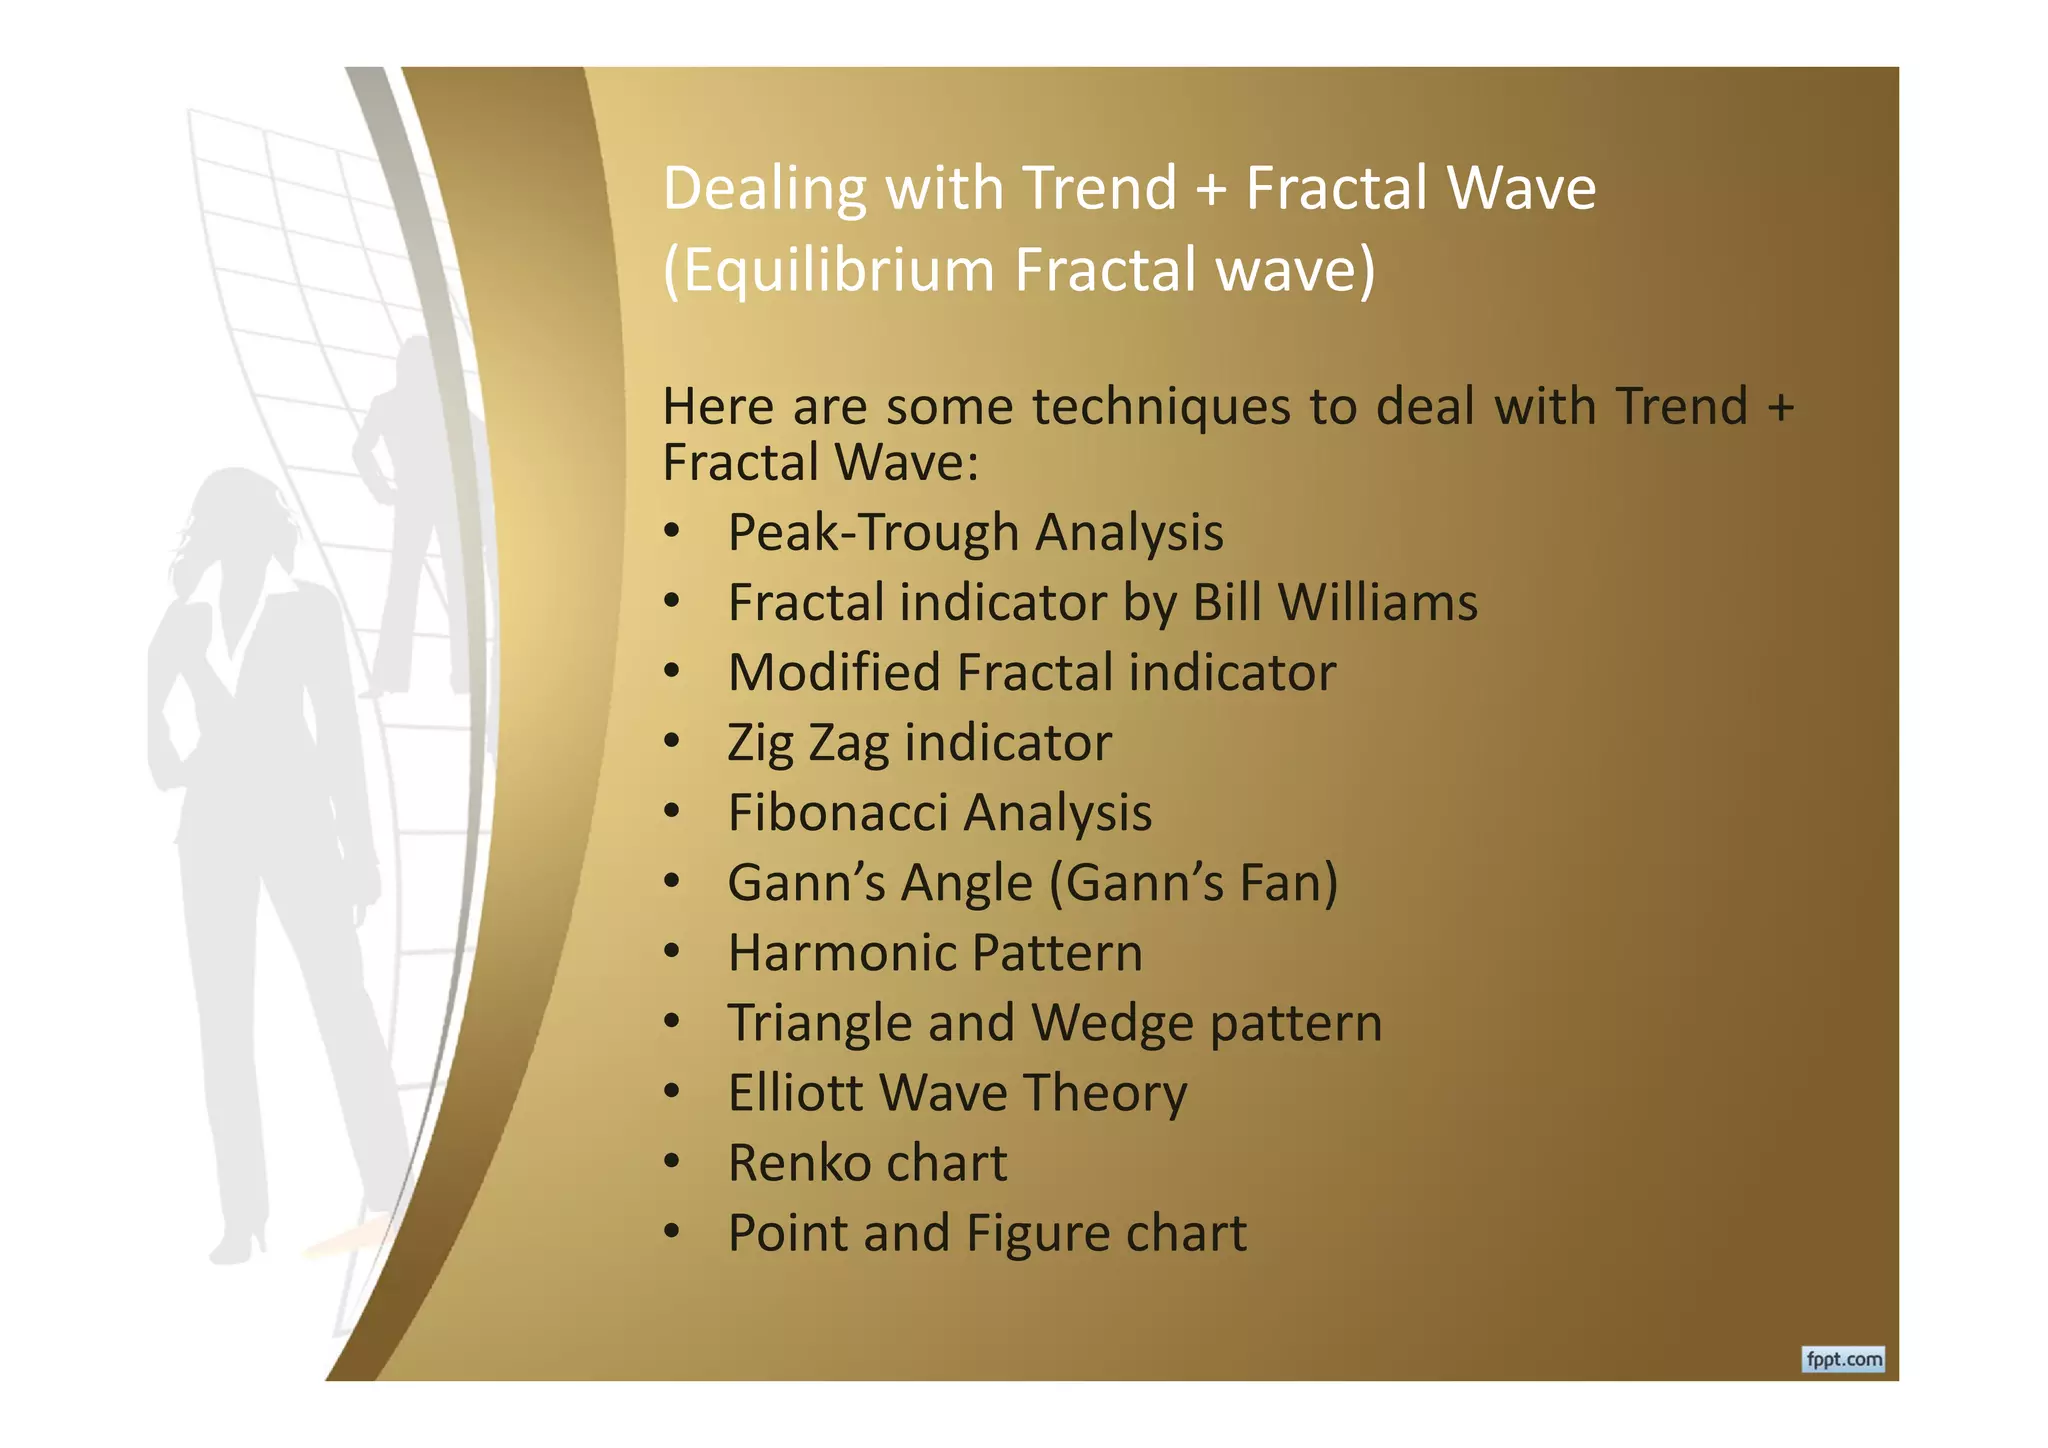
Searching for regularities in the financial markets
Introduction to Price Action and Pattern Trading Course
Presented By Young Ho Seo
www.Algotrading-Investment.com
Searching for regularities in the financial
markets
• Working trading strategy never comes
blindly. There are reason for it.
• Trading is all about using the
regularities existing in the financial
price series.
• After we learn the regularities in the
price series, we predict if market will
go down or up using this regularities.
This is the universal principle behind
any trading or investment strategy.
Searching for regularities in the financial
markets
• Now we have just understood that
searching regularities are the main
principle for our successful trading.
• Have you ever thought why you apply
MACD or RSI or Bollinger bands, Heat
map, Renko chart, etc for your trading
at least once?
• Or are you using them because you
just found bunches of articles teaching
you how to use them?
Searching for regularities in the financial
markets
• Simply you may not have much choice
because overwhelming number
articles are talking about those
techniques on the internet.
Searching for regularities in the financial
markets
• Before applying any trading strategy
blindly, you should think about what
kind of regularities we are dealing
with at least once?
• This can save you tons of money
before applying inappropriate trading
strategy for the wrong market.
Searching for regularities in the financial
markets
• Financial price series have traditionally
known regularities by traders and
scientists.
• These regularities are trend, seasonality
and cycle. Quite familiar, isn’t it? We are
not talking about rocket science here.
• Of course, randomness exist in the most
of financial price series besides trend,
seasonality and cycle. Therefore you
should always assume some randomness
in the price series even if I am not talking
about them.
Trend (or Equilibrium process)
• Just in case, you are not familiar with
these regularities. Let us recap.
• Trend is caused by the equilibrium
force to release the unbalance
between supply and demand. It is
probably most important element in
the financial market.
Trend (or Equilibrium process)
• Trend can take both linear and non
linear forms. Or There can be no trend
but just horizontal move only. The
trend can look like this. We only
presents rising trend here. For
declining trend, just flip the picture
vertically.
Seasonality
• Seasonality is a seasonal fluctuations
in the financial markets.
• Simple but little unrealistic example
would be the stock price of ice cream
company.
• For example, the stock price of ice
cream company can reach high during
summer and low during winter due to
the high demand during hot season.
Seasonality
• Seasonality can exists on their own
but they can be combined with trend
together like below. Sometimes,
seasonality can grow with time
(Multiplicative seasonality).
Cycles
• Cycles are similar to seasonality. Cycle
is a periodical fluctuation during fixed
time interval too. Sometimes several
cycles can be combined in one price
series.
Cycles
• Multiple cycles can look like this. Of
course, they can exist on their own
but they can be combine with trend.
When they are combined with trend,
they are called Equilibrium Wave
process.
Fractal Wave ( or Fractal Geometry)
• Besides the trend, seasonality and
cycle, we have the another form of
regularities called Fractal Wave.
• Fractal wave is simply the
representation of fractal geometry in
price series.
• Fractal wave in the financial price
series is characterized by repeating
self similar patterns in different scales.
Fractal Wave ( or Fractal Geometry)
• Of course, they can exist on their own.
But they can be combined with trend.
When they are combine with trend,
they are called Equilibrium Fractal
Wave process.
Searching for regularities in the financial
markets
• When we put trend, seasonality, cycle
and Fractal Wave together. These
regular components will form the
Price Pattern Table like this.
• This Price Pattern Table are simply the
collections of some known regularities
in the financial price series. As you can
see, they are not rocket science.
Searching for regularities in the financial
markets
• Here are some of the important
extension from this searching for
regularities topics.
• In real world price series, the financial
price series will always exhibit combined
behavior. Rare to see single behavior.
• For example,
a. trend + seasonality (Equilibrium
Wave process)
b. trend + multiple cycles (Equilibrium
Wave process)
c. trend + fractal wave (Equilibrium
Fractal Wave process)
Searching for regularities in the financial
markets
• Because of these combined effects,
trend based technical indicators like
moving average and any sort will often
fails to deal with real world financial
series.
• Some monthly price series might show
trend + seasonality (Equilibrium Wave
process). In general, seasonality are
weak for most of currency pairs and
stock prices.
Searching for regularities in the financial
markets
• Trend + multiple cycles or Trend +
fractal wave are probably more
common in financial price series.
• Both cases are much harder to deal
with comparing to Trend alone or
Trend + seasonality.
Searching for regularities in the financial
markets
• Simply because latter cases have more
number of cycles within the price
series, they are harder to deal with.
Check the picture below. (Equilibrium
process = trend)
Dealing with Trend + Multiple Cycles
(Equilibrium Wave)
Here are some techniques to deal with
Trend + Multiple cycles:
• Trend based technical indicator
• Relative Strength Indicator
• Commodity Channel index
• MACD as an oscillator
• General oscillator based technical
indicator
• Principle Component Analysis
• Wavelet transformation
• Fourier Transformation
• X-12 ARIMA from the US Bureau of the
Census
Dealing with Trend + Fractal Wave
(Equilibrium Fractal wave)
Here are some techniques to deal with Trend +
Fractal Wave:
• Peak-Trough Analysis
• Fractal indicator by Bill Williams
• Modified Fractal indicator
• Zig Zag indicator
• Fibonacci Analysis
• Gann’s Angle (Gann’s Fan)
• Harmonic Pattern
• Triangle and Wedge pattern
• Elliott Wave Theory
• Renko chart
• Point and Figure chart
Dealing with Trend + Fractal Wave
(Equilibrium Fractal-Wave)
• We can tell that many trading
strategies we have known in fact are
falling under the Equilibrium Fractal
Wave category.
• Those techniques capable of dealing
with equilibrium Fractal-Wave can be
considered as Price action and pattern
trading strategies.
• As you can tell, they are quite
distinctive from averaging or
smoothing based technical indicators.
Dealing with Trend + Fractal Wave
(Equilibrium Fractal-Wave)
• Especially following four techniques
are very important trading strategies
within the Price Action and Pattern
Trading Strategy:
1. Gann’s Angle (Gann’s Fan)
2. Harmonic Pattern
3. Triangle and Wedge pattern
4. Elliott Wave Theory
Dealing with Trend + Fractal Wave
(Equilibrium Fractal-Wave)
• At least, from now on, think what kind
of regularities you are dealing with.
Think about if you are using the right
tool for your trading.
• In the next part, we will focus on the
characteristics of Equilibrium Fractal-
Wave process and these four trading
strategies.
Dealing with Trend + Fractal Wave
(Equilibrium Fractal-Wave)
• Note that you can also read the book to
improve your Price Action and Pattern
Trading skills:
Price Action and Pattern Trading Course:
Theory to Practice with over 85 years of
Evidence (By Young Ho Seo)
You can also visit our website
www.Algotrading-Investment.com for
tools for Price Action and Pattern Trading
Strategy.
Dealing with Trend + Fractal Wave
(Equilibrium Fractal-Wave)
• Thanks for watching this slides until
the end.

Price action and pattern trading course intro

  • 1.
    Searching for regularitiesin the financial markets Introduction to Price Action and Pattern Trading Course Presented By Young Ho Seo www.Algotrading-Investment.com
  • 2.
    Searching for regularitiesin the financial markets • Working trading strategy never comes blindly. There are reason for it. • Trading is all about using the regularities existing in the financial price series. • After we learn the regularities in the price series, we predict if market will go down or up using this regularities. This is the universal principle behind any trading or investment strategy.
  • 3.
    Searching for regularitiesin the financial markets • Now we have just understood that searching regularities are the main principle for our successful trading. • Have you ever thought why you apply MACD or RSI or Bollinger bands, Heat map, Renko chart, etc for your trading at least once? • Or are you using them because you just found bunches of articles teaching you how to use them?
  • 4.
    Searching for regularitiesin the financial markets • Simply you may not have much choice because overwhelming number articles are talking about those techniques on the internet.
  • 5.
    Searching for regularitiesin the financial markets • Before applying any trading strategy blindly, you should think about what kind of regularities we are dealing with at least once? • This can save you tons of money before applying inappropriate trading strategy for the wrong market.
  • 6.
    Searching for regularitiesin the financial markets • Financial price series have traditionally known regularities by traders and scientists. • These regularities are trend, seasonality and cycle. Quite familiar, isn’t it? We are not talking about rocket science here. • Of course, randomness exist in the most of financial price series besides trend, seasonality and cycle. Therefore you should always assume some randomness in the price series even if I am not talking about them.
  • 7.
    Trend (or Equilibriumprocess) • Just in case, you are not familiar with these regularities. Let us recap. • Trend is caused by the equilibrium force to release the unbalance between supply and demand. It is probably most important element in the financial market.
  • 8.
    Trend (or Equilibriumprocess) • Trend can take both linear and non linear forms. Or There can be no trend but just horizontal move only. The trend can look like this. We only presents rising trend here. For declining trend, just flip the picture vertically.
  • 10.
    Seasonality • Seasonality isa seasonal fluctuations in the financial markets. • Simple but little unrealistic example would be the stock price of ice cream company. • For example, the stock price of ice cream company can reach high during summer and low during winter due to the high demand during hot season.
  • 11.
    Seasonality • Seasonality canexists on their own but they can be combined with trend together like below. Sometimes, seasonality can grow with time (Multiplicative seasonality).
  • 13.
    Cycles • Cycles aresimilar to seasonality. Cycle is a periodical fluctuation during fixed time interval too. Sometimes several cycles can be combined in one price series.
  • 14.
    Cycles • Multiple cyclescan look like this. Of course, they can exist on their own but they can be combine with trend. When they are combined with trend, they are called Equilibrium Wave process.
  • 16.
    Fractal Wave (or Fractal Geometry) • Besides the trend, seasonality and cycle, we have the another form of regularities called Fractal Wave. • Fractal wave is simply the representation of fractal geometry in price series. • Fractal wave in the financial price series is characterized by repeating self similar patterns in different scales.
  • 17.
    Fractal Wave (or Fractal Geometry) • Of course, they can exist on their own. But they can be combined with trend. When they are combine with trend, they are called Equilibrium Fractal Wave process.
  • 19.
    Searching for regularitiesin the financial markets • When we put trend, seasonality, cycle and Fractal Wave together. These regular components will form the Price Pattern Table like this. • This Price Pattern Table are simply the collections of some known regularities in the financial price series. As you can see, they are not rocket science.
  • 21.
    Searching for regularitiesin the financial markets • Here are some of the important extension from this searching for regularities topics. • In real world price series, the financial price series will always exhibit combined behavior. Rare to see single behavior. • For example, a. trend + seasonality (Equilibrium Wave process) b. trend + multiple cycles (Equilibrium Wave process) c. trend + fractal wave (Equilibrium Fractal Wave process)
  • 22.
    Searching for regularitiesin the financial markets • Because of these combined effects, trend based technical indicators like moving average and any sort will often fails to deal with real world financial series. • Some monthly price series might show trend + seasonality (Equilibrium Wave process). In general, seasonality are weak for most of currency pairs and stock prices.
  • 23.
    Searching for regularitiesin the financial markets • Trend + multiple cycles or Trend + fractal wave are probably more common in financial price series. • Both cases are much harder to deal with comparing to Trend alone or Trend + seasonality.
  • 24.
    Searching for regularitiesin the financial markets • Simply because latter cases have more number of cycles within the price series, they are harder to deal with. Check the picture below. (Equilibrium process = trend)
  • 25.
    Dealing with Trend+ Multiple Cycles (Equilibrium Wave) Here are some techniques to deal with Trend + Multiple cycles: • Trend based technical indicator • Relative Strength Indicator • Commodity Channel index • MACD as an oscillator • General oscillator based technical indicator • Principle Component Analysis • Wavelet transformation • Fourier Transformation • X-12 ARIMA from the US Bureau of the Census
  • 26.
    Dealing with Trend+ Fractal Wave (Equilibrium Fractal wave) Here are some techniques to deal with Trend + Fractal Wave: • Peak-Trough Analysis • Fractal indicator by Bill Williams • Modified Fractal indicator • Zig Zag indicator • Fibonacci Analysis • Gann’s Angle (Gann’s Fan) • Harmonic Pattern • Triangle and Wedge pattern • Elliott Wave Theory • Renko chart • Point and Figure chart
  • 27.
    Dealing with Trend+ Fractal Wave (Equilibrium Fractal-Wave) • We can tell that many trading strategies we have known in fact are falling under the Equilibrium Fractal Wave category. • Those techniques capable of dealing with equilibrium Fractal-Wave can be considered as Price action and pattern trading strategies. • As you can tell, they are quite distinctive from averaging or smoothing based technical indicators.
  • 28.
    Dealing with Trend+ Fractal Wave (Equilibrium Fractal-Wave) • Especially following four techniques are very important trading strategies within the Price Action and Pattern Trading Strategy: 1. Gann’s Angle (Gann’s Fan) 2. Harmonic Pattern 3. Triangle and Wedge pattern 4. Elliott Wave Theory
  • 29.
    Dealing with Trend+ Fractal Wave (Equilibrium Fractal-Wave) • At least, from now on, think what kind of regularities you are dealing with. Think about if you are using the right tool for your trading. • In the next part, we will focus on the characteristics of Equilibrium Fractal- Wave process and these four trading strategies.
  • 30.
    Dealing with Trend+ Fractal Wave (Equilibrium Fractal-Wave) • Note that you can also read the book to improve your Price Action and Pattern Trading skills: Price Action and Pattern Trading Course: Theory to Practice with over 85 years of Evidence (By Young Ho Seo) You can also visit our website www.Algotrading-Investment.com for tools for Price Action and Pattern Trading Strategy.
  • 31.
    Dealing with Trend+ Fractal Wave (Equilibrium Fractal-Wave) • Thanks for watching this slides until the end.