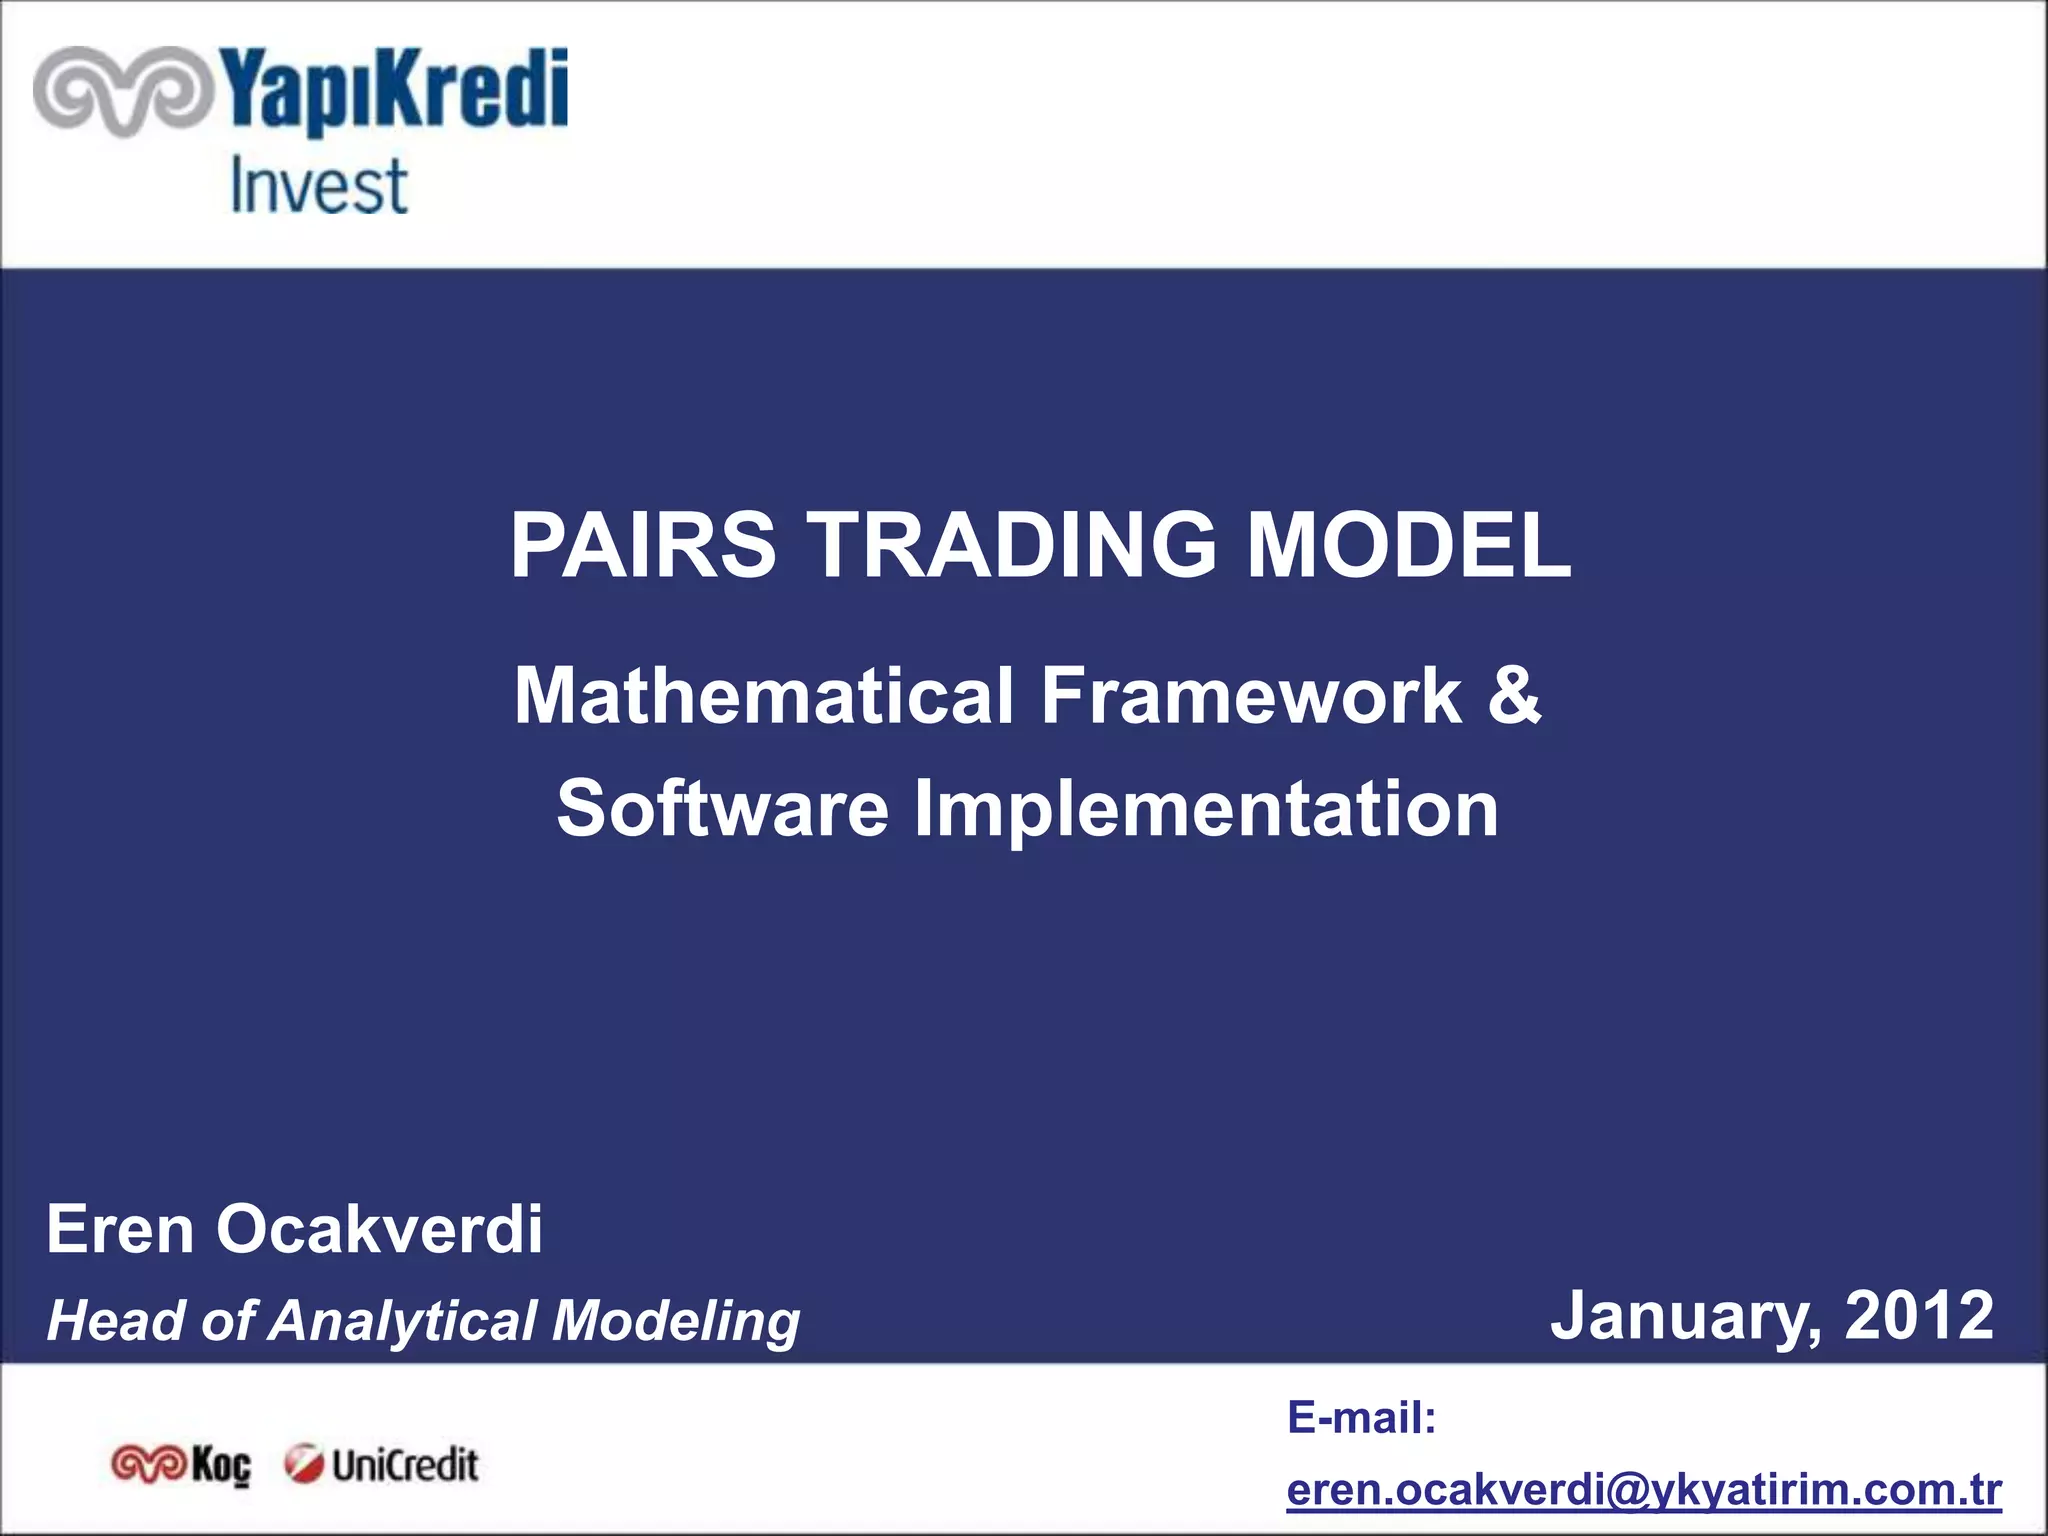
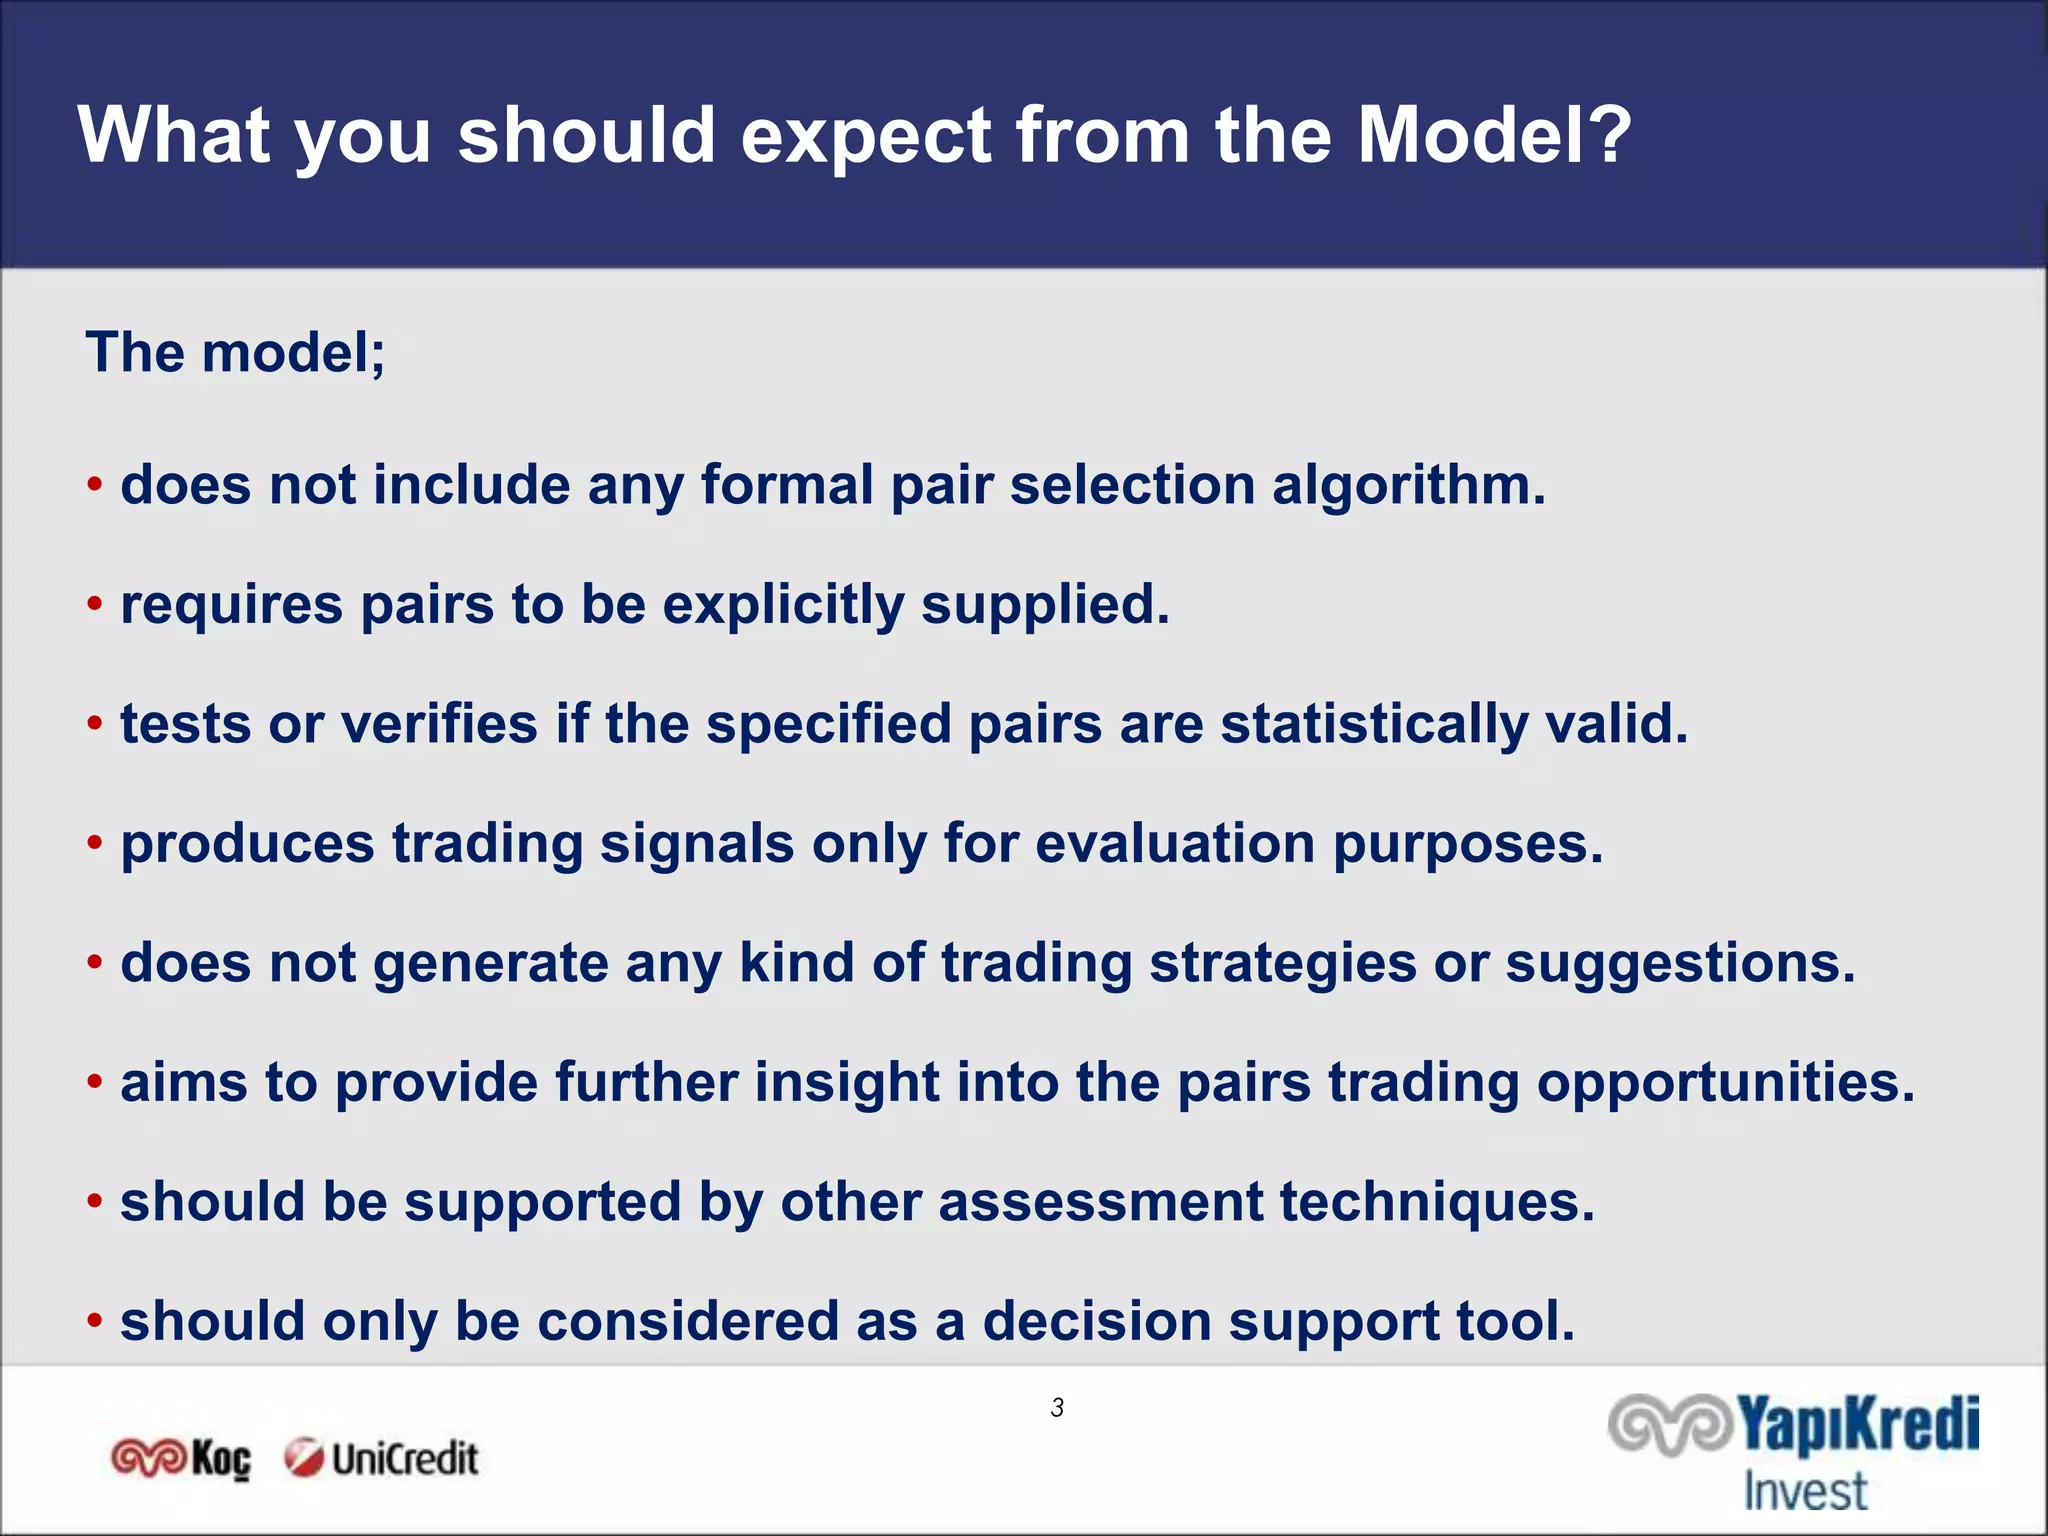
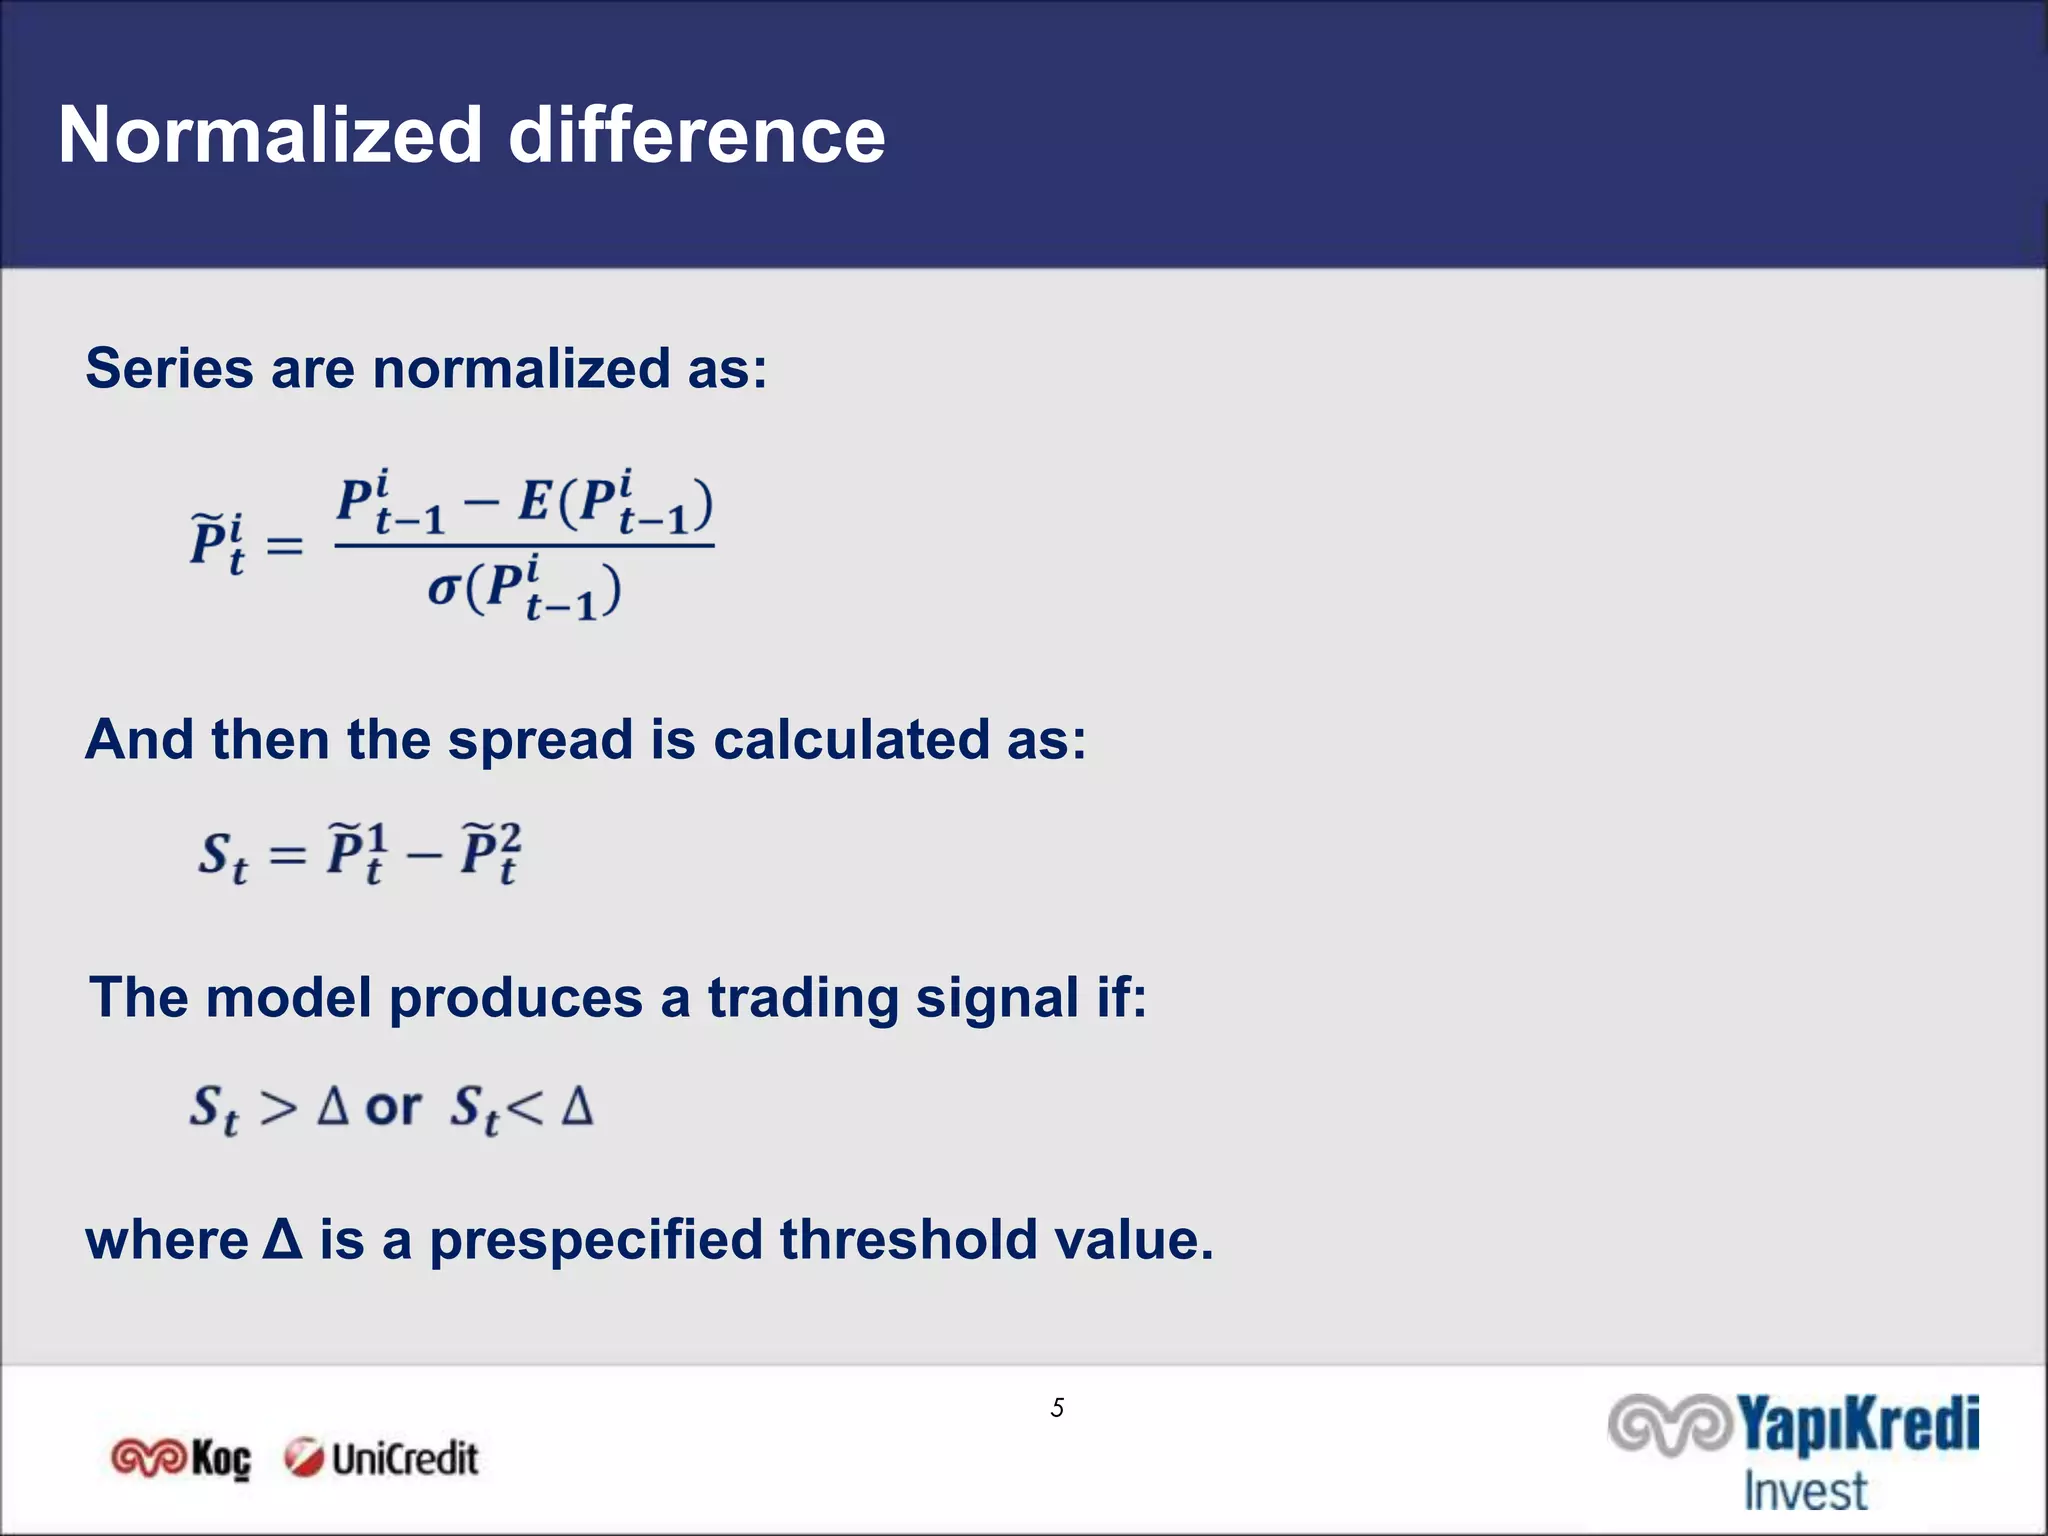
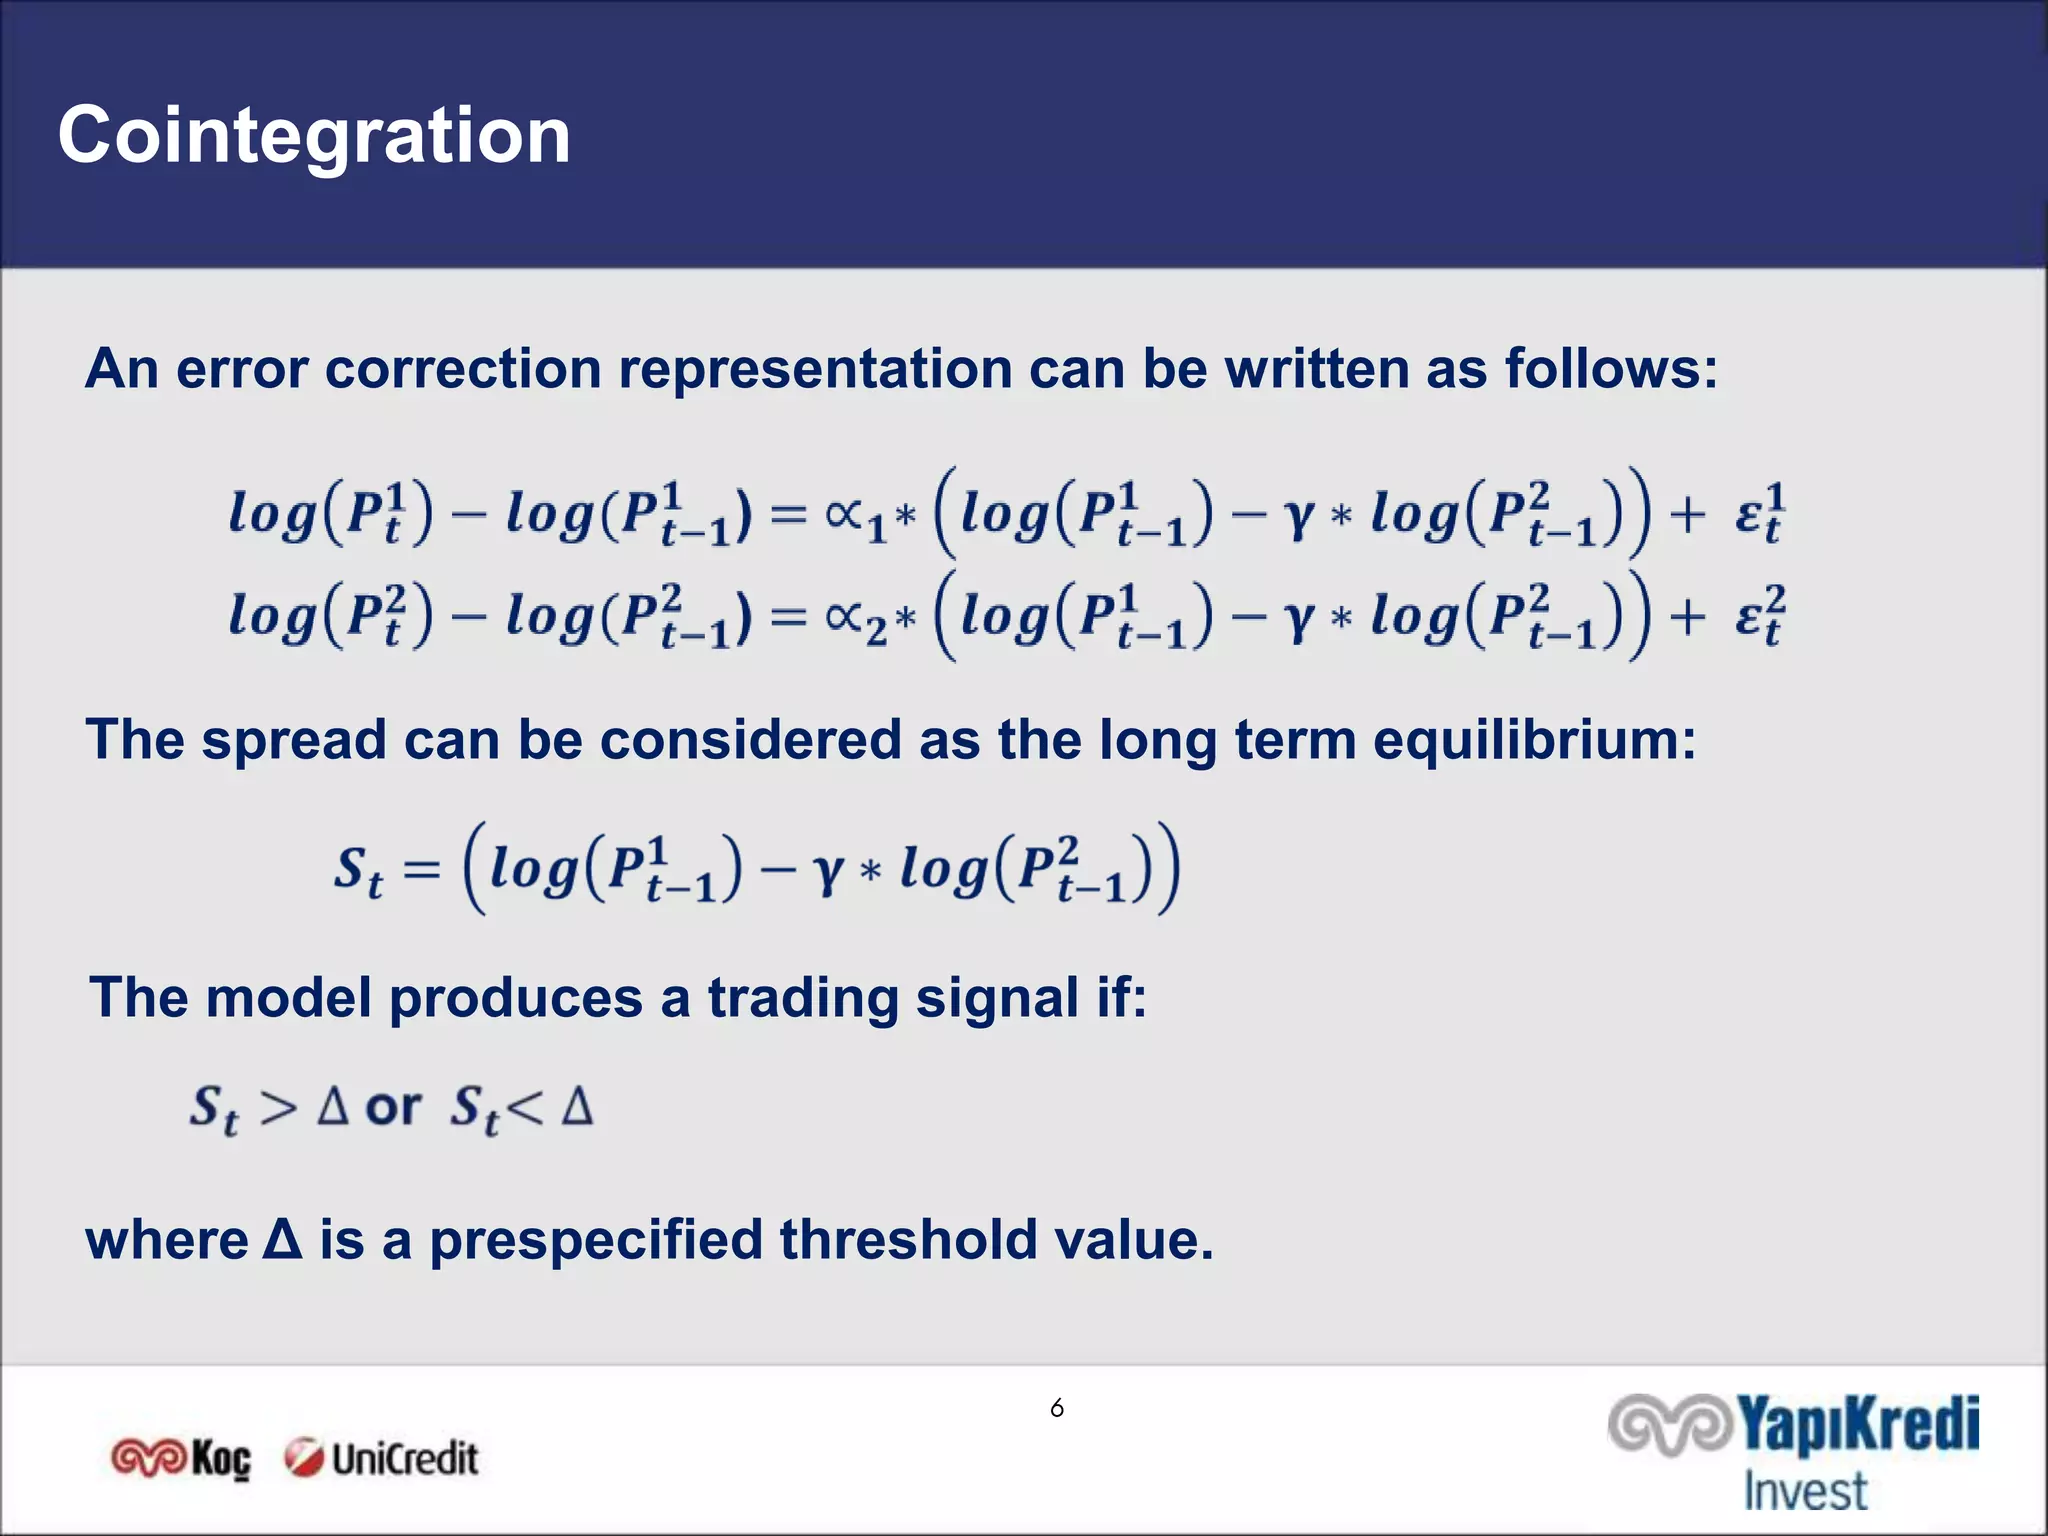
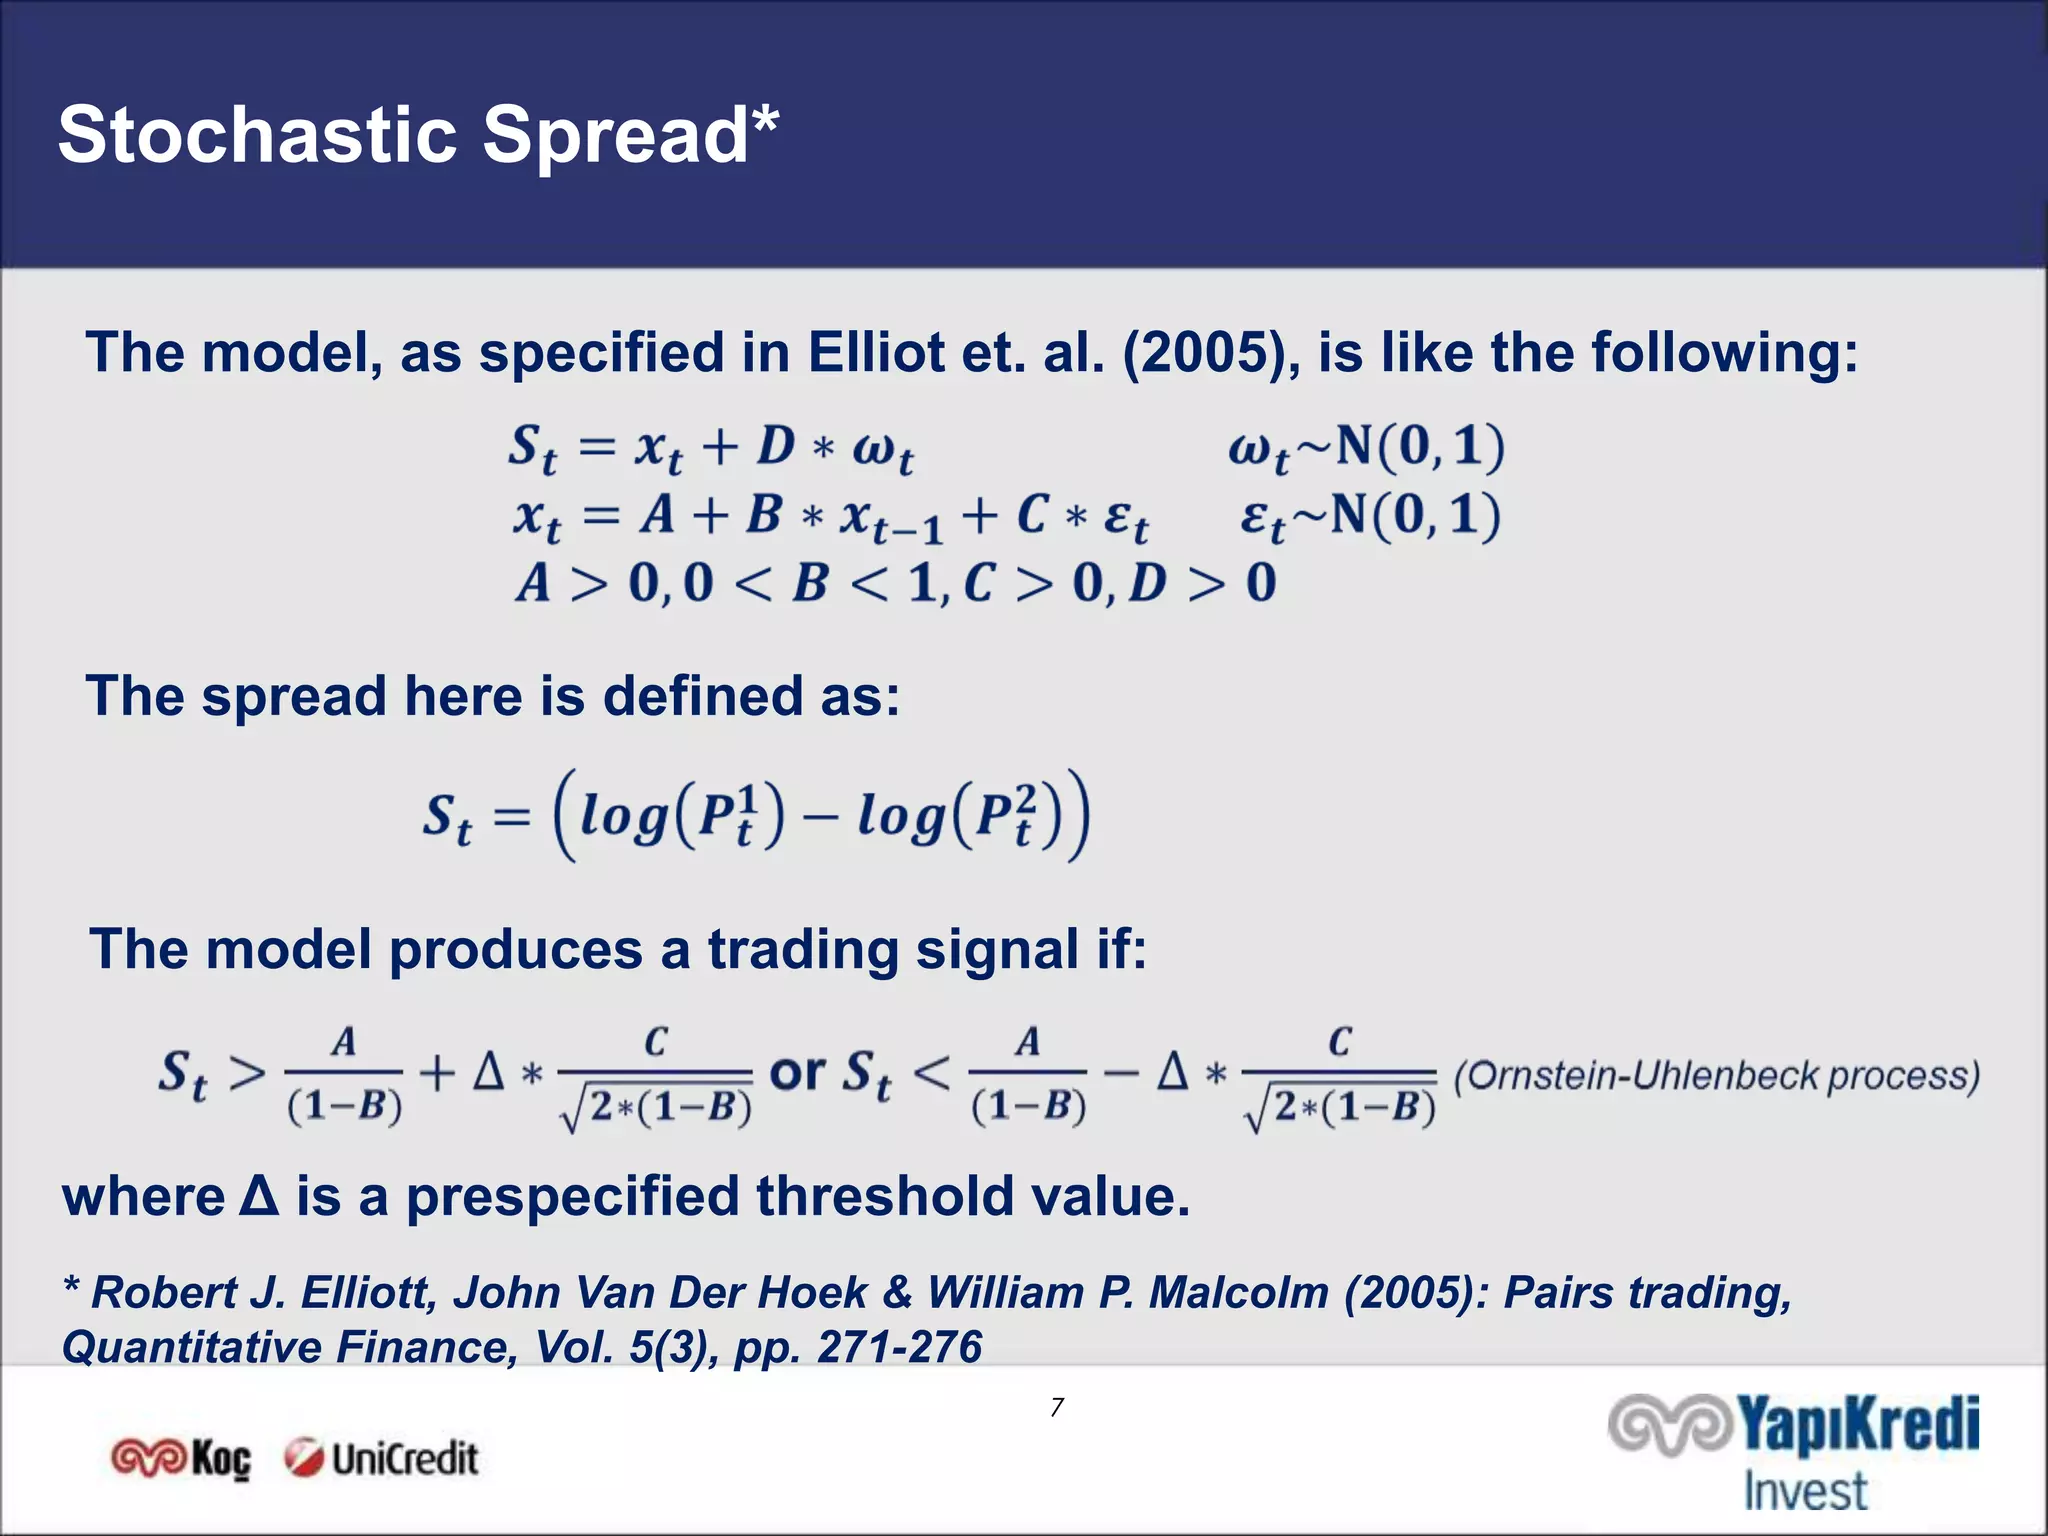
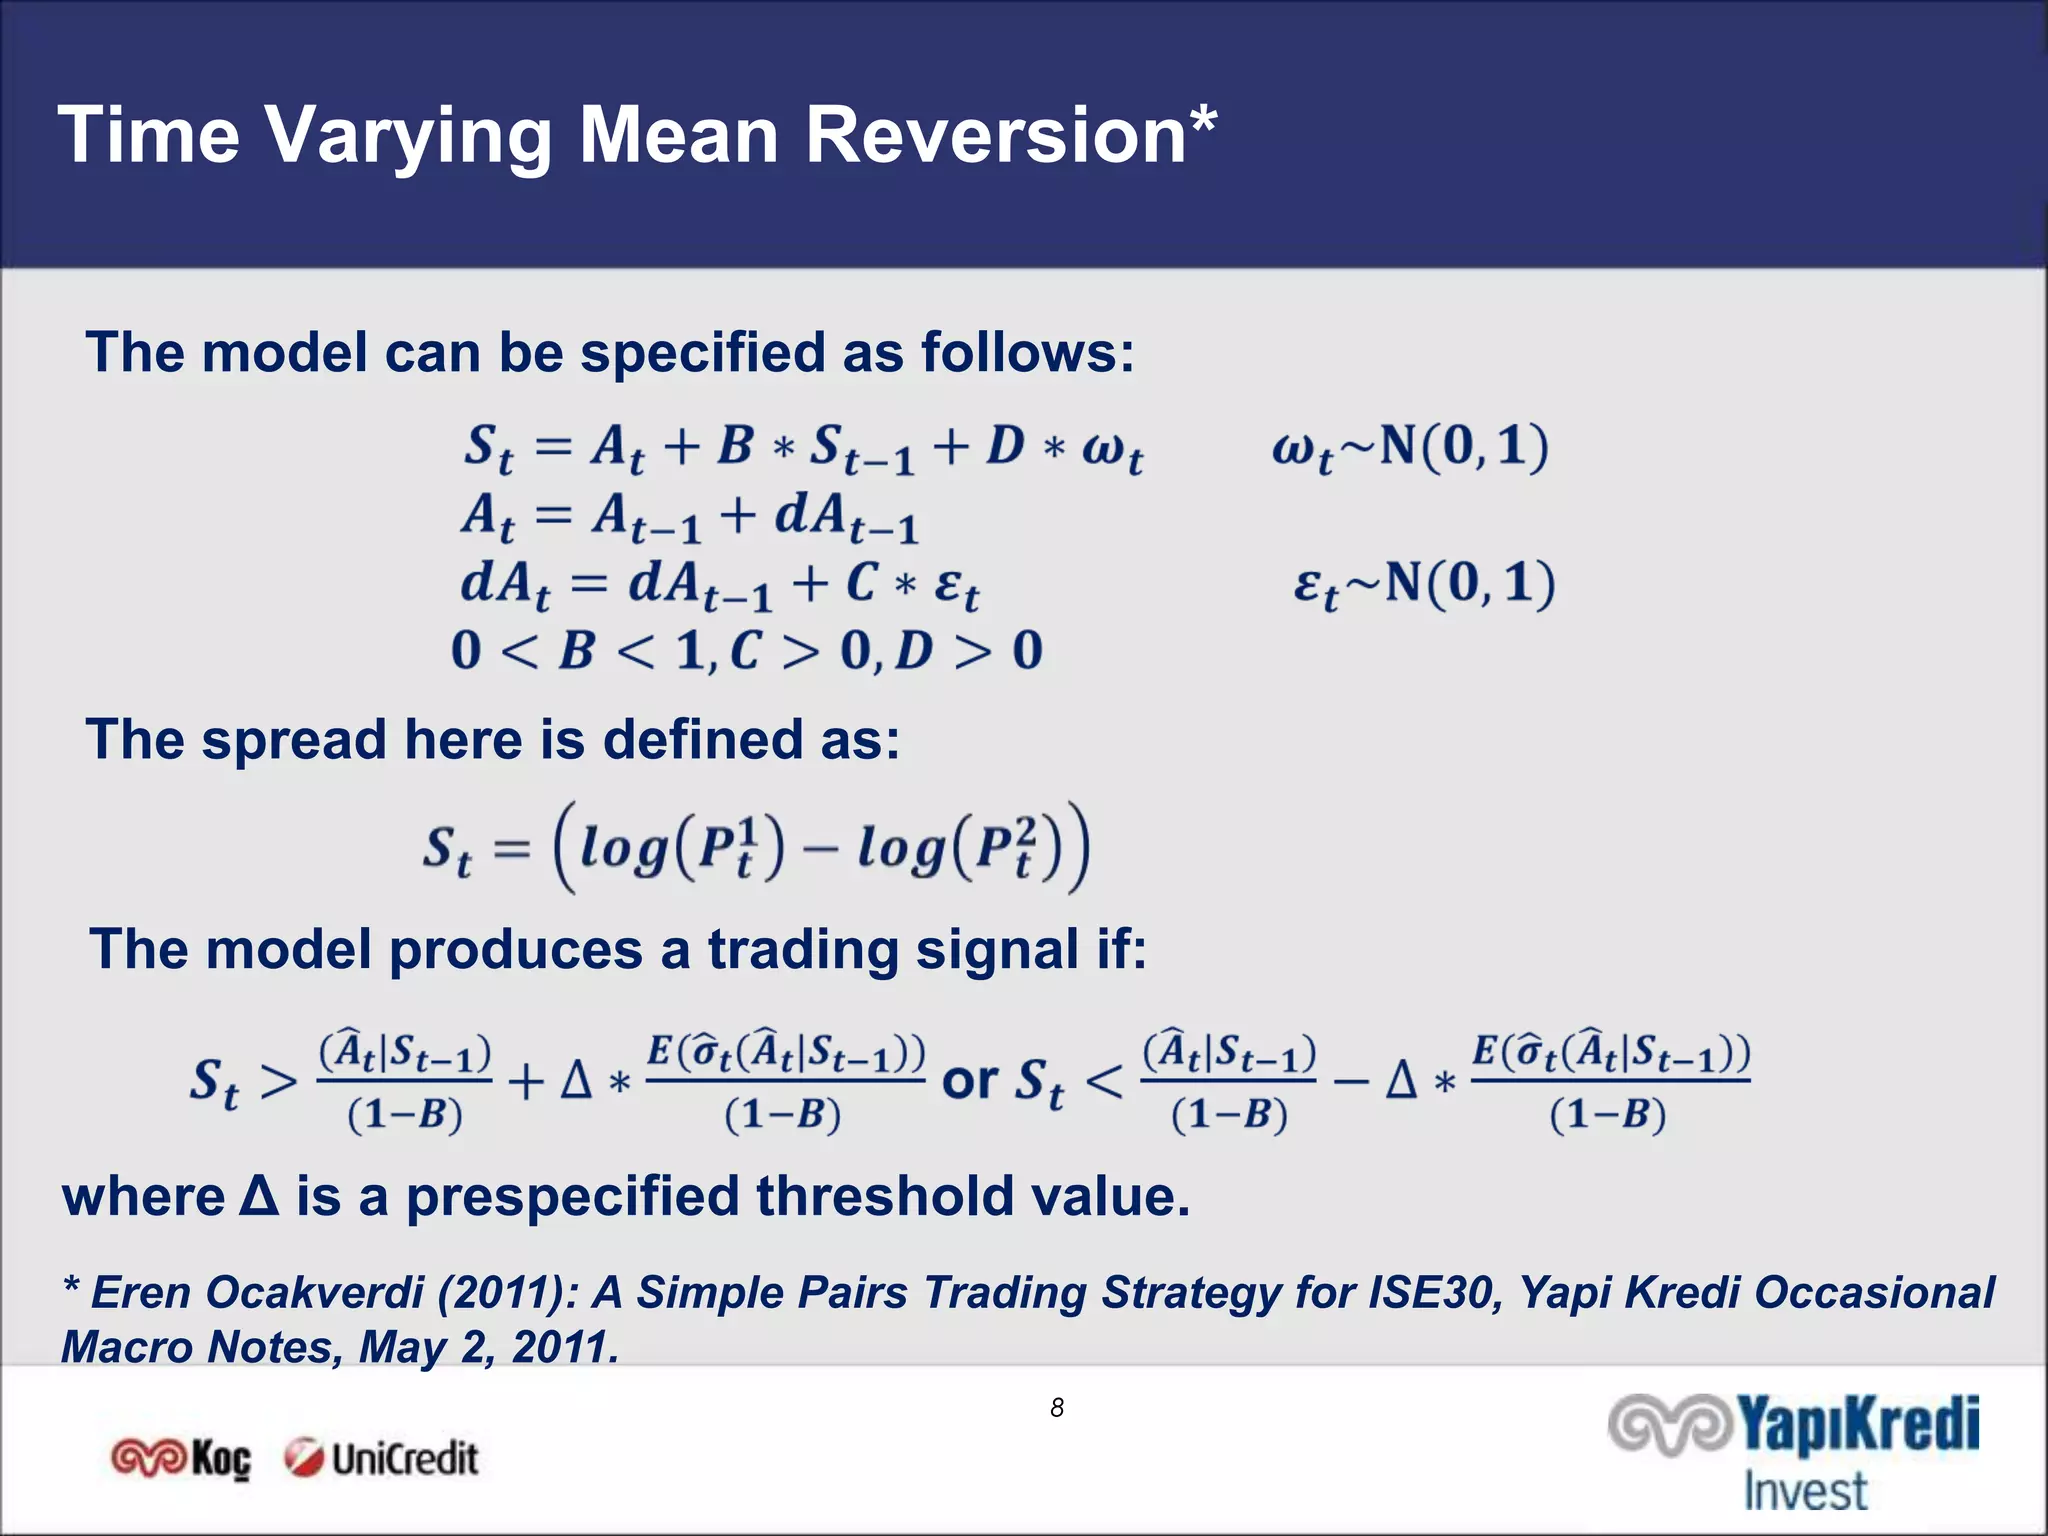
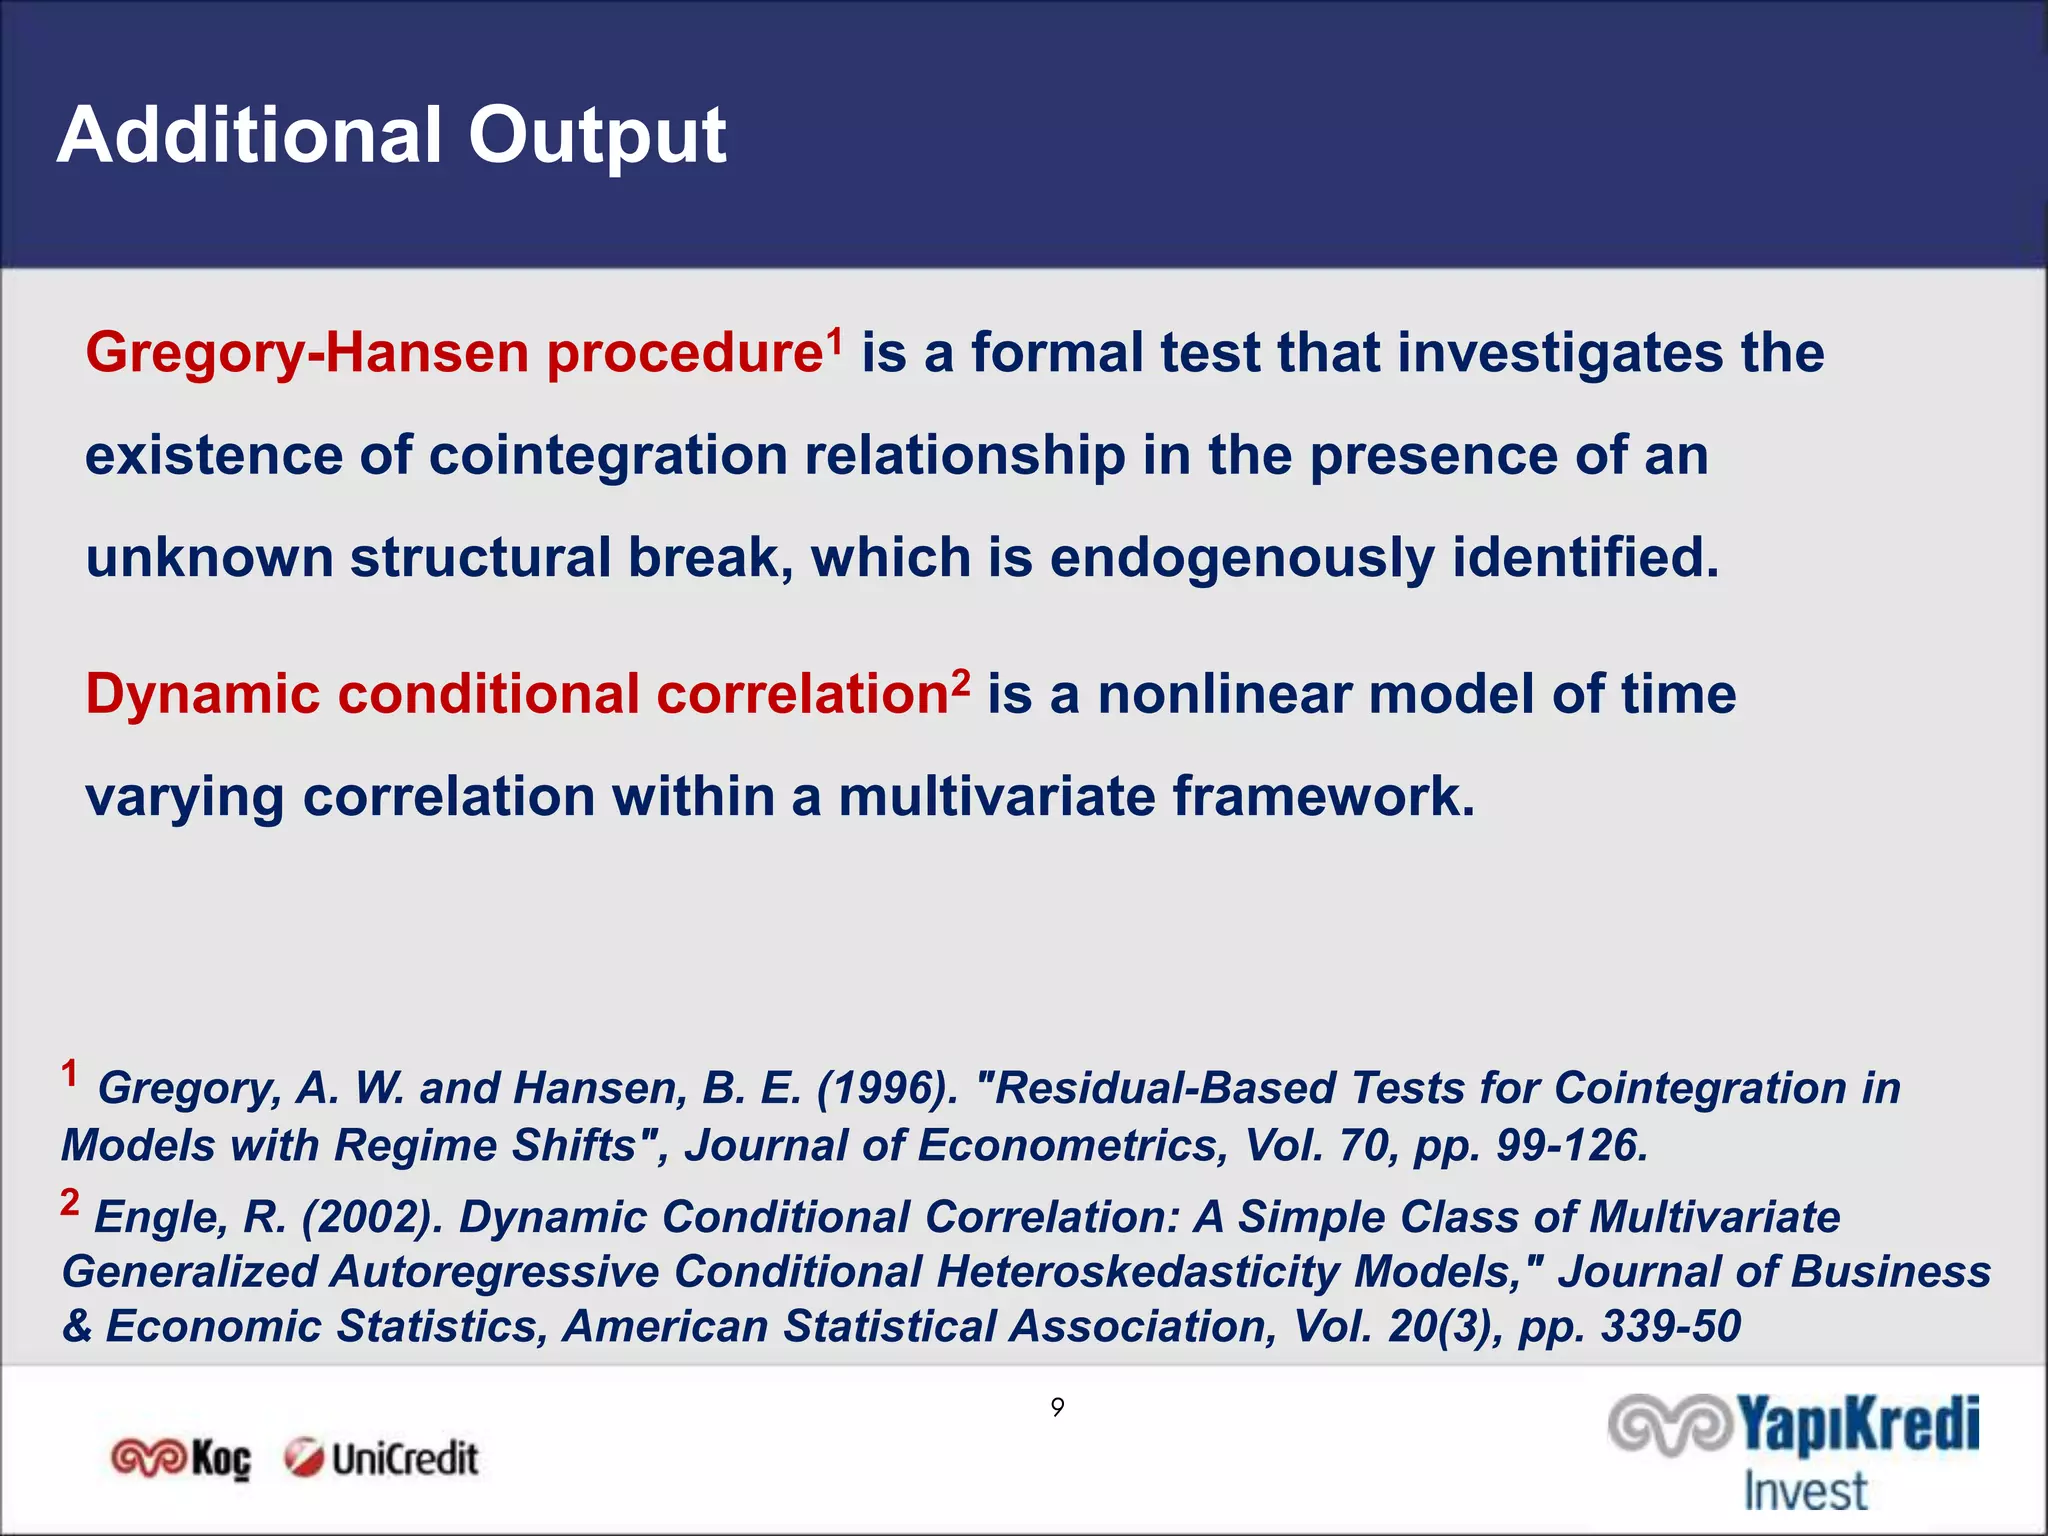
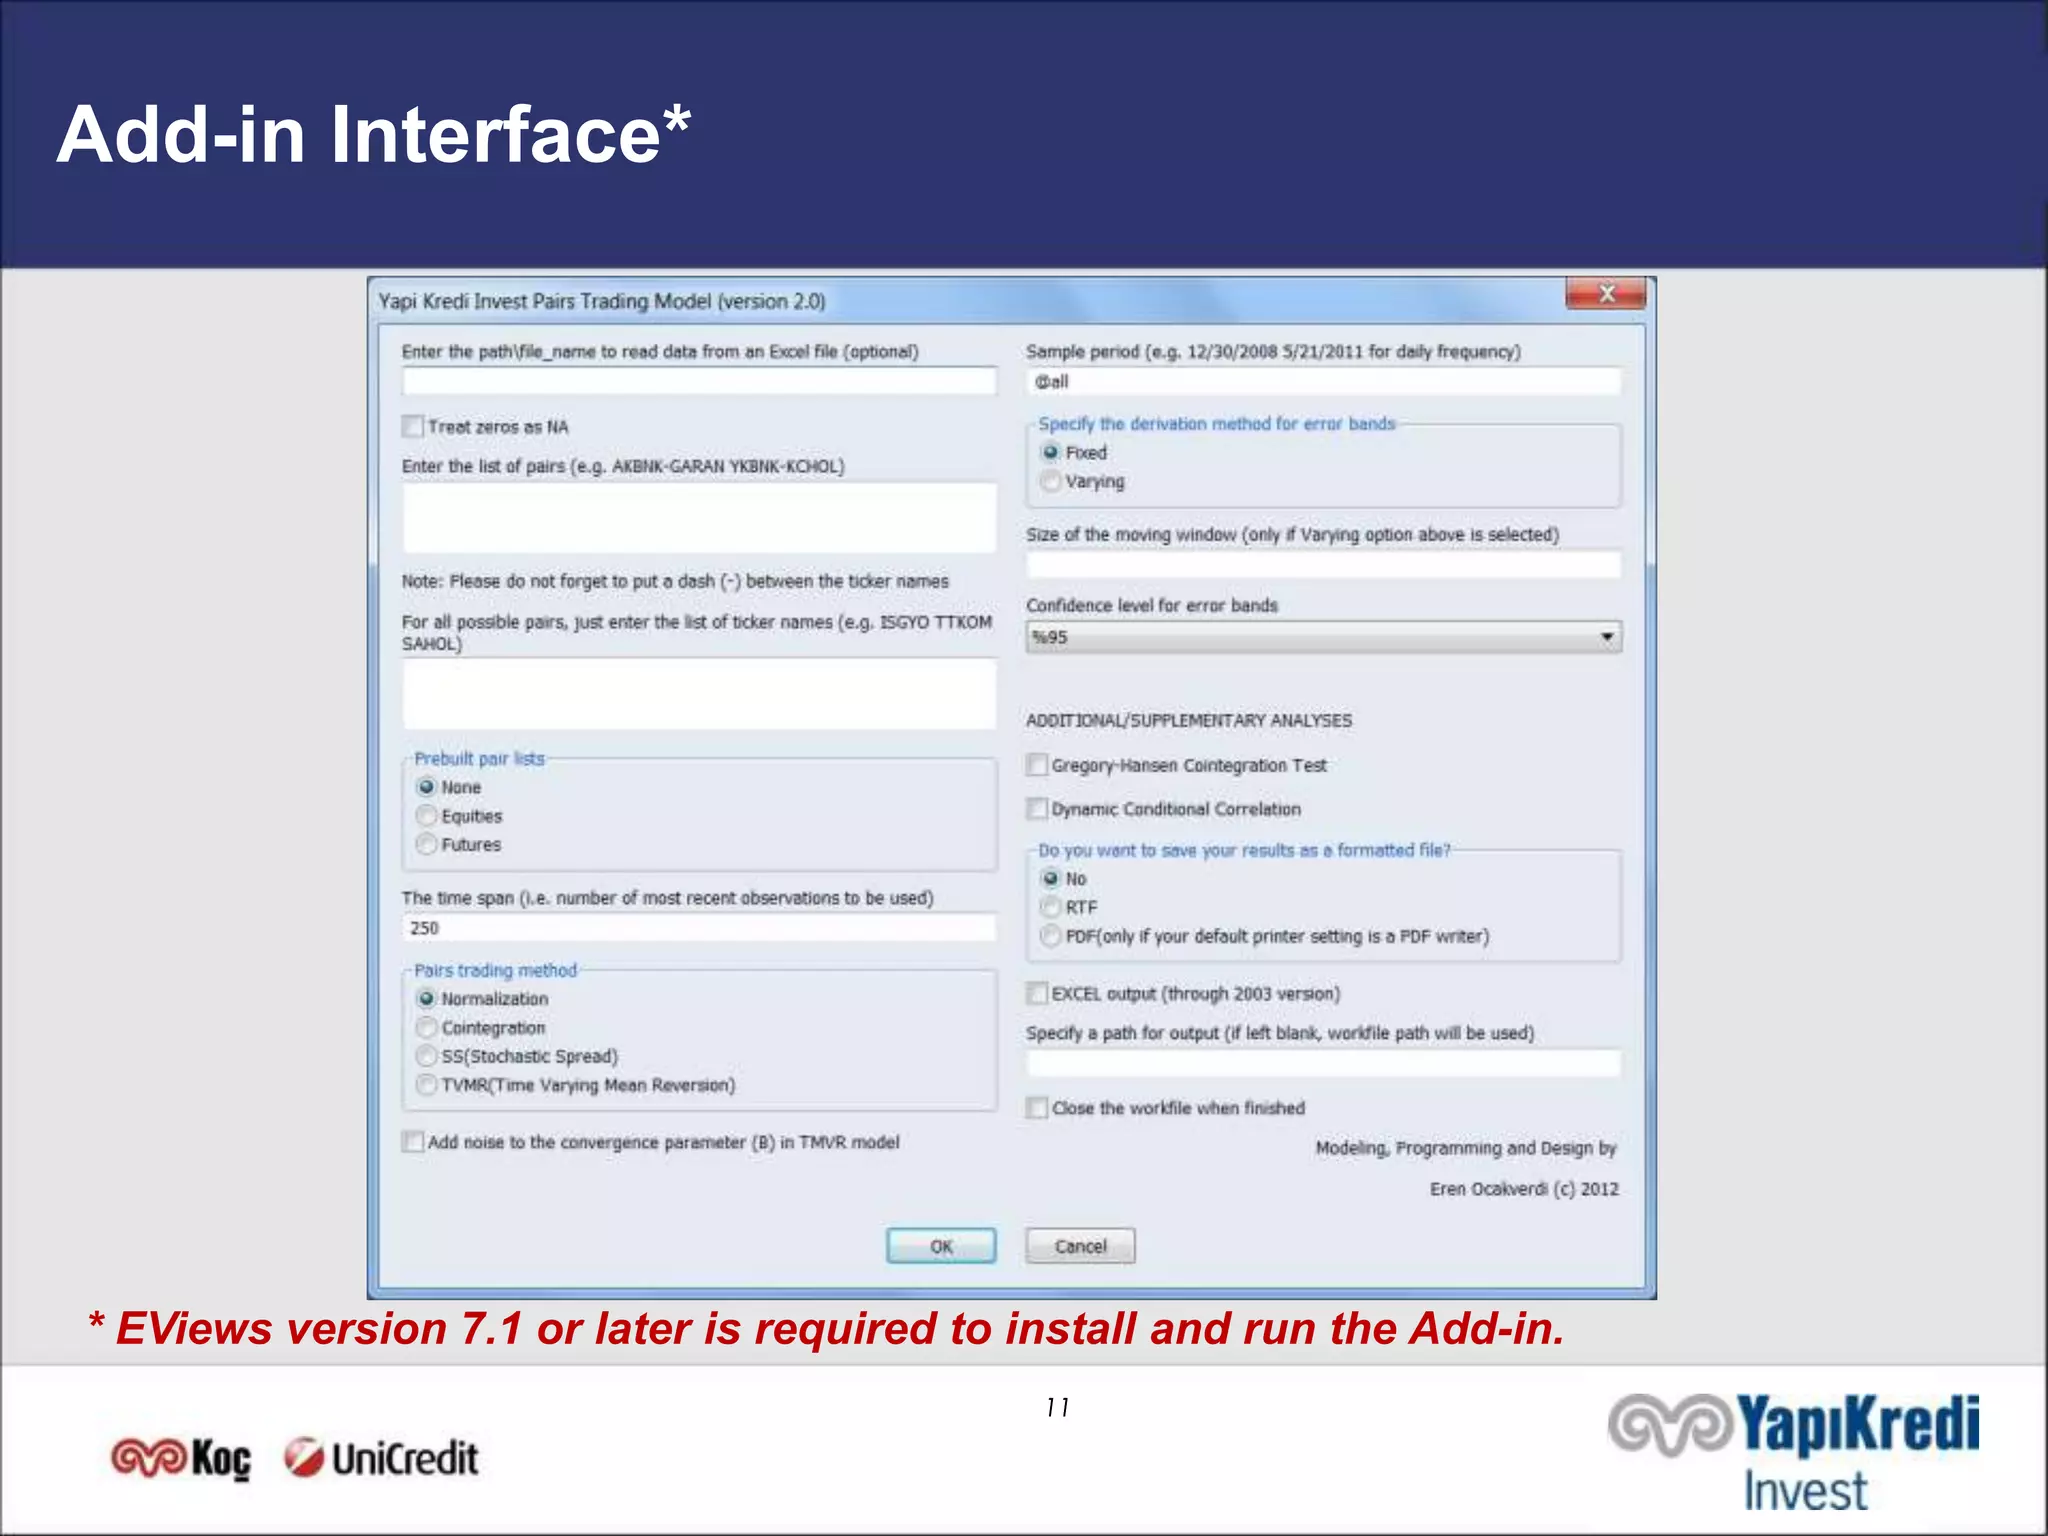
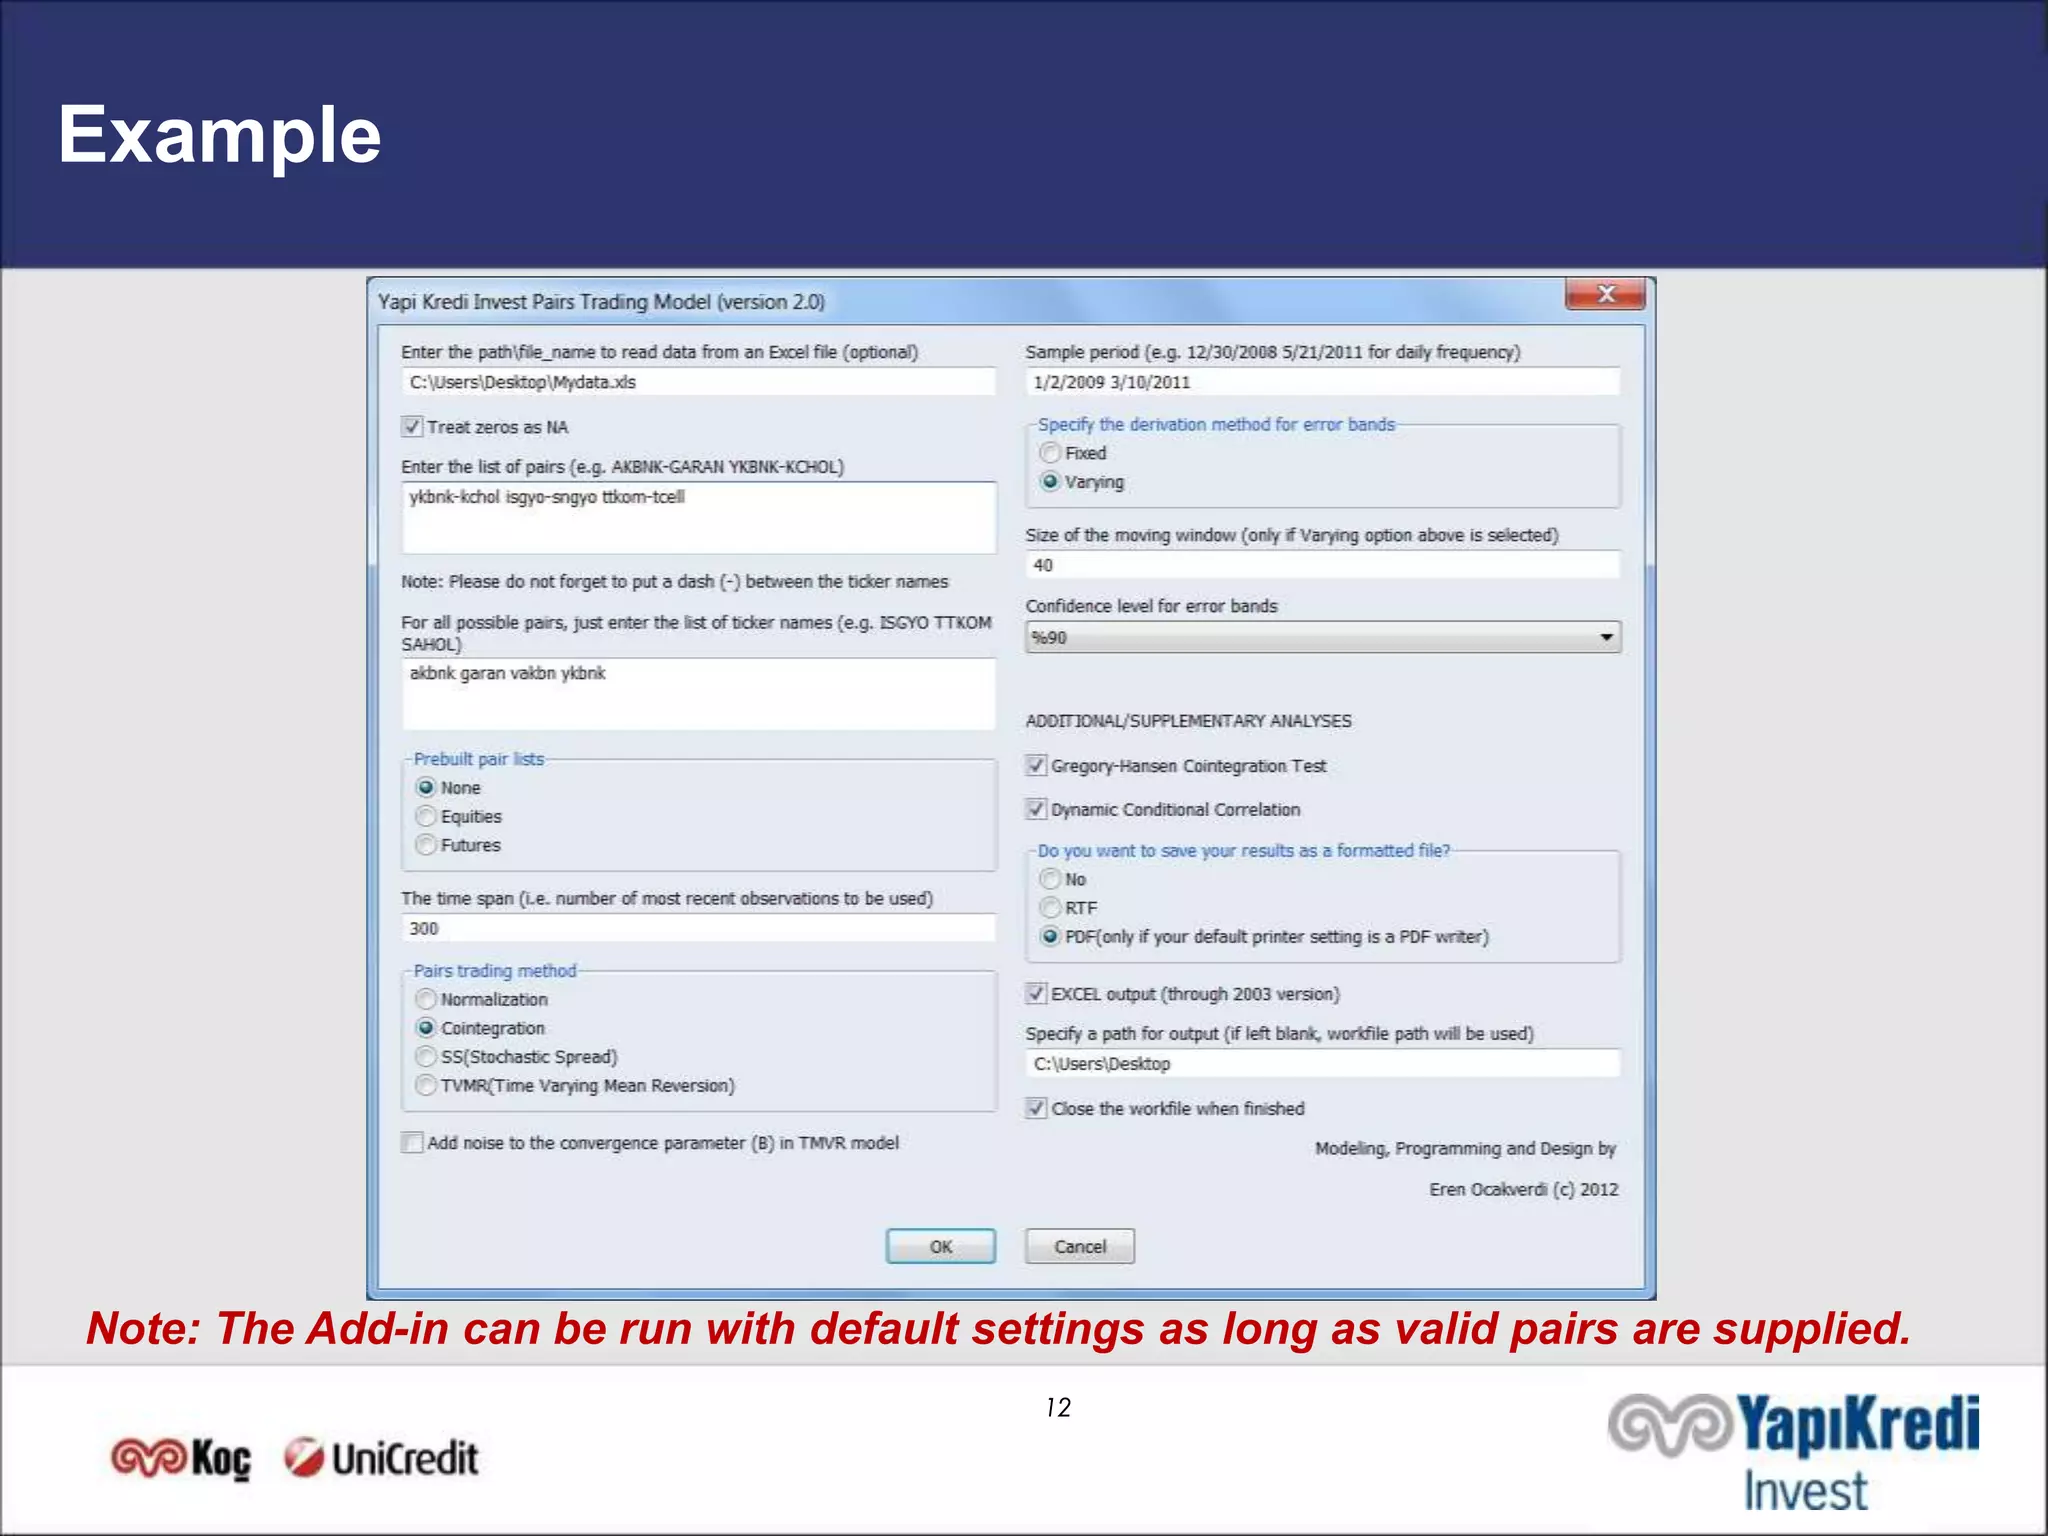
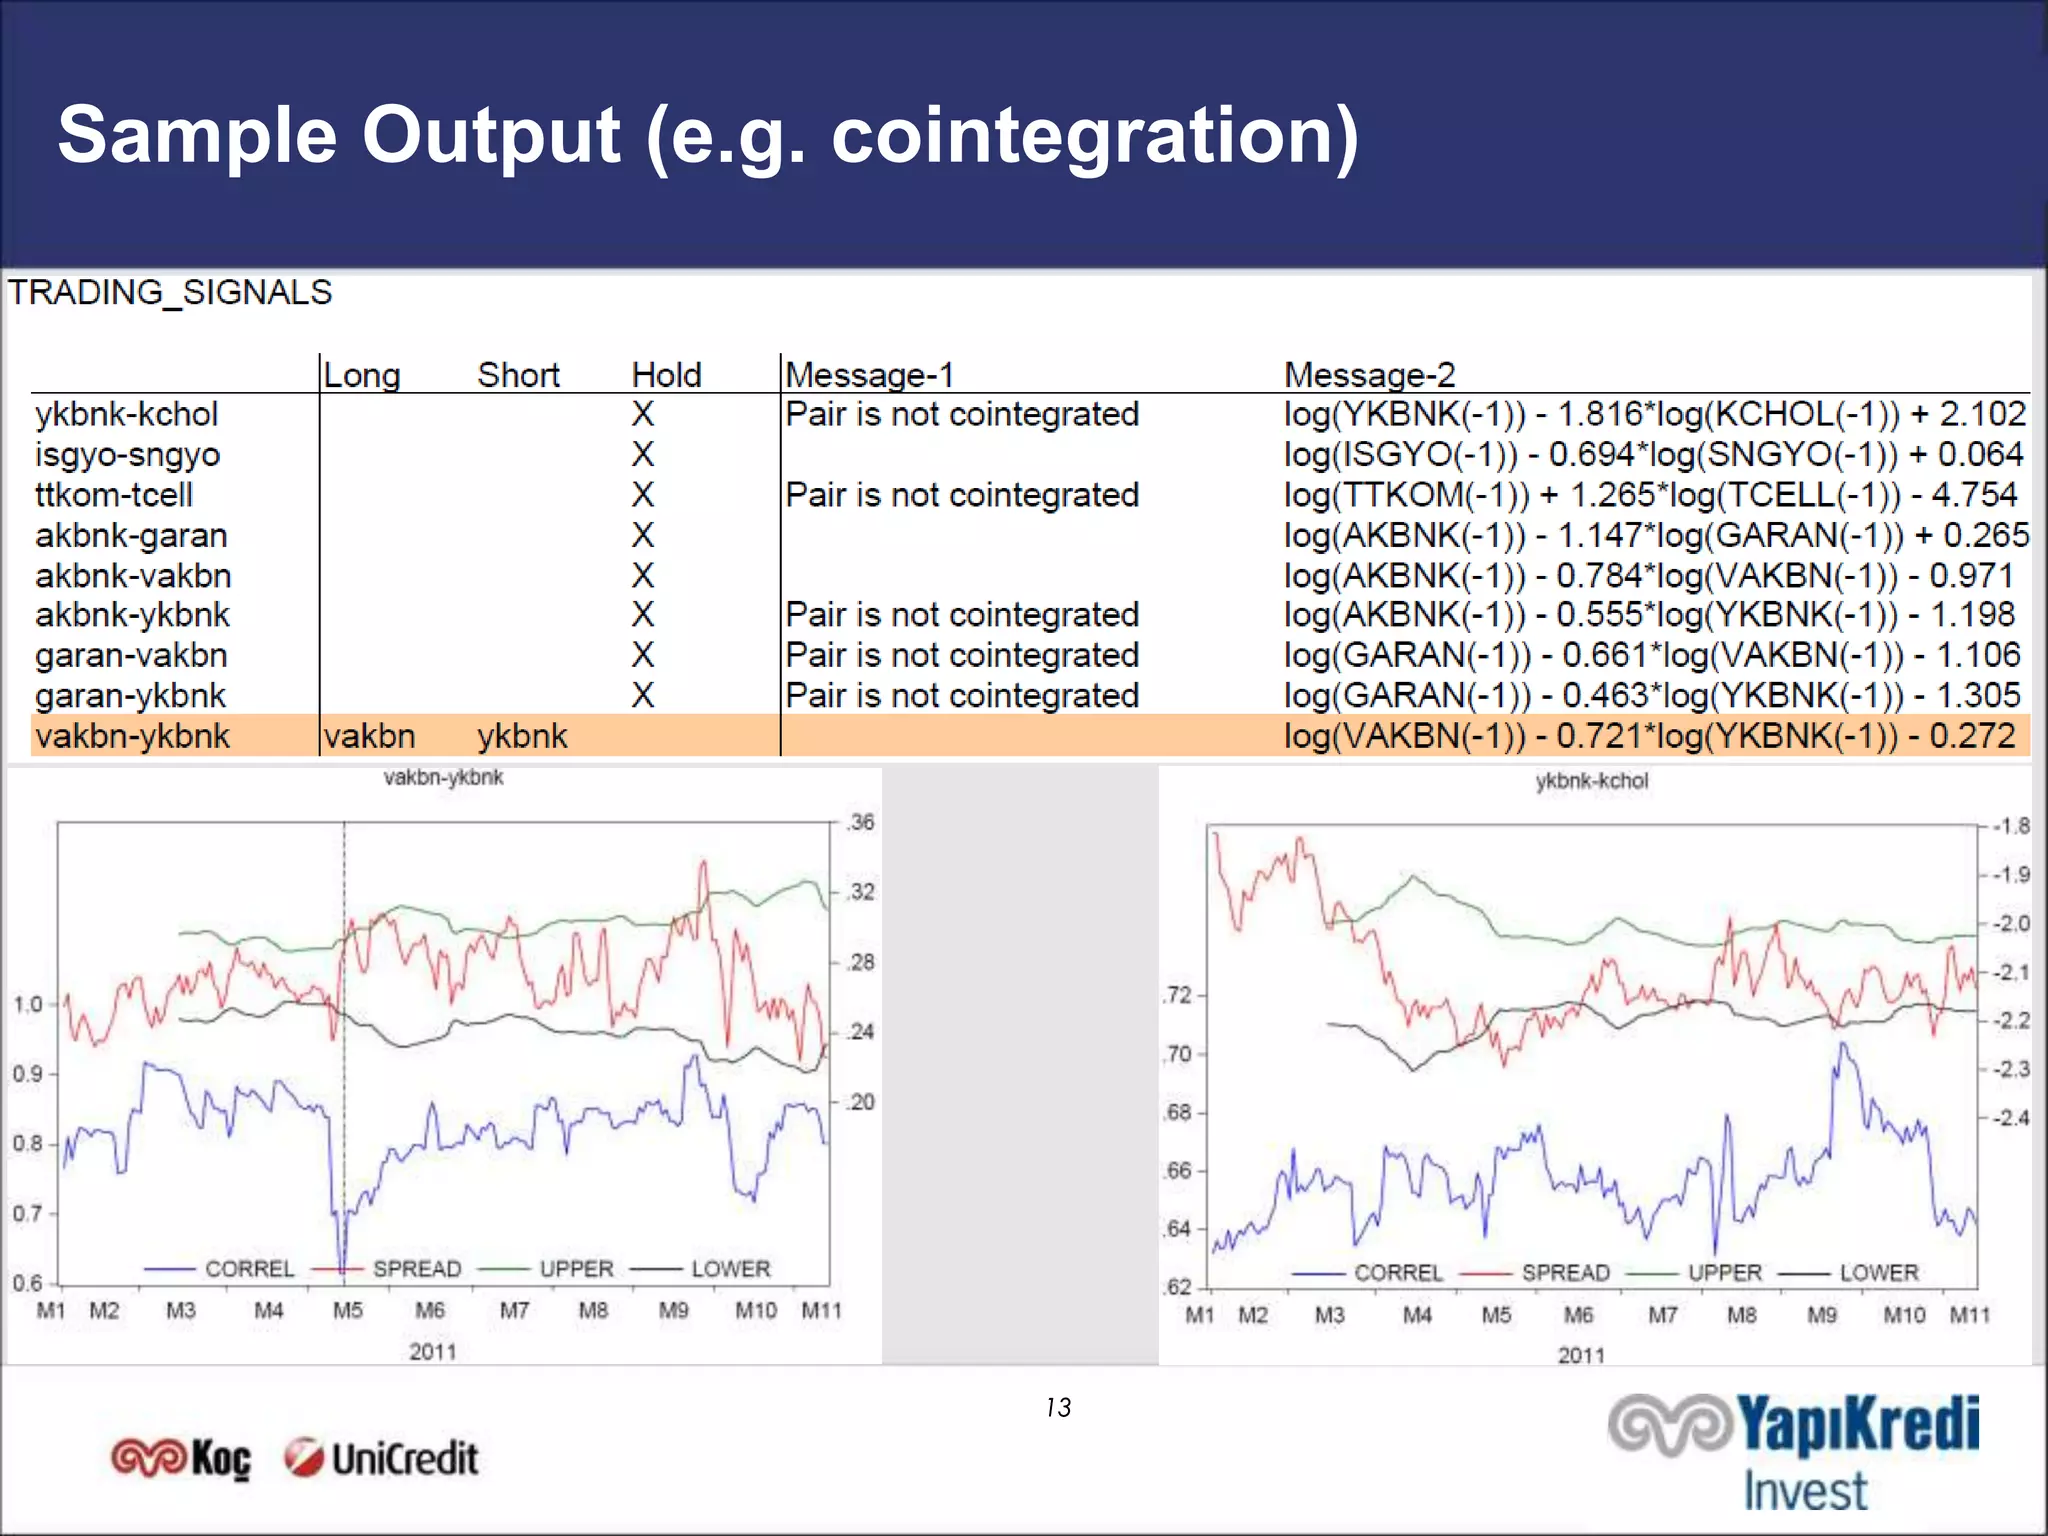
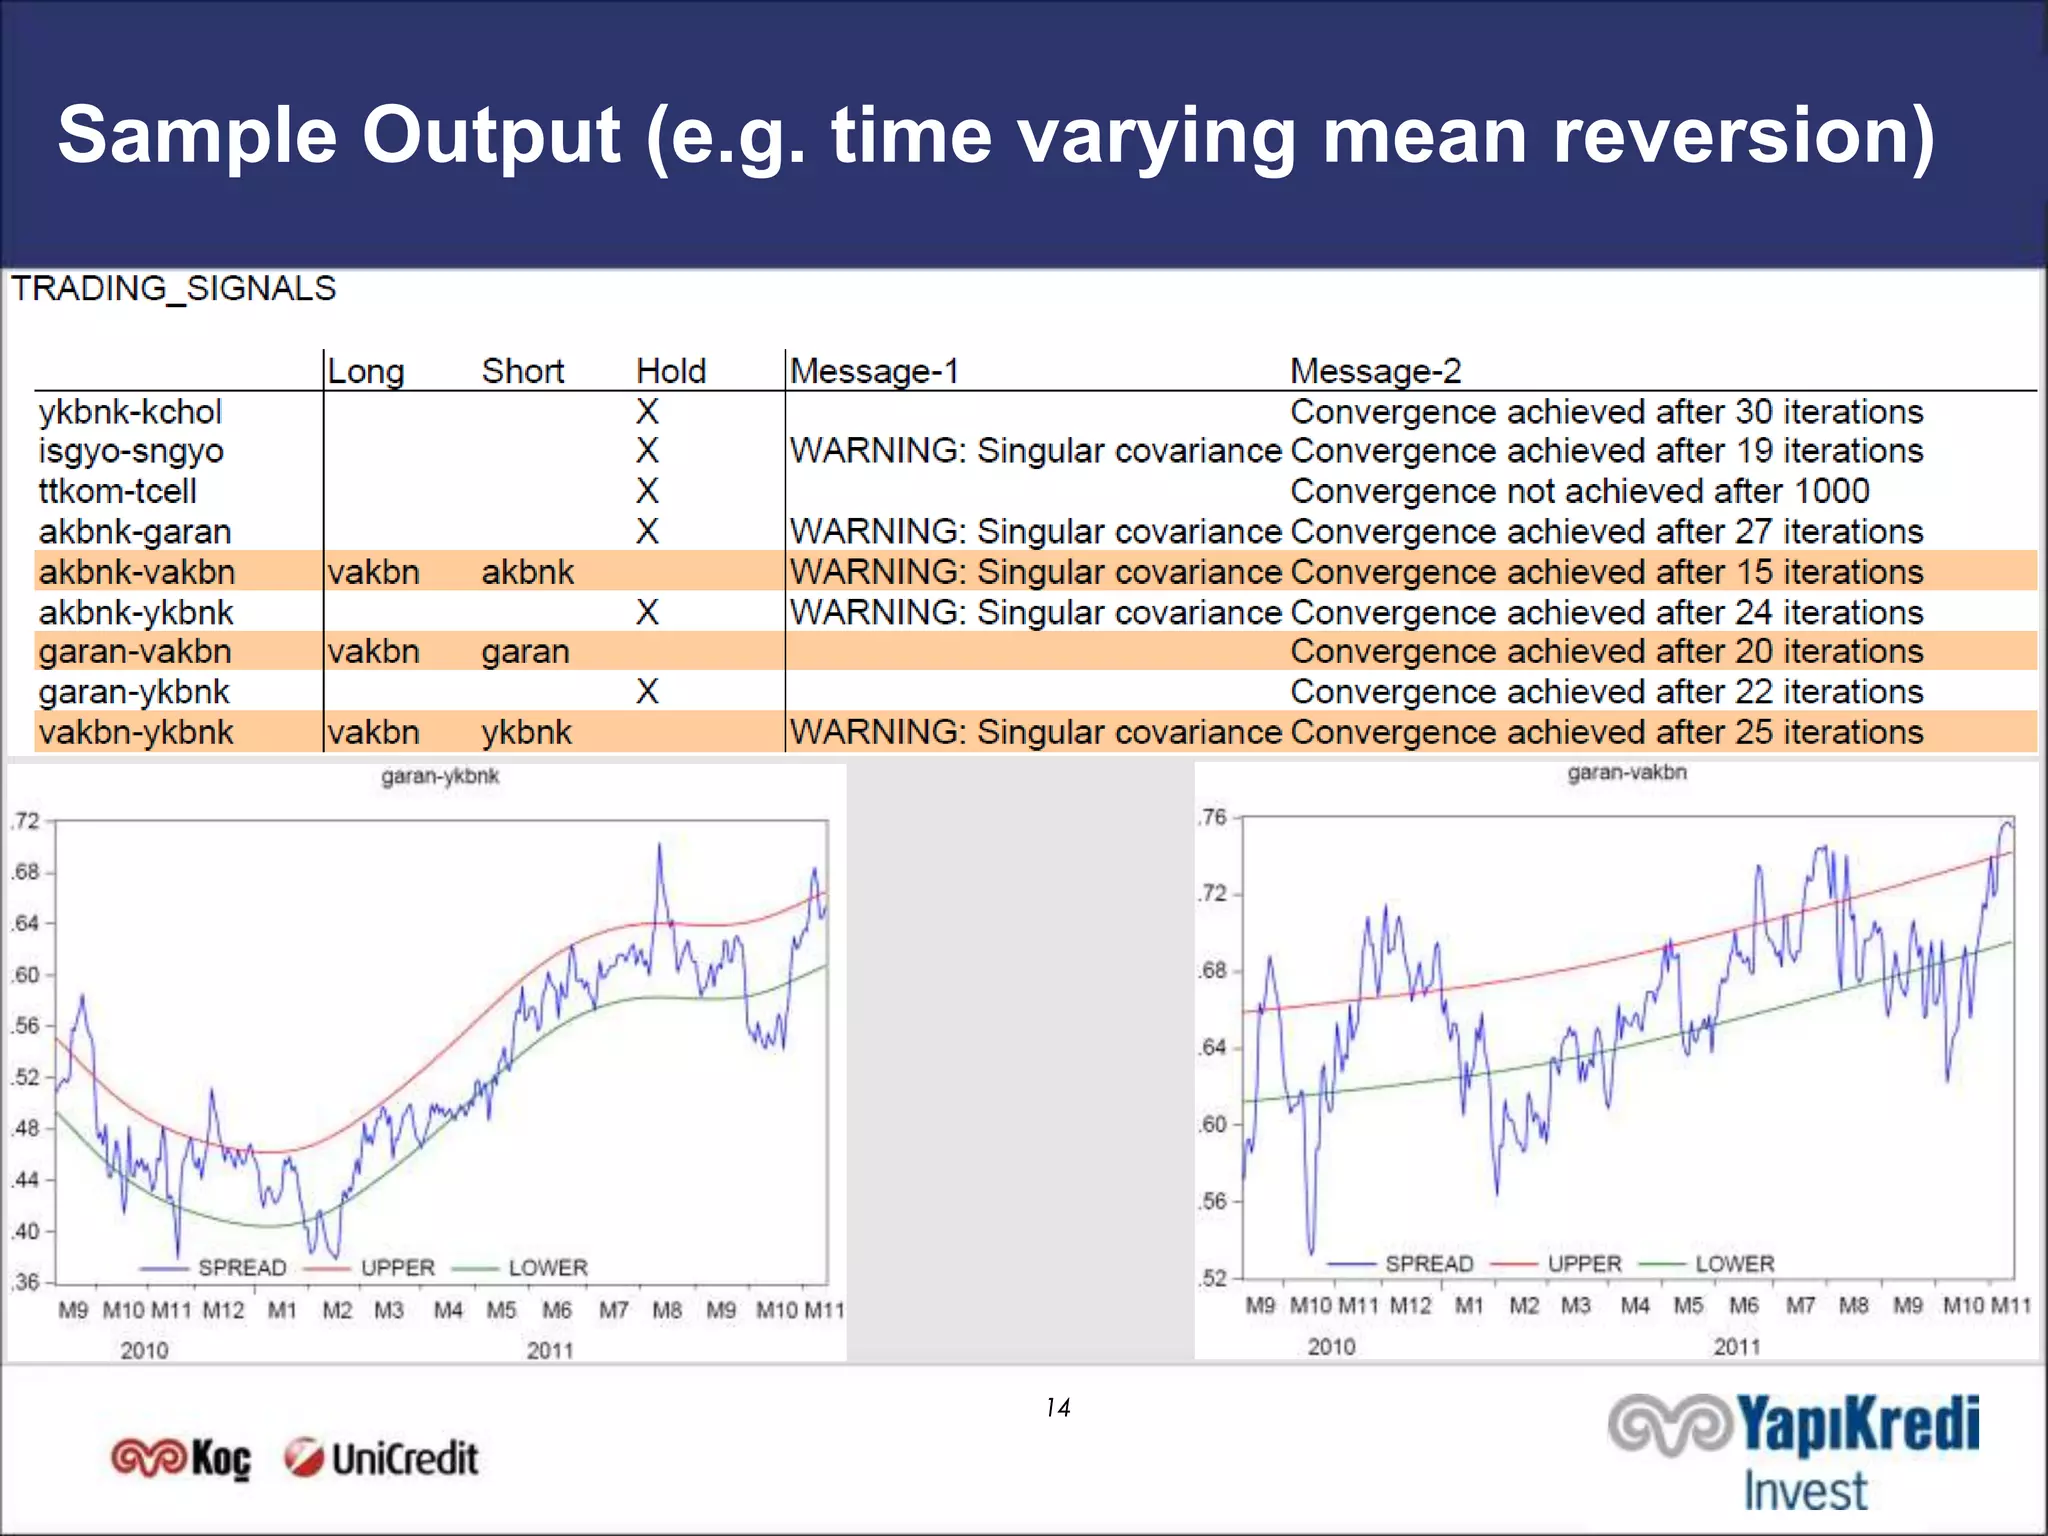
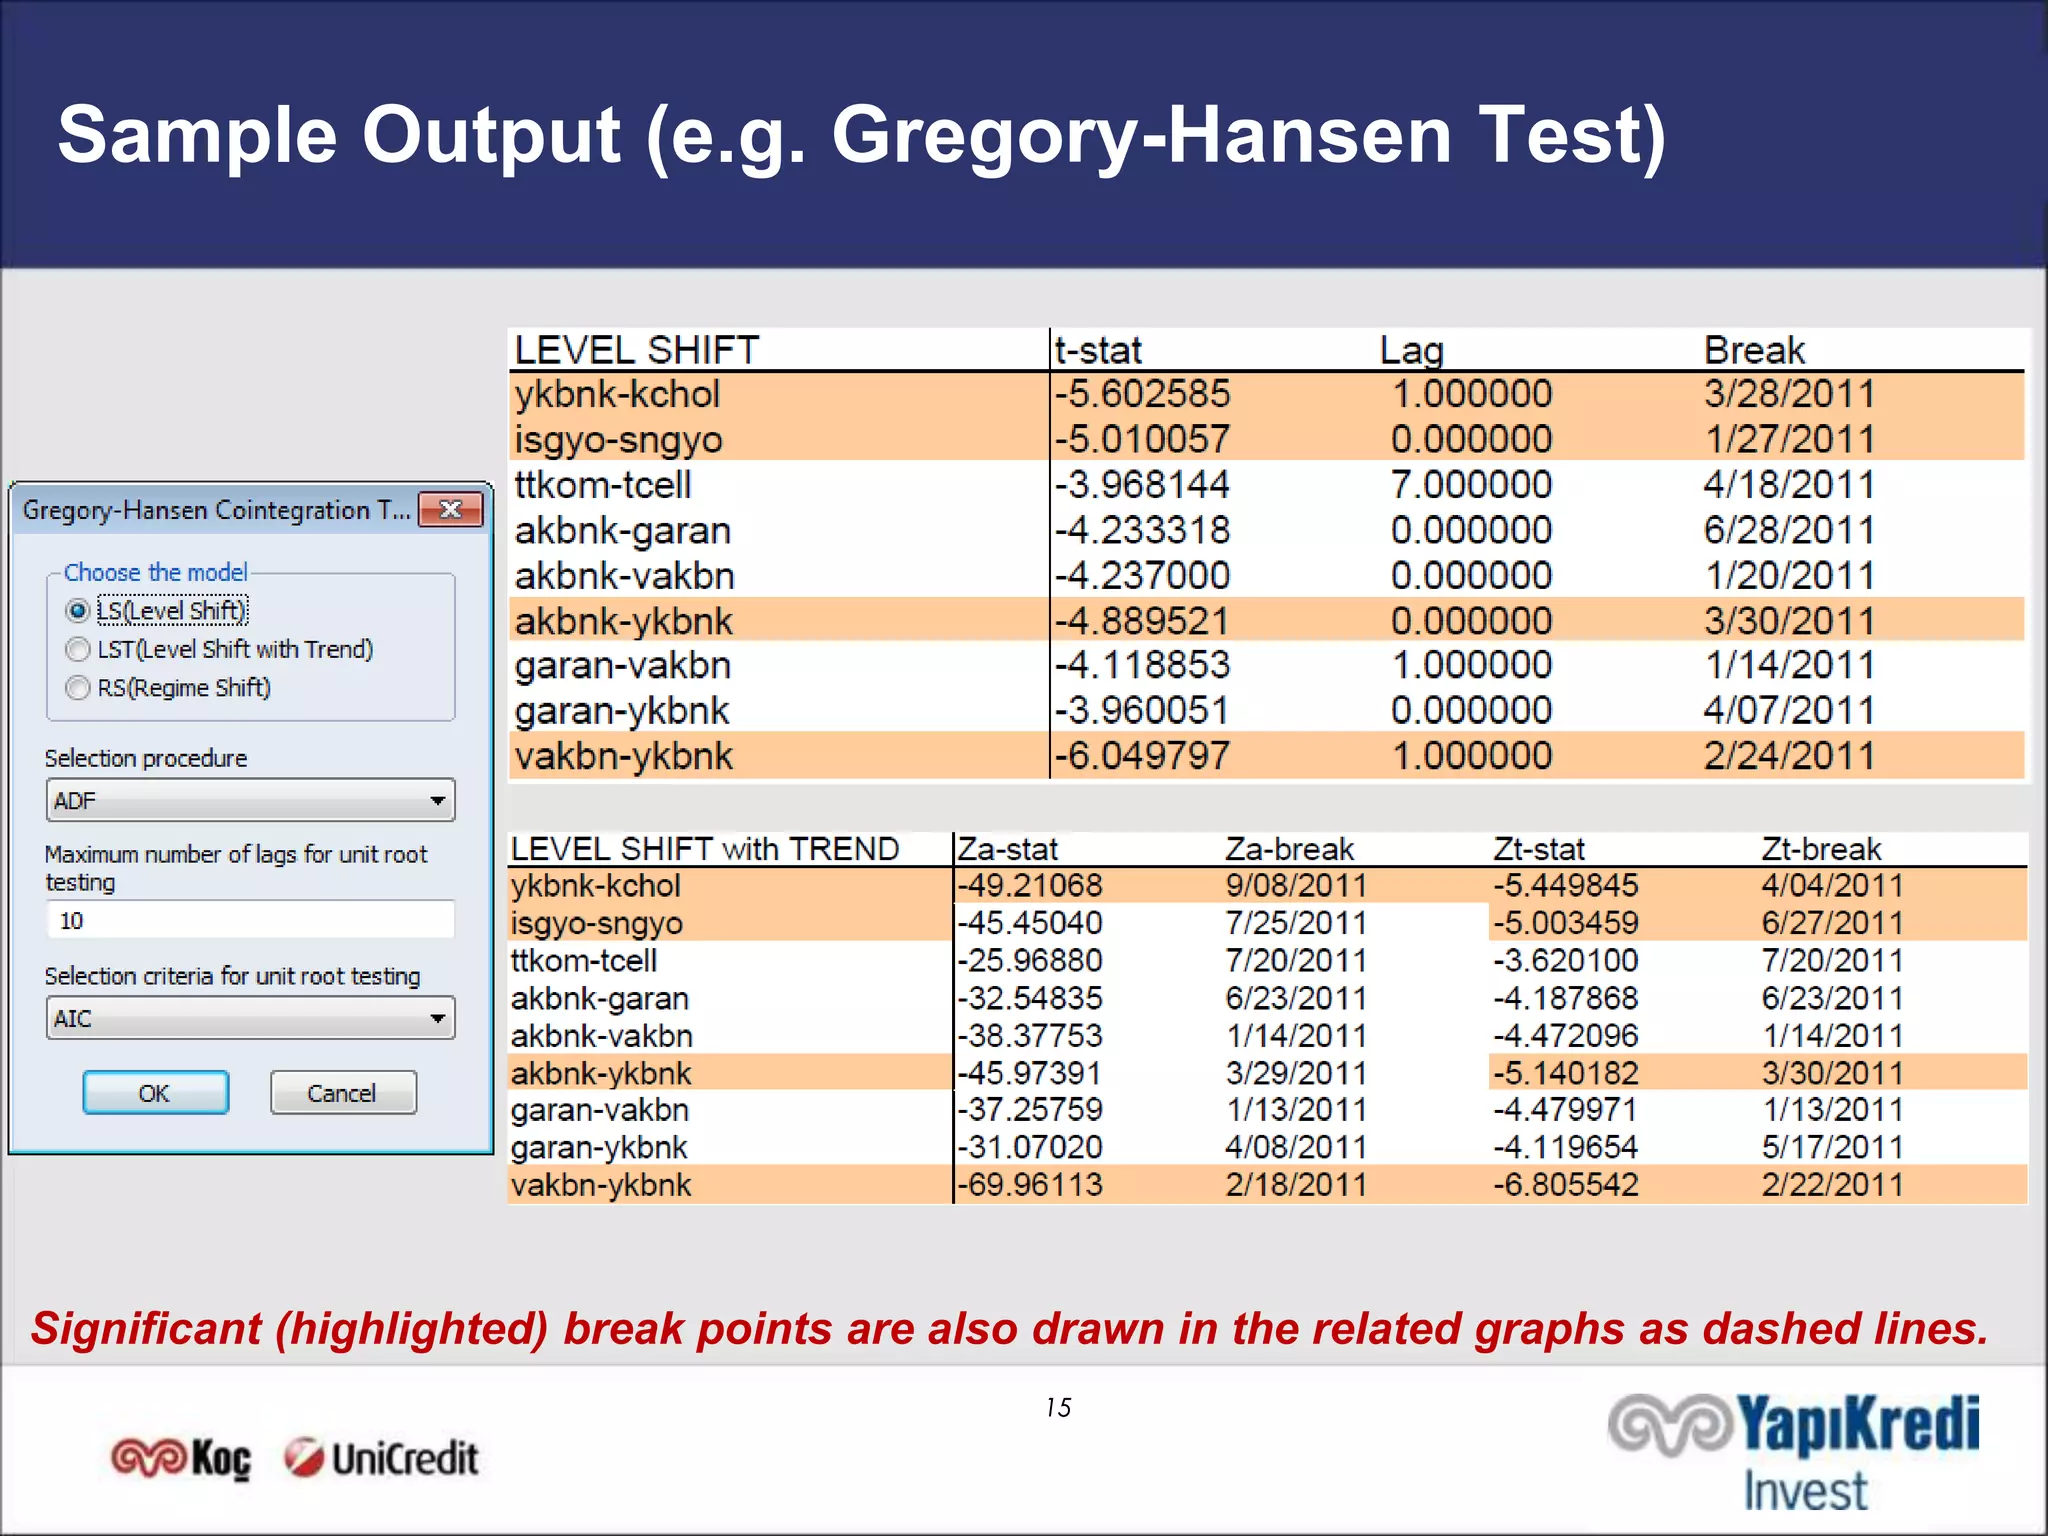
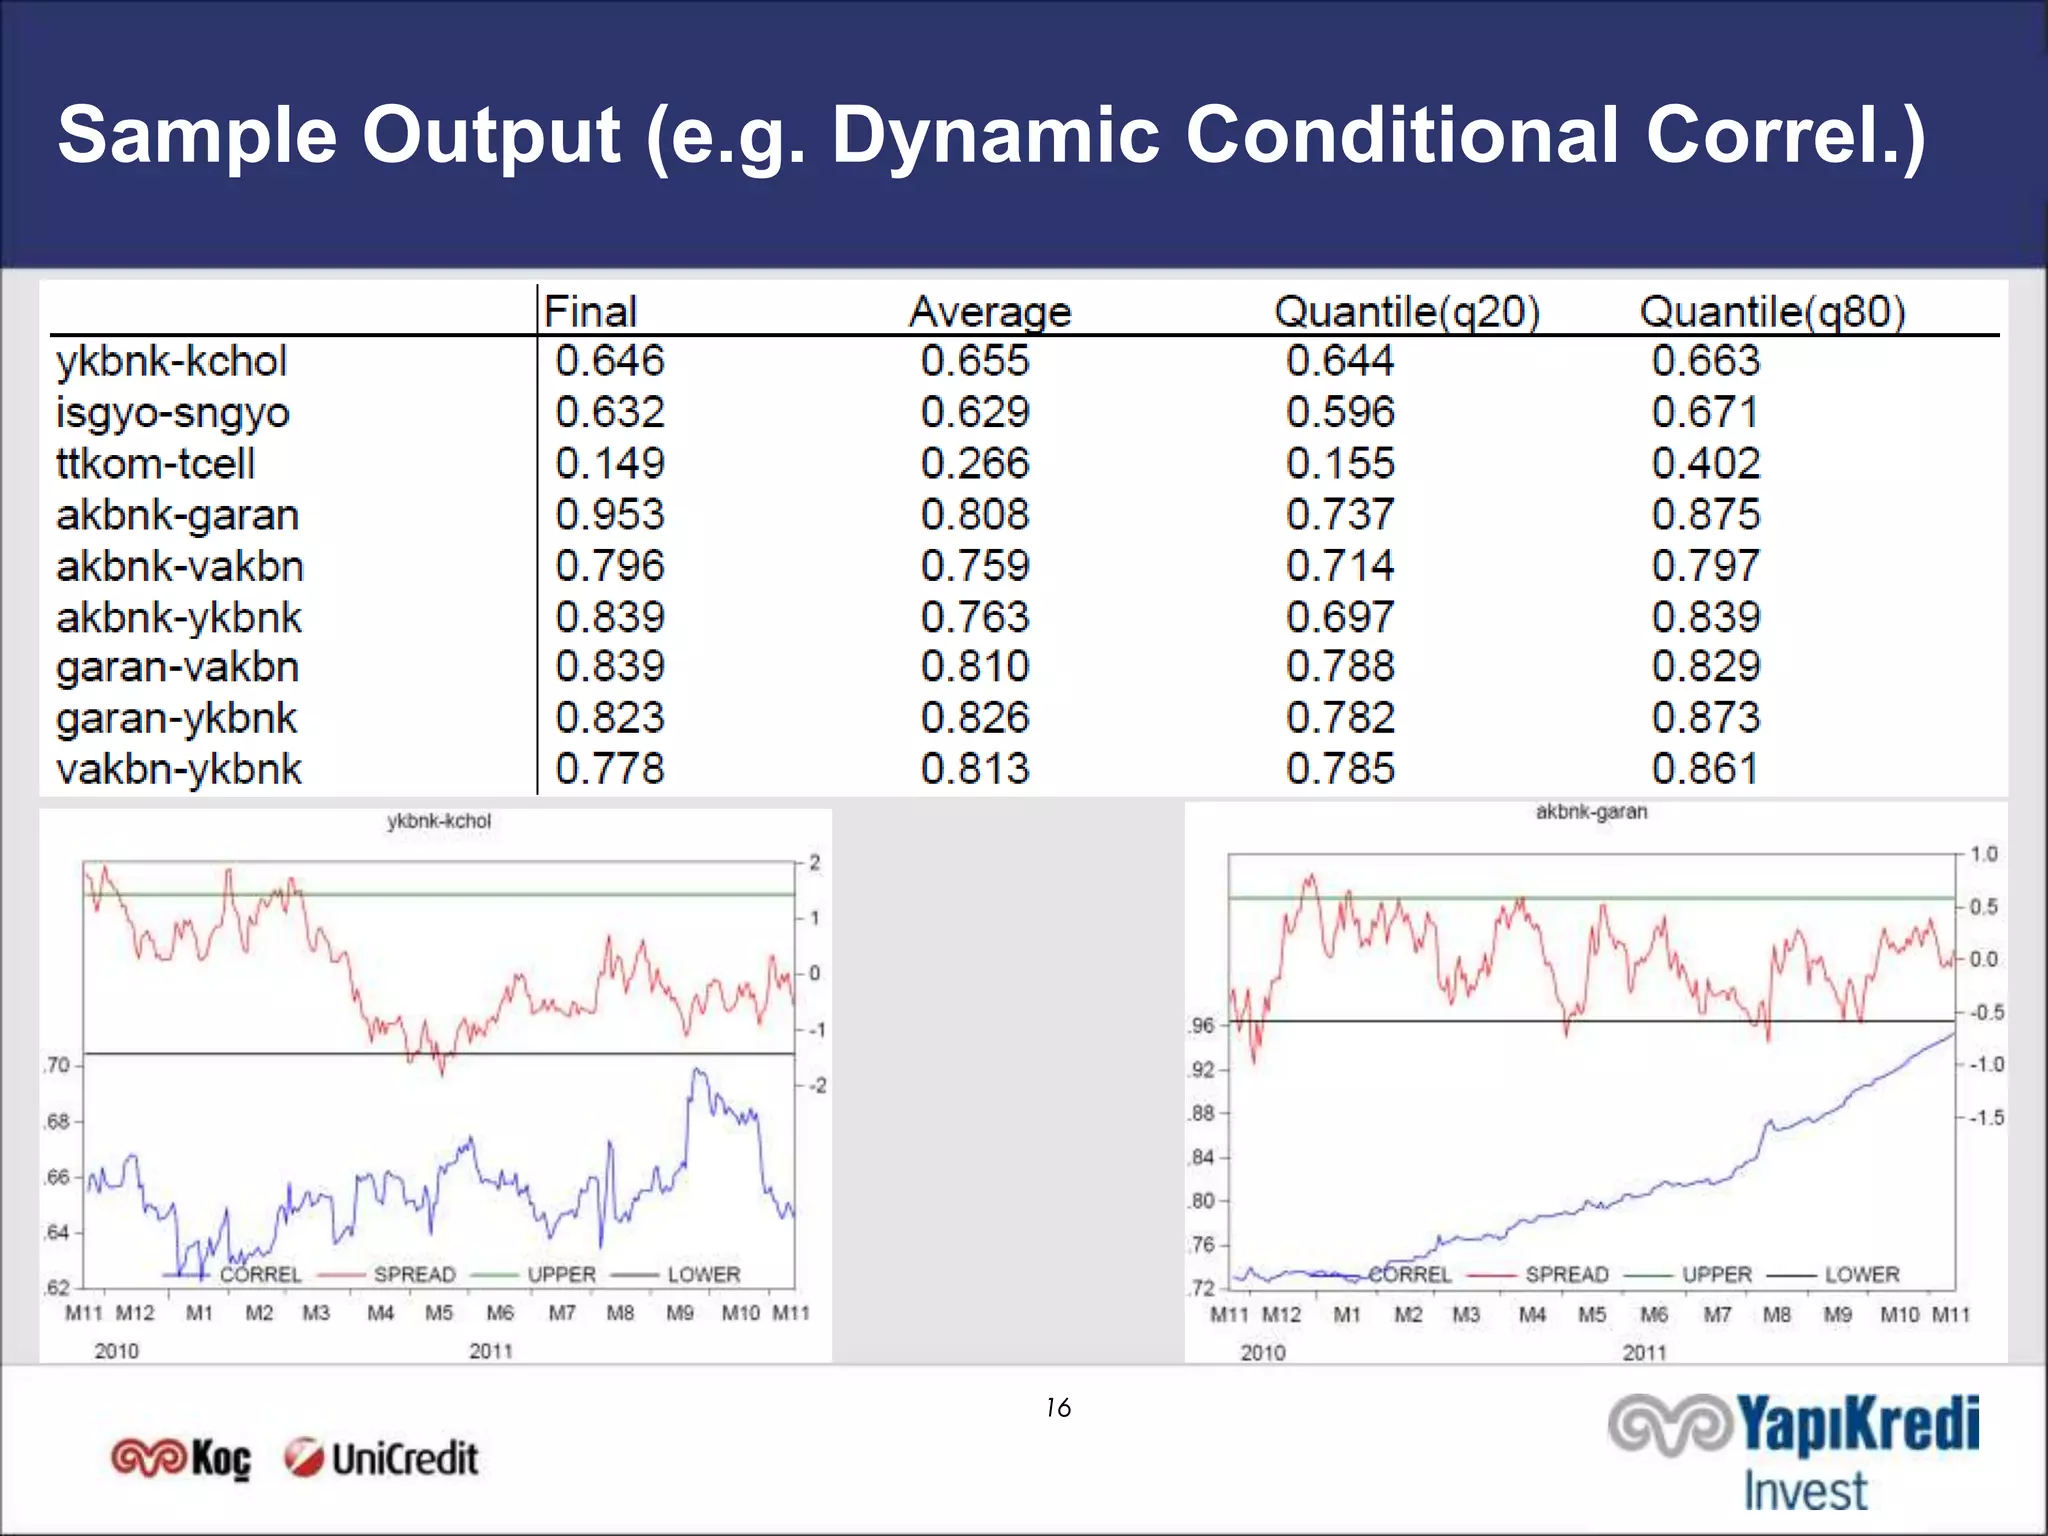
PAIRS TRADING MODEL
                Mathematical Framework &
                 Software Implementation


Eren Ocakverdi
Head of Analytical Modeling                  January, 2012
                              1
                                  E-mail:
                                  eren.ocakverdi@ykyatirim.com.tr
Disclaimer

• Pairs trading investments (or transactions) involve significant risk and volatility and may not be suitable for
everyone. Readers/Users must make their own investing and trading decisions using their own independent
advisors as they believe necessary and based upon their specific objectives and financial situation. When doing
so, readers/users should be sure to make their own assessment of risks inherent to their investment decisions.

• This document is prepared for purely informative purposes. All information enclosed in this document has been
obtained from sources believed to be reliable and accurate but which without further investigation cannot be
warranted as to their accuracy or completeness. There may also appear opinions which are of non-factual nature
and subject to change without notice for which Yapı Kredi Yatırım Menkul Değerler A.Ş. cannot be held
responsible. This document and its contents (including the add-in developed) are provided solely for the
recipient(s), who is/are expected to make their own investment decisions without undue reliance on any
information contained in this document or generated via the analysis tool it mentions (the add-in). In no
circumstances should any information contained herein (and/or generated via the use of add-in) be used or
considered as an offer to sell or a solicitation of any offer to buy the securities or commodities mentioned. Any of
the directors, officers or employees of Yapı Kredi Yatırım Menkul Değerler A.Ş. or of their affiliates may serve as a
director for companies mentioned in this document. From time to time, Yapı Kredi Yatırım Menkul Değerler A.Ş.
and any of its directors, officers, employees or representatives, directly or indirectly, may have positions or
otherwise be interested in any transactions, in any securities, or in any commodities mentioned. The views and
opinions expressed in this document belong to the members of the Research Team of Yapı Kredi Yatırım Menkul
Değerler A.Ş. and do not represent views and opinions of the Yapı Kredi Yatırım Menkul Değerler A.Ş.
management. It is possible that individuals employed by Yapı Kredi Yatırım Menkul Değerler A.Ş. elsewhere or
affiliates of Yapı Kredi Yatırım Menkul Değerler A.Ş. may disagree with the recommendations or opinions in this
document. Yapı Kredi Yatırım Menkul Değerler A.Ş. or their affiliates may, from time to time, perform investment
banking or other services for, or solicit investment banking or other business from, any company mentioned in
this document. This document may not be, reproduced, published or distributed by any person for any purpose
without the written consent of the author. Please cite source when quoting.
                                                             2
What you should expect from the Model?

The model;

• does not include any formal pair selection algorithm.

• requires pairs to be explicitly supplied.

• tests or verifies if the specified pairs are statistically valid.

• produces trading signals only for evaluation purposes.

• does not generate any kind of trading strategies or suggestions.

• aims to provide further insight into the pairs trading opportunities.

• should be supported by other assessment techniques.

• should only be considered as a decision support tool.
                                        3
Methods used in the Model

The model offers four different methods for the analysis of spread:
   • Normalized differences
   • Cointegration
   • Stochastic Spread
   • Time Varying Mean Reversion

And two different methods for the calculation of confidence bands:
   • Fixed
   • Varying (i.e. moving average)

Since all these methods are data dependent, the selection of period
for the analysis is of crucial importance!
                                     4
Normalized difference

Series are normalized as:


And then the spread is calculated as:


The model produces a trading signal if:


where Δ is a prespecified threshold value.

                                   5
Cointegration

An error correction representation can be written as follows:


The spread can be considered as the long term equilibrium:


The model produces a trading signal if:


where Δ is a prespecified threshold value.

                                    6
Stochastic Spread*

 The model, as specified in Elliot et. al. (2005), is like the following:


 The spread here is defined as:


 The model produces a trading signal if:


where Δ is a prespecified threshold value.
* Robert J. Elliott, John Van Der Hoek & William P. Malcolm (2005): Pairs trading,
Quantitative Finance, Vol. 5(3), pp. 271-276
                                              7
Time Varying Mean Reversion*

 The model can be specified as follows:


 The spread here is defined as:


 The model produces a trading signal if:


where Δ is a prespecified threshold value.
* Eren Ocakverdi (2011): A Simple Pairs Trading Strategy for ISE30, Yapi Kredi Occasional
Macro Notes, May 2, 2011.
                                             8
Additional Output

 Gregory-Hansen procedure1 is a formal test that investigates the
 existence of cointegration relationship in the presence of an
 unknown structural break, which is endogenously identified.

 Dynamic conditional correlation2 is a nonlinear model of time
 varying correlation within a multivariate framework.


1 Gregory, A. W. and Hansen, B. E. (1996). "Residual-Based Tests for Cointegration in
Models with Regime Shifts", Journal of Econometrics, Vol. 70, pp. 99-126.
2 Engle, R. (2002). Dynamic Conditional Correlation: A Simple Class of Multivariate
Generalized Autoregressive Conditional Heteroskedasticity Models," Journal of Business
& Economic Statistics, American Statistical Association, Vol. 20(3), pp. 339-50
                                              9
Software Implementation

• Heavy computational burden of the methods used requires a
specialized software.

• The software should have advanced statistical and/or econometric
features.

• Ability to handle complex data structures and to easily exchange
data with other programs (e.g. Excel) and databases is important.

• We prefer to use EViews, since it also has an Add-in infrastructure
that provides easy access to user-defined programs.

• All methods are built and analyzed via EViews’ estimation and/or
programming features.

• An Add-in is developed to allow the user to quickly perform and
repeat all the analyses.
                                    10
Add-in Interface*


* EViews version 7.1 or later is required to install and run the Add-in.
                                              11
Example


Note: The Add-in can be run with default settings as long as valid pairs are supplied.
                                             12
Sample Output (e.g. cointegration)


                         13
Sample Output (e.g. time varying mean reversion)


                         14
Sample Output (e.g. Gregory-Hansen Test)


Significant (highlighted) break points are also drawn in the related graphs as dashed lines.
                                               15
Sample Output (e.g. Dynamic Conditional Correl.)


                         16
A few remarks on summary results

• Although the analysis is designed to generate an output in any
case, there is no guarantee that all the results will be meaningful.

• Some methods impose strict functional forms, which may lead to
infeasible/incorrect results if the assumptions do not hold.

• Some methods, on the other hand, rely on more complex analyses
and may therefore experience estimation problems.

• Charts and warning messages in the tables will be helpful in
identifying the source of the problem.

• Much of the statistical output generated during the estimation
process is intentionally left outside the scope of the summary report.

• The summary report, as an analytic tool, seeks to reflect the trade-
offs among flexibility, customization, ease of use and capability.
                                     17
Final word on the Add-in

• This add-in demonstrates that how economic concepts and/or
econometric techniques can be useful in financial decision making
(i.e. trading) and that how EViews can effectively handle the whole
process.

• A restricted and a slightly less sophisticated version of the original
add-in can be downladed at Eviews’ website:

 http://www.eviews.com

• Or directly from the following link:

 http://www.eviews.com/Addins/pairstrade.aipz


                                         18
Essentially, all models are wrong, but some are useful.

                            George Edward Pelham Box

Yki Pairs Trading Model (Version 2.0)

  • 1.
    PAIRS TRADING MODEL Mathematical Framework & Software Implementation Eren Ocakverdi Head of Analytical Modeling January, 2012 1 E-mail: eren.ocakverdi@ykyatirim.com.tr
  • 2.
    Disclaimer • Pairs tradinginvestments (or transactions) involve significant risk and volatility and may not be suitable for everyone. Readers/Users must make their own investing and trading decisions using their own independent advisors as they believe necessary and based upon their specific objectives and financial situation. When doing so, readers/users should be sure to make their own assessment of risks inherent to their investment decisions. • This document is prepared for purely informative purposes. All information enclosed in this document has been obtained from sources believed to be reliable and accurate but which without further investigation cannot be warranted as to their accuracy or completeness. There may also appear opinions which are of non-factual nature and subject to change without notice for which Yapı Kredi Yatırım Menkul Değerler A.Ş. cannot be held responsible. This document and its contents (including the add-in developed) are provided solely for the recipient(s), who is/are expected to make their own investment decisions without undue reliance on any information contained in this document or generated via the analysis tool it mentions (the add-in). In no circumstances should any information contained herein (and/or generated via the use of add-in) be used or considered as an offer to sell or a solicitation of any offer to buy the securities or commodities mentioned. Any of the directors, officers or employees of Yapı Kredi Yatırım Menkul Değerler A.Ş. or of their affiliates may serve as a director for companies mentioned in this document. From time to time, Yapı Kredi Yatırım Menkul Değerler A.Ş. and any of its directors, officers, employees or representatives, directly or indirectly, may have positions or otherwise be interested in any transactions, in any securities, or in any commodities mentioned. The views and opinions expressed in this document belong to the members of the Research Team of Yapı Kredi Yatırım Menkul Değerler A.Ş. and do not represent views and opinions of the Yapı Kredi Yatırım Menkul Değerler A.Ş. management. It is possible that individuals employed by Yapı Kredi Yatırım Menkul Değerler A.Ş. elsewhere or affiliates of Yapı Kredi Yatırım Menkul Değerler A.Ş. may disagree with the recommendations or opinions in this document. Yapı Kredi Yatırım Menkul Değerler A.Ş. or their affiliates may, from time to time, perform investment banking or other services for, or solicit investment banking or other business from, any company mentioned in this document. This document may not be, reproduced, published or distributed by any person for any purpose without the written consent of the author. Please cite source when quoting. 2
  • 3.
    What you shouldexpect from the Model? The model; • does not include any formal pair selection algorithm. • requires pairs to be explicitly supplied. • tests or verifies if the specified pairs are statistically valid. • produces trading signals only for evaluation purposes. • does not generate any kind of trading strategies or suggestions. • aims to provide further insight into the pairs trading opportunities. • should be supported by other assessment techniques. • should only be considered as a decision support tool. 3
  • 4.
    Methods used inthe Model The model offers four different methods for the analysis of spread: • Normalized differences • Cointegration • Stochastic Spread • Time Varying Mean Reversion And two different methods for the calculation of confidence bands: • Fixed • Varying (i.e. moving average) Since all these methods are data dependent, the selection of period for the analysis is of crucial importance! 4
  • 5.
    Normalized difference Series arenormalized as: And then the spread is calculated as: The model produces a trading signal if: where Δ is a prespecified threshold value. 5
  • 6.
    Cointegration An error correctionrepresentation can be written as follows: The spread can be considered as the long term equilibrium: The model produces a trading signal if: where Δ is a prespecified threshold value. 6
  • 7.
    Stochastic Spread* Themodel, as specified in Elliot et. al. (2005), is like the following: The spread here is defined as: The model produces a trading signal if: where Δ is a prespecified threshold value. * Robert J. Elliott, John Van Der Hoek & William P. Malcolm (2005): Pairs trading, Quantitative Finance, Vol. 5(3), pp. 271-276 7
  • 8.
    Time Varying MeanReversion* The model can be specified as follows: The spread here is defined as: The model produces a trading signal if: where Δ is a prespecified threshold value. * Eren Ocakverdi (2011): A Simple Pairs Trading Strategy for ISE30, Yapi Kredi Occasional Macro Notes, May 2, 2011. 8
  • 9.
    Additional Output Gregory-Hansenprocedure1 is a formal test that investigates the existence of cointegration relationship in the presence of an unknown structural break, which is endogenously identified. Dynamic conditional correlation2 is a nonlinear model of time varying correlation within a multivariate framework. 1 Gregory, A. W. and Hansen, B. E. (1996). "Residual-Based Tests for Cointegration in Models with Regime Shifts", Journal of Econometrics, Vol. 70, pp. 99-126. 2 Engle, R. (2002). Dynamic Conditional Correlation: A Simple Class of Multivariate Generalized Autoregressive Conditional Heteroskedasticity Models," Journal of Business & Economic Statistics, American Statistical Association, Vol. 20(3), pp. 339-50 9
  • 10.
    Software Implementation • Heavycomputational burden of the methods used requires a specialized software. • The software should have advanced statistical and/or econometric features. • Ability to handle complex data structures and to easily exchange data with other programs (e.g. Excel) and databases is important. • We prefer to use EViews, since it also has an Add-in infrastructure that provides easy access to user-defined programs. • All methods are built and analyzed via EViews’ estimation and/or programming features. • An Add-in is developed to allow the user to quickly perform and repeat all the analyses. 10
  • 11.
    Add-in Interface* * EViewsversion 7.1 or later is required to install and run the Add-in. 11
  • 12.
    Example Note: The Add-incan be run with default settings as long as valid pairs are supplied. 12
  • 13.
    Sample Output (e.g.cointegration) 13
  • 14.
    Sample Output (e.g.time varying mean reversion) 14
  • 15.
    Sample Output (e.g.Gregory-Hansen Test) Significant (highlighted) break points are also drawn in the related graphs as dashed lines. 15
  • 16.
    Sample Output (e.g.Dynamic Conditional Correl.) 16
  • 17.
    A few remarkson summary results • Although the analysis is designed to generate an output in any case, there is no guarantee that all the results will be meaningful. • Some methods impose strict functional forms, which may lead to infeasible/incorrect results if the assumptions do not hold. • Some methods, on the other hand, rely on more complex analyses and may therefore experience estimation problems. • Charts and warning messages in the tables will be helpful in identifying the source of the problem. • Much of the statistical output generated during the estimation process is intentionally left outside the scope of the summary report. • The summary report, as an analytic tool, seeks to reflect the trade- offs among flexibility, customization, ease of use and capability. 17
  • 18.
    Final word onthe Add-in • This add-in demonstrates that how economic concepts and/or econometric techniques can be useful in financial decision making (i.e. trading) and that how EViews can effectively handle the whole process. • A restricted and a slightly less sophisticated version of the original add-in can be downladed at Eviews’ website: http://www.eviews.com • Or directly from the following link: http://www.eviews.com/Addins/pairstrade.aipz 18
  • 19.
    Essentially, all modelsare wrong, but some are useful. George Edward Pelham Box