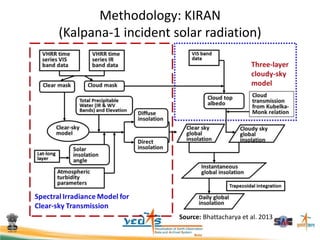
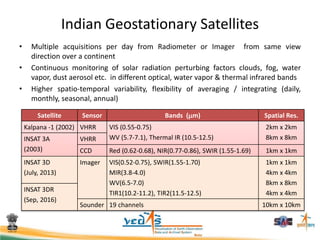
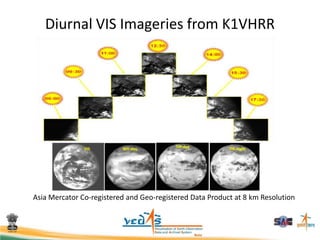
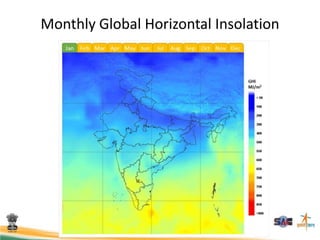
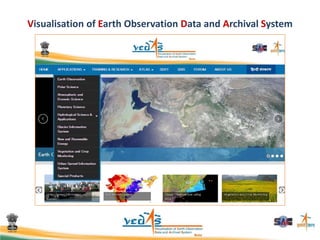
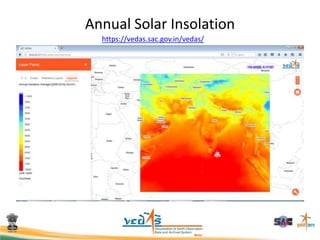
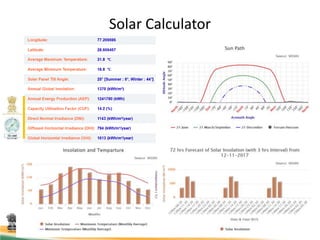
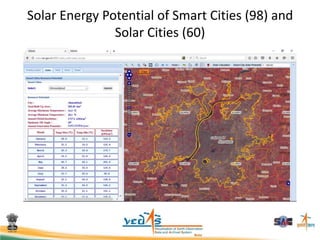
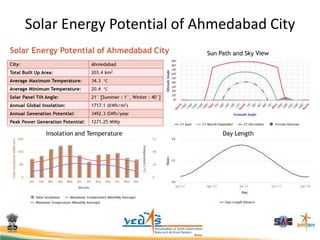
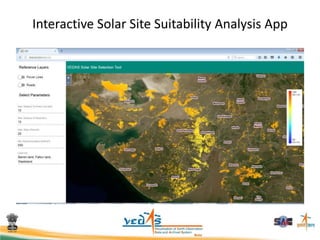
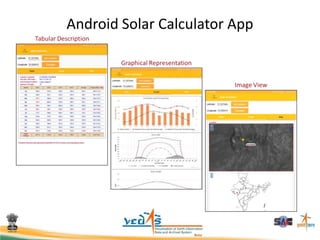
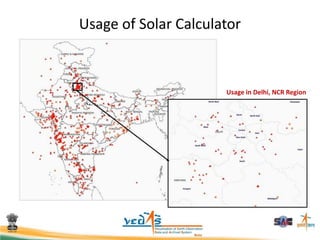
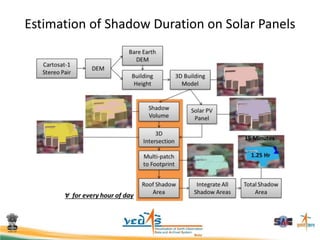
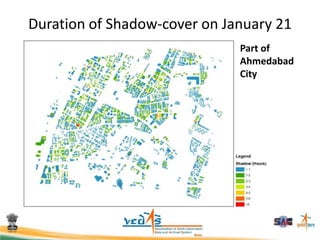
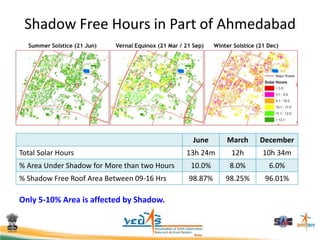
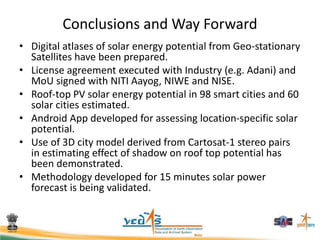
Use of Space Technology for
Solar Energy
GAURAV JAIN
Space Applications Centre (SAC)
Indian Space Research Organisation (ISRO)
Ahmedabad
Interaction of Solar Radiation and Atmosphere
A part of solar radiation that is neither reflected nor scattered,
and which directly reaches the surface, is the direct radiation.
A part that is scattered by the atmosphere, and which reaches
the ground, is the diffuse radiation.
Detailed information
about solar radiation
availability at any
location is essential for
the design and
economic evaluation of
a solar energy system.
Solar Radiation Resource Assessment (SRRA) Stations
National Institute of Wind Energy (NIWE) - MNRE
(51)
(60)
(4)
(6)
SolarGIS Satellite-derived Irradiation
Source: Matejicek 2017
DOI 10.1007/978-3-319-52694-2_7
Satellite-based Irradiance Models
Atmospheric Parameters
 Water vapour
 Aerosol optical depth
 Aerosol type
 Ozone
Environmental Variables
 Altitude
 Terrain shading
 Air Temperature
Solar Geometry
 Zenith Angle
 Azimuth Angle
 Extra-terrestrial
Irradiance
Satellite Data
 Visible Channel
 Infrared Channels
Clear-sky Model Cloud Model
Clear-sky Irradiance Cloud Index
Other Models
DIF, transposition, terrain
All-sky IrradianceSource: Matejicek 2017
DOI 10.1007/978-3-319-52694-2_7
Methodology: KIRAN
(Kalpana-1 incident solar radiation)
Source: Bhattacharya et al. 2013
Indian Geostationary Satellites
• Multiple acquisitions per day from Radiometer or Imager from same view
direction over a continent
• Continuous monitoring of solar radiation perturbing factors clouds, fog, water
vapor, dust aerosol etc. in different optical, water vapor & thermal infrared bands
• Higher spatio-temporal variability, flexibility of averaging / integrating (daily,
monthly, seasonal, annual)
Satellite Sensor Bands (m) Spatial Res.
Kalpana -1 (2002) VHRR VIS (0.55-0.75)
WV (5.7-7.1), Thermal IR (10.5-12.5)
2km x 2km
8km x 8kmINSAT 3A
(2003)
VHRR
CCD Red (0.62-0.68), NIR(0.77-0.86), SWIR (1.55-1.69) 1km x 1km
INSAT 3D
(July, 2013)
Imager VIS(0.52-0.75), SWIR(1.55-1.70)
MIR(3.8-4.0)
WV(6.5-7.0)
TIR1(10.2-11.2), TIR2(11.5-12.5)
1km x 1km
4km x 4km
8km x 8km
4km x 4km
INSAT 3DR
(Sep, 2016)
Sounder 19 channels 10km x 10km
Diurnal VIS Imageries from K1VHRR
Asia Mercator Co-registered and Geo-registered Data Product at 8 km Resolution
Monthly Global Horizontal Insolation
Visualisation of Earth Observation Data and Archival System
Annual Solar Insolation
https://vedas.sac.gov.in/vedas/
Solar Calculator
Available Potential for Roof-top PV in
Smart Cities
• Total Built-up Area of 98 Cities: 6,360.92 km2
• Total Roof Area (assuming 25% of built-up area is covered by
buildings): 1590.24 km2
• Total Suitable Roof Area (using constant proportion method,
assuming 25% of total roof area is suitable for PV): 397.56 km2
• Total Solar Energy Output on Suitable Roof Area (16%
efficiency of solar PV module): 103,510.29 GWH / Annum
• Available Peak Power Generation Potential (10 m2 power per
kW power and 80% system performance ratio): 31 GWp
Solar Energy Potential of Smart Cities (98) and
Solar Cities (60)
Solar Energy Potential of Ahmedabad City
Interactive Solar Site Suitability Analysis App
Android Solar Calculator App
Usage of Solar Calculator
Usage in Delhi, NCR Region
3D Building Model of Ahmedabad City Using
Carosat-1 Stereo Pair
Estimation of Shadow Duration on Solar Panels
Duration of Shadow-cover on January 21
Part of
Ahmedabad
City
Shadow Free Hours in Part of Ahmedabad
June March December
Total Solar Hours 13h 24m 12h 10h 34m
% Area Under Shadow for More than two Hours 10.0% 8.0% 6.0%
% Shadow Free Roof Area Between 09-16 Hrs 98.87% 98.25% 96.01%
Only 5-10% Area is affected by Shadow.
Conclusions and Way Forward
• Digital atlases of solar energy potential from Geo-stationary
Satellites have been prepared.
• License agreement executed with Industry (e.g. Adani) and
MoU signed with NITI Aayog, NIWE and NISE.
• Roof-top PV solar energy potential in 98 smart cities and 60
solar cities estimated.
• Android App developed for assessing location-specific solar
potential.
• Use of 3D city model derived from Cartosat-1 stereo pairs
in estimating effect of shadow on roof top potential has
been demonstrated.
• Methodology developed for 15 minutes solar power
forecast is being validated.
THANK YOU
sasharma@sac.isro.gov.in
gvj@sac.isro.gov.in

Presentation by ISRO

  • 1.
    Use of SpaceTechnology for Solar Energy GAURAV JAIN Space Applications Centre (SAC) Indian Space Research Organisation (ISRO) Ahmedabad
  • 2.
    Interaction of SolarRadiation and Atmosphere A part of solar radiation that is neither reflected nor scattered, and which directly reaches the surface, is the direct radiation. A part that is scattered by the atmosphere, and which reaches the ground, is the diffuse radiation. Detailed information about solar radiation availability at any location is essential for the design and economic evaluation of a solar energy system.
  • 3.
    Solar Radiation ResourceAssessment (SRRA) Stations National Institute of Wind Energy (NIWE) - MNRE (51) (60) (4) (6)
  • 4.
    SolarGIS Satellite-derived Irradiation Source:Matejicek 2017 DOI 10.1007/978-3-319-52694-2_7
  • 5.
    Satellite-based Irradiance Models AtmosphericParameters  Water vapour  Aerosol optical depth  Aerosol type  Ozone Environmental Variables  Altitude  Terrain shading  Air Temperature Solar Geometry  Zenith Angle  Azimuth Angle  Extra-terrestrial Irradiance Satellite Data  Visible Channel  Infrared Channels Clear-sky Model Cloud Model Clear-sky Irradiance Cloud Index Other Models DIF, transposition, terrain All-sky IrradianceSource: Matejicek 2017 DOI 10.1007/978-3-319-52694-2_7
  • 6.
    Methodology: KIRAN (Kalpana-1 incidentsolar radiation) Source: Bhattacharya et al. 2013
  • 7.
    Indian Geostationary Satellites •Multiple acquisitions per day from Radiometer or Imager from same view direction over a continent • Continuous monitoring of solar radiation perturbing factors clouds, fog, water vapor, dust aerosol etc. in different optical, water vapor & thermal infrared bands • Higher spatio-temporal variability, flexibility of averaging / integrating (daily, monthly, seasonal, annual) Satellite Sensor Bands (m) Spatial Res. Kalpana -1 (2002) VHRR VIS (0.55-0.75) WV (5.7-7.1), Thermal IR (10.5-12.5) 2km x 2km 8km x 8kmINSAT 3A (2003) VHRR CCD Red (0.62-0.68), NIR(0.77-0.86), SWIR (1.55-1.69) 1km x 1km INSAT 3D (July, 2013) Imager VIS(0.52-0.75), SWIR(1.55-1.70) MIR(3.8-4.0) WV(6.5-7.0) TIR1(10.2-11.2), TIR2(11.5-12.5) 1km x 1km 4km x 4km 8km x 8km 4km x 4km INSAT 3DR (Sep, 2016) Sounder 19 channels 10km x 10km
  • 8.
    Diurnal VIS Imageriesfrom K1VHRR Asia Mercator Co-registered and Geo-registered Data Product at 8 km Resolution
  • 9.
  • 10.
    Visualisation of EarthObservation Data and Archival System
  • 11.
  • 12.
  • 13.
    Available Potential forRoof-top PV in Smart Cities • Total Built-up Area of 98 Cities: 6,360.92 km2 • Total Roof Area (assuming 25% of built-up area is covered by buildings): 1590.24 km2 • Total Suitable Roof Area (using constant proportion method, assuming 25% of total roof area is suitable for PV): 397.56 km2 • Total Solar Energy Output on Suitable Roof Area (16% efficiency of solar PV module): 103,510.29 GWH / Annum • Available Peak Power Generation Potential (10 m2 power per kW power and 80% system performance ratio): 31 GWp
  • 14.
    Solar Energy Potentialof Smart Cities (98) and Solar Cities (60)
  • 15.
    Solar Energy Potentialof Ahmedabad City
  • 16.
    Interactive Solar SiteSuitability Analysis App
  • 17.
  • 18.
    Usage of SolarCalculator Usage in Delhi, NCR Region
  • 19.
    3D Building Modelof Ahmedabad City Using Carosat-1 Stereo Pair
  • 20.
    Estimation of ShadowDuration on Solar Panels
  • 21.
    Duration of Shadow-coveron January 21 Part of Ahmedabad City
  • 22.
    Shadow Free Hoursin Part of Ahmedabad June March December Total Solar Hours 13h 24m 12h 10h 34m % Area Under Shadow for More than two Hours 10.0% 8.0% 6.0% % Shadow Free Roof Area Between 09-16 Hrs 98.87% 98.25% 96.01% Only 5-10% Area is affected by Shadow.
  • 23.
    Conclusions and WayForward • Digital atlases of solar energy potential from Geo-stationary Satellites have been prepared. • License agreement executed with Industry (e.g. Adani) and MoU signed with NITI Aayog, NIWE and NISE. • Roof-top PV solar energy potential in 98 smart cities and 60 solar cities estimated. • Android App developed for assessing location-specific solar potential. • Use of 3D city model derived from Cartosat-1 stereo pairs in estimating effect of shadow on roof top potential has been demonstrated. • Methodology developed for 15 minutes solar power forecast is being validated.
  • 24.