Download as PDF, PPTX

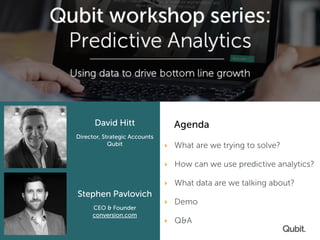
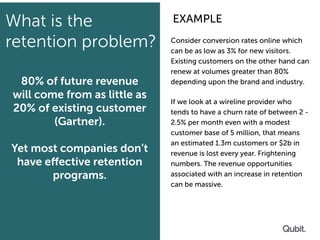


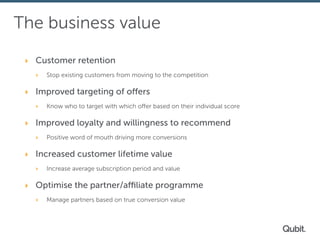


The webinar focuses on predictive analytics for customer retention, highlighting the challenge of high churn rates and the importance of retaining existing customers for revenue growth. It discusses various data points and methodologies for analyzing customer behavior to predict churn and adapt marketing strategies accordingly. Key takeaways include personalizing customer experiences and optimizing retention efforts to enhance customer loyalty and lifetime value.


