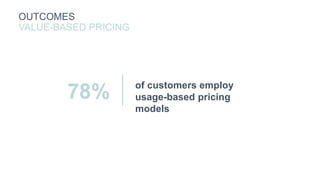
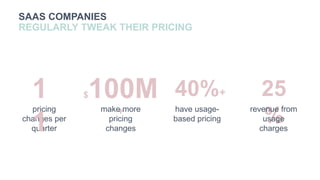
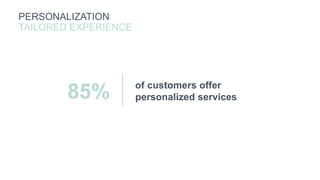
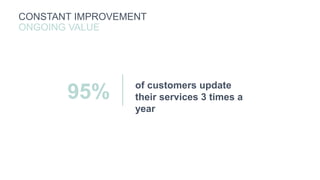
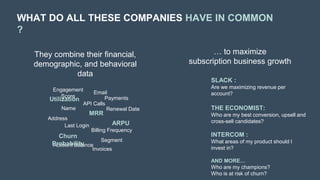
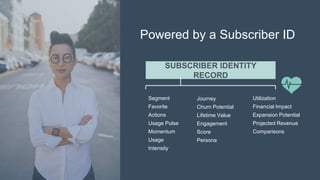
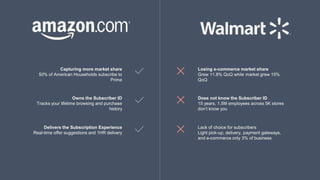
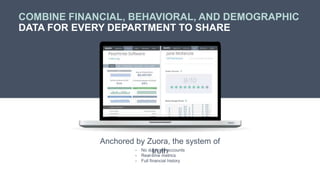
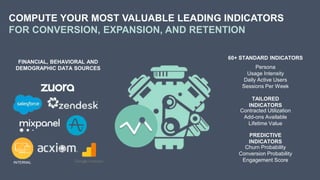
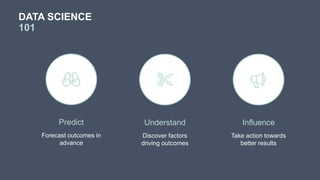
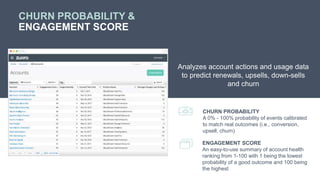
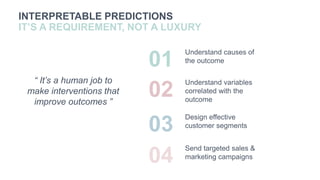
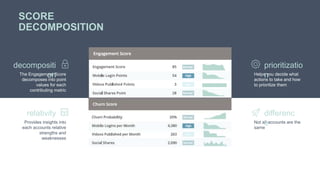
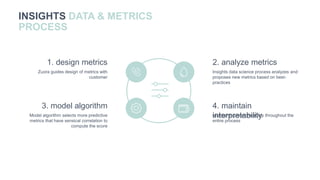
≈
TURN CUSTOMER DATA INTO WINNING
SUBSCRIBER EXPERIENCES
Matthew Darrow, VP of Product @ Zuora
Carl Gold, Chief Data Scientist @ Zuora
≈
Matthew
Darrow
VP of Product
Carl Gold
Chief Data
Scientist
WE NOW LIVE IN A
SUBSCRIPTION ECONOMY
#shifthappens
THE WORLD. SUBSCRIBED.
78%
Of people in the UK
subscribe to at least
one product or
service
- You Gov Study 2016
50%
Of people in France
are moving away from
traditional ownership
- Institut Français
D’opinion Publique
(IFOP)
80%
Of German
companies have
dealt with the issue
of subscription
business models.
- IDG Research
Services
$420B
Spent on
subscriptions in the
US in 2015; up from
$215B in 2000.
- Credit Suisse
THAT’S WHY SUBSCRIPTION REVENUES ARE
GROWING 9X FASTER THAN S&P 500
HOW DID THESE SUBSCRIPTION
BUSINESSES GROW SO FAST ?
OUTCOMES
Value-Based Pricing
PERSONALIZATION
Tailored Experience
CONSTANT IMPROVEMENT
Ongoing Value
THEY DELIVER
ON THE
SUBSCRIPTION
EXPERIENCE
of customers employ
usage-based pricing
models
78%
OUTCOMES
VALUE-BASED PRICING
SAAS COMPANIES
REGULARLY TWEAK THEIR PRICING
pricing
changes per
quarter
1
1
$100M
+
40%+ 25
%make more
pricing
changes
have usage-
based pricing
revenue from
usage
charges
you
r
SLACK SAID
“FAIR IS FAIR”
o only get billed for what you use
o don’t pay for users that haven’t logged in
o get pro-rated credit for inactive pre-paid
users
fair billing policy
contracted
price
daily user
logins
subscription
status
of customers offer
personalized services85%
PERSONALIZATION
TAILORED EXPERIENCE
THE ECONOMIST TURNED SOCIAL VISITORS
INTO 1K NEW SUBSCRIBERS IN 8 MONTHS
o cross-referenced Twitter
followers with those
registered on
Economist.com
o tweeted at registered
readers featuring timely
content
o invited non-registered users
to subscribe to newsletters
and prompted paid users to
try the app
let’s connect!
“People who have
registered on our
website and are active
on social media are
our most effective
audience segment for
driving conversions”
subscription
status
content viewed
twitter followers
vs registered
users
of customers update
their services 3 times a
year
95%
CONSTANT IMPROVEMENT
ONGOING VALUE
you
r
INTERCOM BUILT A FEATURE
NO ONE ASKED FOR
o Faster ticket resolution
o No need for both parties
to be online at the same
time
o A personalized
subscriber experience
video messaging
“We recently
created a feature in
Intercom that none
of our customers
were asking for…
video replies”
average revenue per
user
issue resolution
times
offline
interruptions
Engagement
Score
Name
Payments
Last Login
Address
Account Balance
Invoices
Billing Frequency
Segment
API Calls
Renewal Date
Email
Utilization
MRR
ARPU
Churn
Probability
They combine their financial,
demographic, and behavioral
data
… to maximize
subscription business growth
SLACK :
Are we maximizing revenue per
account?
THE ECONOMIST:
Who are my best conversion, upsell and
cross-sell candidates?
INTERCOM :
What areas of my product should I
invest in?
AND MORE…
Who are my champions?
Who is at risk of churn?
WHAT DO ALL THESE COMPANIES HAVE IN COMMON
?
SUBSCRIBER IDENTITY
RECORD
Segment
Favorite
Actions
Usage Pulse
Momentum
Usage
Intensity
Utilization
Financial Impact
Expansion Potential
Projected Revenue
Comparisons
Journey
Churn Potential
Lifetime Value
Engagement
Score
Persona
Powered by a Subscriber ID
Capturing more market share
50% of American Households subscribe to
Prime
Owns the Subscriber ID
Tracks your lifetime browsing and purchase
history
Delivers the Subscription Experience
Real-time offer suggestions and 1HR delivery
Losing e-commerce market share
Grew 11.8% QoQ while market grew 15%
QoQ
Does not know the Subscriber ID
15 years, 1.5M employees across 5K stores
don’t know you
Lack of choice for subscribers
Light pick-up, delivery, payment gateways,
and e-commerce only 3% of business
COMPANY CULTURES ARE SHIFTING
THEIR FOCUS TO THE SUBSCRIBER
01
Product manager
Build capabilities based on most used
features 04
Product marketing
Price products to value
02
Finance
Prevent churn before it happens
05
Sales
Configure tailored offers based on usage
patterns
03
Customer Success
Prescribe best practices with consultative
account management 06
Marketing
Send targeted campaigns with relevant
messaging
BUT EVERY DEPARTMENT
IS USING THEIR OWN TOOL
Marketing Sales
Customer
Success
Support Finance Operations
Send Campaigns Work Opportunities Manage Outreach Resolve Issues Forecast and Plan Share Performance
o Out of date information
o Missing metrics
o Duplicate records
o Partial data
o Incorrect data
WHICH RUNS
ON A
FRAGMENTED
VIEW OF YOUR
SUBSCRIBERS
THAT’S WHY WE BUILT
INSIGHTS
COMBINE FINANCIAL, BEHAVIORAL, AND DEMOGRAPHIC
DATA FOR EVERY DEPARTMENT TO SHARE
- No duplicate accounts
- Real-time metrics
- Full financial history
Anchored by Zuora, the system of
truth
COMPUTE YOUR MOST VALUABLE LEADING INDICATORS
FOR CONVERSION, EXPANSION, AND RETENTION
FINANCIAL, BEHAVIORAL AND
DEMOGRAPHIC DATA SOURCES
PREDICTIVE
INDICATORS
TAILORED
INDICATORS
60+ STANDARD INDICATORS
Persona
Usage Intensity
Daily Active Users
Sessions Per Week
Contracted Utilization
Add-ons Available
Lifetime Value
Churn Probability
Conversion Probability
Engagement ScoreINTERNAL
PREDICTIVE
SCORING
DATA SCIENCE
101
Understand
Discover factors
driving outcomes
Predict
Forecast outcomes in
advance
Influence
Take action towards
better results
CHURN PROBABILITY &
ENGAGEMENT SCORE
Analyzes account actions and usage data
to predict renewals, upsells, down-sells
and churn
CHURN PROBABILITY
A 0% - 100% probability of events calibrated
to match real outcomes (i.e., conversion,
upsell, churn)
ENGAGEMENT SCORE
An easy-to-use summary of account health
ranking from 1-100 with 1 being the lowest
probability of a good outcome and 100 being
the highest
INTERPRETABLE PREDICTIONS
IT’S A REQUIREMENT, NOT A LUXURY
“ It’s a human job to
make interventions that
improve outcomes ”
01
Understand causes of
the outcome
02
Understand variables
correlated with the
outcome
03
Design effective
customer segments
04
Send targeted sales &
marketing campaigns
SCORE
DECOMPOSITION
The Engagement Score
decomposes into point
values for each
contributing metric
decompositi
on
Provides insights into
each accounts relative
strengths and
weaknesses
relativity
Helps you decide what
actions to take and how
to prioritize them
prioritizatio
n
Not all accounts are the
same
differenc
e
METRICS-FIRST METHODOLOGY
Regressio
n
Standard
Features
Black Box
Standard
Features
Regression
Insights
Features
Black
Box
Insights
Features
Units(TopDecile)
In academia
o Data is fixed and the focus is
on algorithms
o Naïve young data scientists
brag about what algorithm
they use
In the real world
o Best accuracy is achieved with
good metrics, not algorithms
o Many books and articles
corroborate our own
experience on this
o Yet the fixation on algorithms
continues for many
INSIGHTS DATA & METRICS
PROCESS
3. model algorithm
Model algorithm selects more predictive
metrics that have sensical correlation to
compute the score
1. design metrics
Zuora guides design of metrics with
customer
2. analyze metrics
Insights data science process analyzes and
proposes new metrics based on best-
practices
4. maintain
interpretabilityMaintaining interpretability throughout the
entire process
DEMO
LEARN MORE
Visit us @ The Learner’s
Lounge
thank you.

Subscribed 2017: Turn Customer Data Into Winning Subscriber Experiences

  • 1.
    ≈ TURN CUSTOMER DATAINTO WINNING SUBSCRIBER EXPERIENCES Matthew Darrow, VP of Product @ Zuora Carl Gold, Chief Data Scientist @ Zuora
  • 2.
    ≈ Matthew Darrow VP of Product CarlGold Chief Data Scientist
  • 3.
    WE NOW LIVEIN A SUBSCRIPTION ECONOMY #shifthappens
  • 4.
    THE WORLD. SUBSCRIBED. 78% Ofpeople in the UK subscribe to at least one product or service - You Gov Study 2016 50% Of people in France are moving away from traditional ownership - Institut Français D’opinion Publique (IFOP) 80% Of German companies have dealt with the issue of subscription business models. - IDG Research Services $420B Spent on subscriptions in the US in 2015; up from $215B in 2000. - Credit Suisse
  • 5.
    THAT’S WHY SUBSCRIPTIONREVENUES ARE GROWING 9X FASTER THAN S&P 500
  • 6.
    HOW DID THESESUBSCRIPTION BUSINESSES GROW SO FAST ?
  • 7.
    OUTCOMES Value-Based Pricing PERSONALIZATION Tailored Experience CONSTANTIMPROVEMENT Ongoing Value THEY DELIVER ON THE SUBSCRIPTION EXPERIENCE
  • 8.
    of customers employ usage-basedpricing models 78% OUTCOMES VALUE-BASED PRICING
  • 9.
    SAAS COMPANIES REGULARLY TWEAKTHEIR PRICING pricing changes per quarter 1 1 $100M + 40%+ 25 %make more pricing changes have usage- based pricing revenue from usage charges
  • 10.
    you r SLACK SAID “FAIR ISFAIR” o only get billed for what you use o don’t pay for users that haven’t logged in o get pro-rated credit for inactive pre-paid users fair billing policy
  • 11.
  • 12.
    of customers offer personalizedservices85% PERSONALIZATION TAILORED EXPERIENCE
  • 13.
    THE ECONOMIST TURNEDSOCIAL VISITORS INTO 1K NEW SUBSCRIBERS IN 8 MONTHS o cross-referenced Twitter followers with those registered on Economist.com o tweeted at registered readers featuring timely content o invited non-registered users to subscribe to newsletters and prompted paid users to try the app let’s connect! “People who have registered on our website and are active on social media are our most effective audience segment for driving conversions”
  • 14.
  • 15.
    of customers update theirservices 3 times a year 95% CONSTANT IMPROVEMENT ONGOING VALUE
  • 16.
    you r INTERCOM BUILT AFEATURE NO ONE ASKED FOR o Faster ticket resolution o No need for both parties to be online at the same time o A personalized subscriber experience video messaging “We recently created a feature in Intercom that none of our customers were asking for… video replies”
  • 17.
    average revenue per user issueresolution times offline interruptions
  • 18.
    Engagement Score Name Payments Last Login Address Account Balance Invoices BillingFrequency Segment API Calls Renewal Date Email Utilization MRR ARPU Churn Probability They combine their financial, demographic, and behavioral data … to maximize subscription business growth SLACK : Are we maximizing revenue per account? THE ECONOMIST: Who are my best conversion, upsell and cross-sell candidates? INTERCOM : What areas of my product should I invest in? AND MORE… Who are my champions? Who is at risk of churn? WHAT DO ALL THESE COMPANIES HAVE IN COMMON ?
  • 19.
    SUBSCRIBER IDENTITY RECORD Segment Favorite Actions Usage Pulse Momentum Usage Intensity Utilization FinancialImpact Expansion Potential Projected Revenue Comparisons Journey Churn Potential Lifetime Value Engagement Score Persona Powered by a Subscriber ID
  • 20.
    Capturing more marketshare 50% of American Households subscribe to Prime Owns the Subscriber ID Tracks your lifetime browsing and purchase history Delivers the Subscription Experience Real-time offer suggestions and 1HR delivery Losing e-commerce market share Grew 11.8% QoQ while market grew 15% QoQ Does not know the Subscriber ID 15 years, 1.5M employees across 5K stores don’t know you Lack of choice for subscribers Light pick-up, delivery, payment gateways, and e-commerce only 3% of business
  • 21.
    COMPANY CULTURES ARESHIFTING THEIR FOCUS TO THE SUBSCRIBER 01 Product manager Build capabilities based on most used features 04 Product marketing Price products to value 02 Finance Prevent churn before it happens 05 Sales Configure tailored offers based on usage patterns 03 Customer Success Prescribe best practices with consultative account management 06 Marketing Send targeted campaigns with relevant messaging
  • 22.
    BUT EVERY DEPARTMENT ISUSING THEIR OWN TOOL Marketing Sales Customer Success Support Finance Operations Send Campaigns Work Opportunities Manage Outreach Resolve Issues Forecast and Plan Share Performance
  • 23.
    o Out ofdate information o Missing metrics o Duplicate records o Partial data o Incorrect data WHICH RUNS ON A FRAGMENTED VIEW OF YOUR SUBSCRIBERS
  • 24.
    THAT’S WHY WEBUILT INSIGHTS
  • 25.
    COMBINE FINANCIAL, BEHAVIORAL,AND DEMOGRAPHIC DATA FOR EVERY DEPARTMENT TO SHARE - No duplicate accounts - Real-time metrics - Full financial history Anchored by Zuora, the system of truth
  • 26.
    COMPUTE YOUR MOSTVALUABLE LEADING INDICATORS FOR CONVERSION, EXPANSION, AND RETENTION FINANCIAL, BEHAVIORAL AND DEMOGRAPHIC DATA SOURCES PREDICTIVE INDICATORS TAILORED INDICATORS 60+ STANDARD INDICATORS Persona Usage Intensity Daily Active Users Sessions Per Week Contracted Utilization Add-ons Available Lifetime Value Churn Probability Conversion Probability Engagement ScoreINTERNAL
  • 27.
  • 28.
    DATA SCIENCE 101 Understand Discover factors drivingoutcomes Predict Forecast outcomes in advance Influence Take action towards better results
  • 29.
    CHURN PROBABILITY & ENGAGEMENTSCORE Analyzes account actions and usage data to predict renewals, upsells, down-sells and churn CHURN PROBABILITY A 0% - 100% probability of events calibrated to match real outcomes (i.e., conversion, upsell, churn) ENGAGEMENT SCORE An easy-to-use summary of account health ranking from 1-100 with 1 being the lowest probability of a good outcome and 100 being the highest
  • 30.
    INTERPRETABLE PREDICTIONS IT’S AREQUIREMENT, NOT A LUXURY “ It’s a human job to make interventions that improve outcomes ” 01 Understand causes of the outcome 02 Understand variables correlated with the outcome 03 Design effective customer segments 04 Send targeted sales & marketing campaigns
  • 31.
    SCORE DECOMPOSITION The Engagement Score decomposesinto point values for each contributing metric decompositi on Provides insights into each accounts relative strengths and weaknesses relativity Helps you decide what actions to take and how to prioritize them prioritizatio n Not all accounts are the same differenc e
  • 32.
    METRICS-FIRST METHODOLOGY Regressio n Standard Features Black Box Standard Features Regression Insights Features Black Box Insights Features Units(TopDecile) Inacademia o Data is fixed and the focus is on algorithms o Naïve young data scientists brag about what algorithm they use In the real world o Best accuracy is achieved with good metrics, not algorithms o Many books and articles corroborate our own experience on this o Yet the fixation on algorithms continues for many
  • 33.
    INSIGHTS DATA &METRICS PROCESS 3. model algorithm Model algorithm selects more predictive metrics that have sensical correlation to compute the score 1. design metrics Zuora guides design of metrics with customer 2. analyze metrics Insights data science process analyzes and proposes new metrics based on best- practices 4. maintain interpretabilityMaintaining interpretability throughout the entire process
  • 34.
  • 35.
    LEARN MORE Visit us@ The Learner’s Lounge
  • 36.

Editor's Notes

  • #4 WELCOME LIVE IN A SUBSCRIPTION ECONOMY This is what we’ve been talking about for the past 8 years… the arrival of the subscription economy A better way of doing business… At the heart of the Subscription Economy is the idea that customers are happier subscribing to outcomes they want, when they want them, rather than purchasing a product with the burden of ownership Those of you in SaaS, you got this from the beginning – but now everyone else is moving this way too
  • #5 THIS IS A GLOBAL PHENOMENON The Subscription Economy is not something that is limited to a few regions, we see this change happening around the world Studies have been done – by the Economist, by independent research groups across the globe In this last year we’ve been asked to hold our Subscribed events in London, Paris, Tokyo, Stockholm, Tel Aviv, and San Francisco, and now our first third one in Australia
  • #6 what we want to do is share a bunch of insights
  • #8 Outcomes - 78% of customers employ usage based pricing models Custom - 85% of our customers offer services that can be personalized Constant improvement - 95% update their services 3 times a year (introduced a new rateplan)
  • #20 Quote from Subrata @ The Economist For the first time, the publisher will be able to analyze data on subscriber behavior so that it can nurture relationships. “One of the reasons we’re doing this is to start to own our own data. The data used to be held hostage by the vendors we had and we had to pay them to get hold of our own data. From the mid-term of your subscription, we want to check your behavior. We don’t want, when we send you a renewal offer, to have you decline. We want to make sure your engagement is there.”
  • #31 It is a human job to make interventions that improve outcomes Churn reduction (etc.) are not problems with one-size fits all solutions Repeat: Materially influencing customer behavior is not going to be easy Interpretability is a requirement, not a luxury Understand causes of the outcome Understand variables correlated with the outcome Design effective customer segments Targeted Sales & Marketing campaigns for maximum effect
  • #33 Worse than bragging about an algorithm is keeping an algorithm secret I'll tell you about the algorithms we use, but not about the metrics
  • #34 Zuora owns & understands subscription data Subscription data model can be complex! Source of truth on account outcomes Zuora guides design of metrics with customer Insights Data Science Process analyzes and proposes new metrics based on best-practices Model algorithm selects most predictive metrics that have sensical correlation to compute the score Maintaining interpretability throughout the entire process