Download to read offline


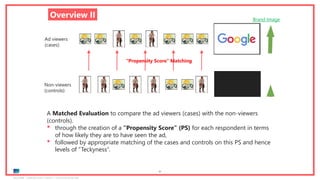


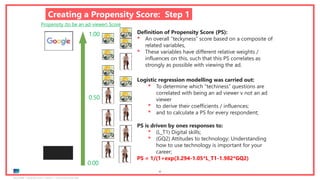

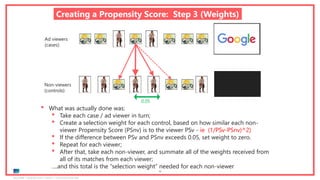
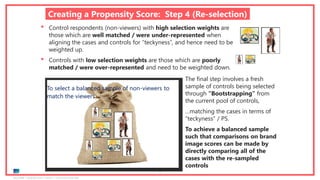
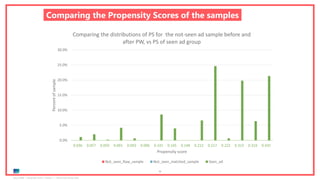
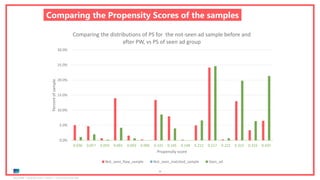
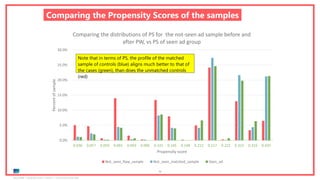
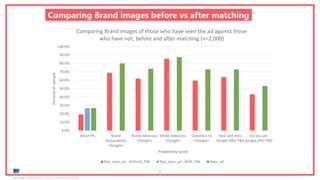
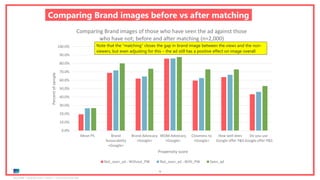


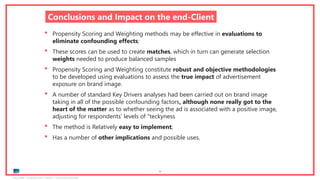


The document provides information about using propensity score matching to evaluate the effect of advertising on a client's brand image. It discusses: - Using propensity scoring methodology to create a matched sample of "controls" (non-viewers) for "cases" (viewers) to help assess the impact of seeing an advertisement on having a positive brand image, while controlling for other factors. - Other potential applications of propensity score matching. - In conclusion, propensity score matching allows comparing ad viewers to non-viewers who have been matched on characteristics to help isolate the effect of viewing the ad from other influences on brand perceptions.


![Marketing finance[1]](https://cdn.slidesharecdn.com/ss_thumbnails/marketingfinance1-131127220027-phpapp01-thumbnail.jpg?width=640&height=640&fit=bounds)


