Downloaded 230 times


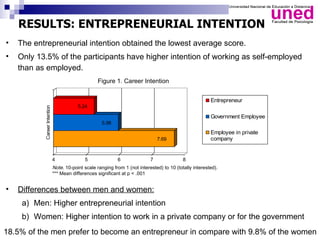
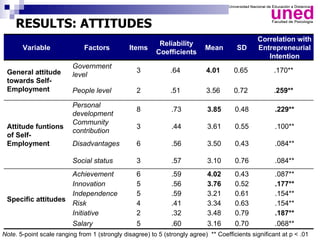


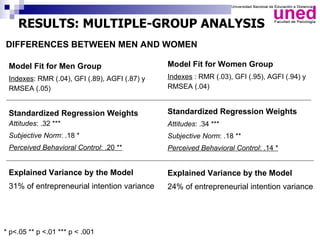


The study examines the entrepreneurial intentions of Spanish students using the Theory of Planned Behavior (TPB) and finds that overall, these students display low entrepreneurial intention, primarily favoring employment in private companies. The TPB explains 27% of the variance in entrepreneurial intention, with attitudes being the strongest predictor across genders, while social legitimacy and support for entrepreneurship are notably low. The research highlights the importance of social support, particularly from family, and identifies entrepreneurial self-efficacy as a crucial factor, especially for men.