Download as PDF, PPTX

![Internal usage only
Chemigrams
m/m0;[-]
Temperature
0
TG
DTG
1
CO
HCL](https://image.slidesharecdn.com/practicalconcernsinega-150930214947-lva1-app6892/85/Practical-concerns-in-ega-13-320.jpg)
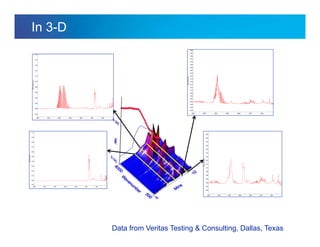
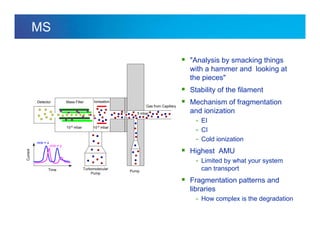
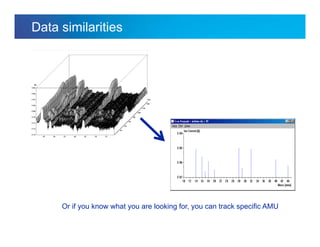
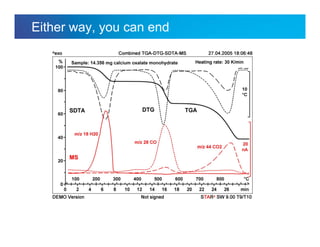

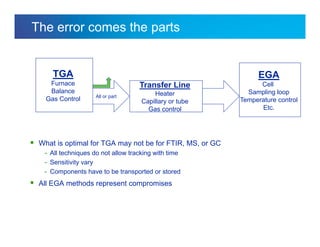
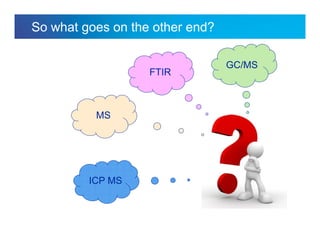
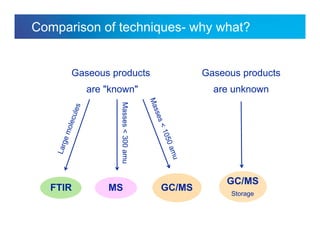
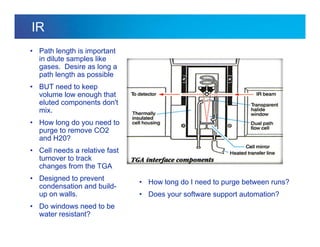
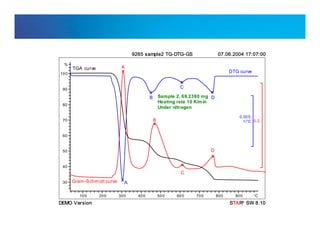
The document discusses the evolution and challenges of thermal gravimetric analysis (TGA) and evolved gas analysis (EGA) techniques, highlighting historical advancements and optimization concerns in measurements. It addresses the complexities in gas transport and detection methods, the importance of sample size and heating rates, and compares various techniques such as mass spectrometry (MS), gas chromatography-mass spectrometry (GC-MS), and Fourier-transform infrared spectroscopy (FTIR). Ultimately, the document emphasizes the need for careful selection and balancing of methods to achieve reliable analytical results.


![THERMOGRAVIMETRY ANALYSIS [TGA] AS PER PCI[M.PHARM]](https://cdn.slidesharecdn.com/ss_thumbnails/49-191219085241-thumbnail.jpg?width=640&height=640&fit=bounds)


