Download to read offline


![78
Speen2
Offers
–Electronicdevelopment:Developcustomelectronicdevicesfromtheideatofinalproduct.
– Product consultancy: Offer new ideas to improve your company.
– Viability study: Offer consultancy in inputs needed and do ability.
– Manufacturing cost analysis: Offer skills to estimate production costs.
– Technological partner: Offer collaborates in: Hardware design, firmware program-
ming (mainly for microcontrollers], wireless and wired communications, control, sen-
sors and actuators, power electronics, design under normative specifications, prototype
PCB manufacturing by drilling-milling machine, electronic parts soldering, debugging
working prototypes, smart devices, among others. Our expertise allows us work in spe-
cific sectors as smarmetering and submetering.
Demands
– Market researcher: Seeking a partner which could suggest a new electronic device
under a focus close to market. The idea should be born from a real chance in a real case,
and it would be analyzed to be developed as a prototype for testing.
– Commercial/technological partner: Looking for a strong commercial profile with knowl-
edge about electronic devices and technologies. Partner should have: Strong commer-
cial profile and skills, extensive client portfolio, technical knowledge about electronic
devices, development and technologies and Creative focus, able to suggest solutions to
specific engineering problems.
Certifications
– CMMI (in process] ISO 9001 (in process]
– UNE166002 (in process), about R&D
+idea
Offers
Engineering development and design. Focused in environment and industrial automa-
tion for Water treatment, measurement and control.
Demands
Smart Cities
Certifications
– ISO 9001
– ISO 1 4000](https://image.slidesharecdn.com/9f065297-b183-47d3-9f14-04be26fd5e34-150212123008-conversion-gate02/85/Greentech-Industry-78-320.jpg)


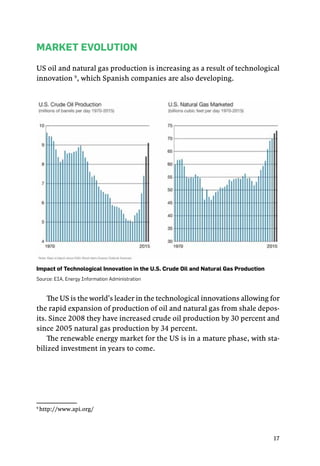
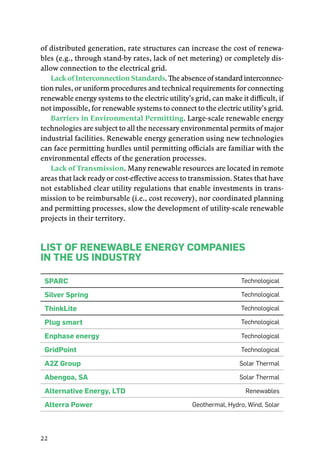
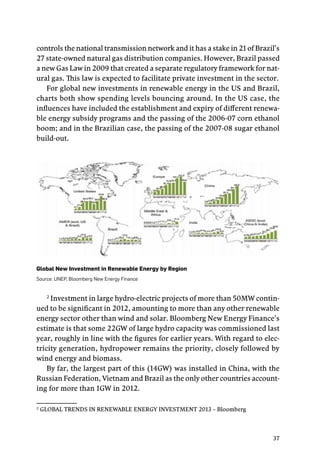
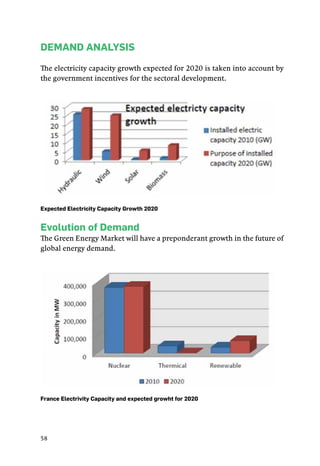
This document provides a market study and analysis of the renewable energy sector in the United States. It discusses trends in the sector including declining reliance on renewable portfolio standards, increasing natural gas production, and policy uncertainty negatively impacting investment. The document also outlines government plans to support the sector through policies like renewable portfolio standards and public benefits funds. It identifies strengths, weaknesses, opportunities, and threats in the energy market and analyzes demand trends, the role of multilateral organizations, and barriers to entry. The study aims to identify opportunities for business partnerships between American renewable energy companies and RYME.


![Damaris.[1]](https://cdn.slidesharecdn.com/ss_thumbnails/damaris-1-101102152944-phpapp01-thumbnail.jpg?width=640&height=640&fit=bounds)


