![ELECTRICITY GENERATION BY FUEL
BRAZIL X WORLD
BRAZIL 2010 WORLD 2008
Renewables = 87.2% Renewables = 18.7%
Hydro
81.2%
Nuclear Hydro
13.5% 15.9%
Other (**)
2.8%
Gas
21.3%
Biomass (*) Oil
5.5% Coal/peat
Wind 5.6% 41.0%
0.4%
Gas Oil Coal/peat
Nuclear 1.3%
5.8% 3.1%
2.6% ** Other includes geothermal, solar, wind, combustible renewables and waste, and heat.
* Mainly generated from the co-generation with sugar cane
Sources: EPE [BEN 2011 - Preliminary Results]
and IEA [Key World Energy Statistics - 2010]
2](https://image.slidesharecdn.com/1-4-josemiranda-121128083631-phpapp02/85/Jose-Miranda-EPE-2-320.jpg)
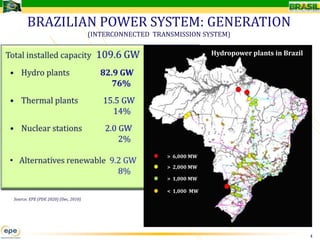

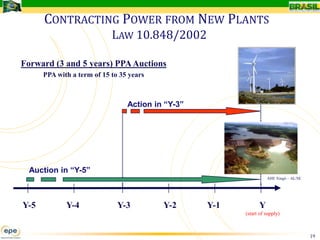
![HYDROPOWER
THE 10-YEAR ENERGY PLAN
32,634 MW
Contracted Expansion (24,064 MW)
6.000
6,000 5,469
Expansion Planned (8,570 MW)
4,893 4,997
5.000
5,000 1,128
4,197
1,012 1,330
4.000
4,000 3,499
MW
3.000
3,000
2,225 2,212
1,797 2,005 4,341
4,197 3,881
2.000
2,000
1,340 3,667 3,499
1,601
1,797 2,005 2,225
1.000
1,000
1,340
611
-
2011 2012 2013 2014 2015 2016 2017 2018 2019 2020
Source: EPE [PDE 2020]
18](https://image.slidesharecdn.com/1-4-josemiranda-121128083631-phpapp02/85/Jose-Miranda-EPE-18-320.jpg)
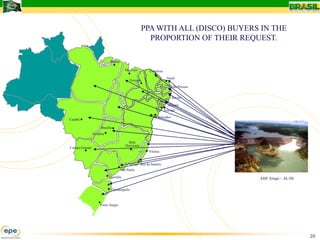


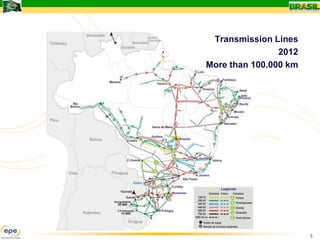
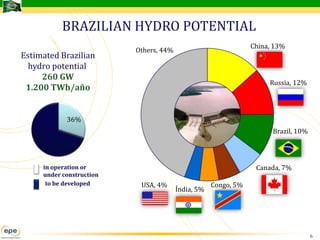
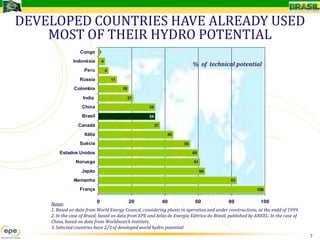
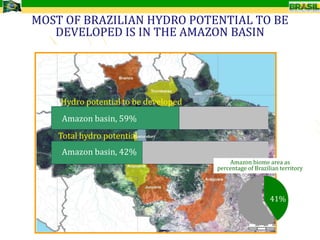
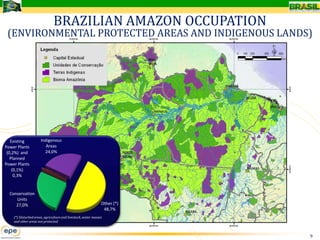
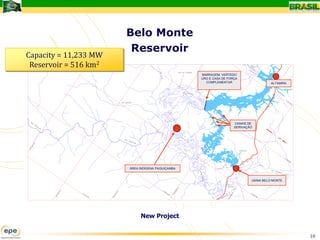
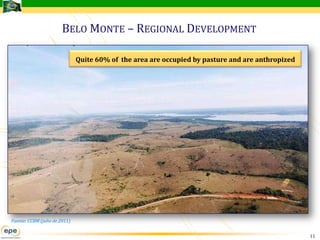
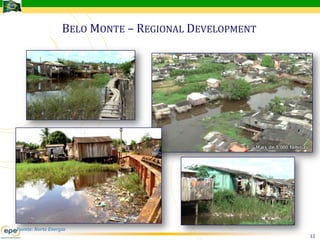
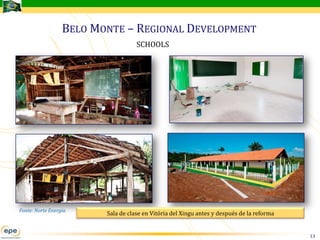
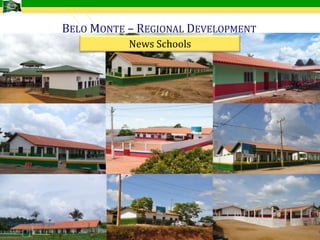
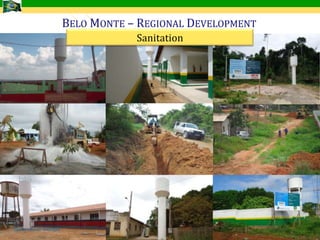
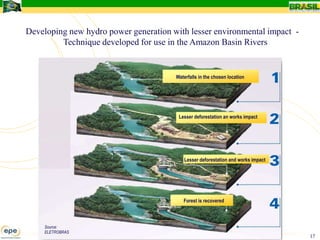
The document discusses trends in hydropower deployment globally and regionally. It notes that Brazil generates 87.2% of its electricity from renewables, mostly hydro at 81.2%. While Brazil has already developed 34% of its hydro potential, it has an estimated remaining potential of 260 GW, mostly in the Amazon basin. Major new hydro projects like Belo Monte aim to develop this clean energy resource while promoting regional development.