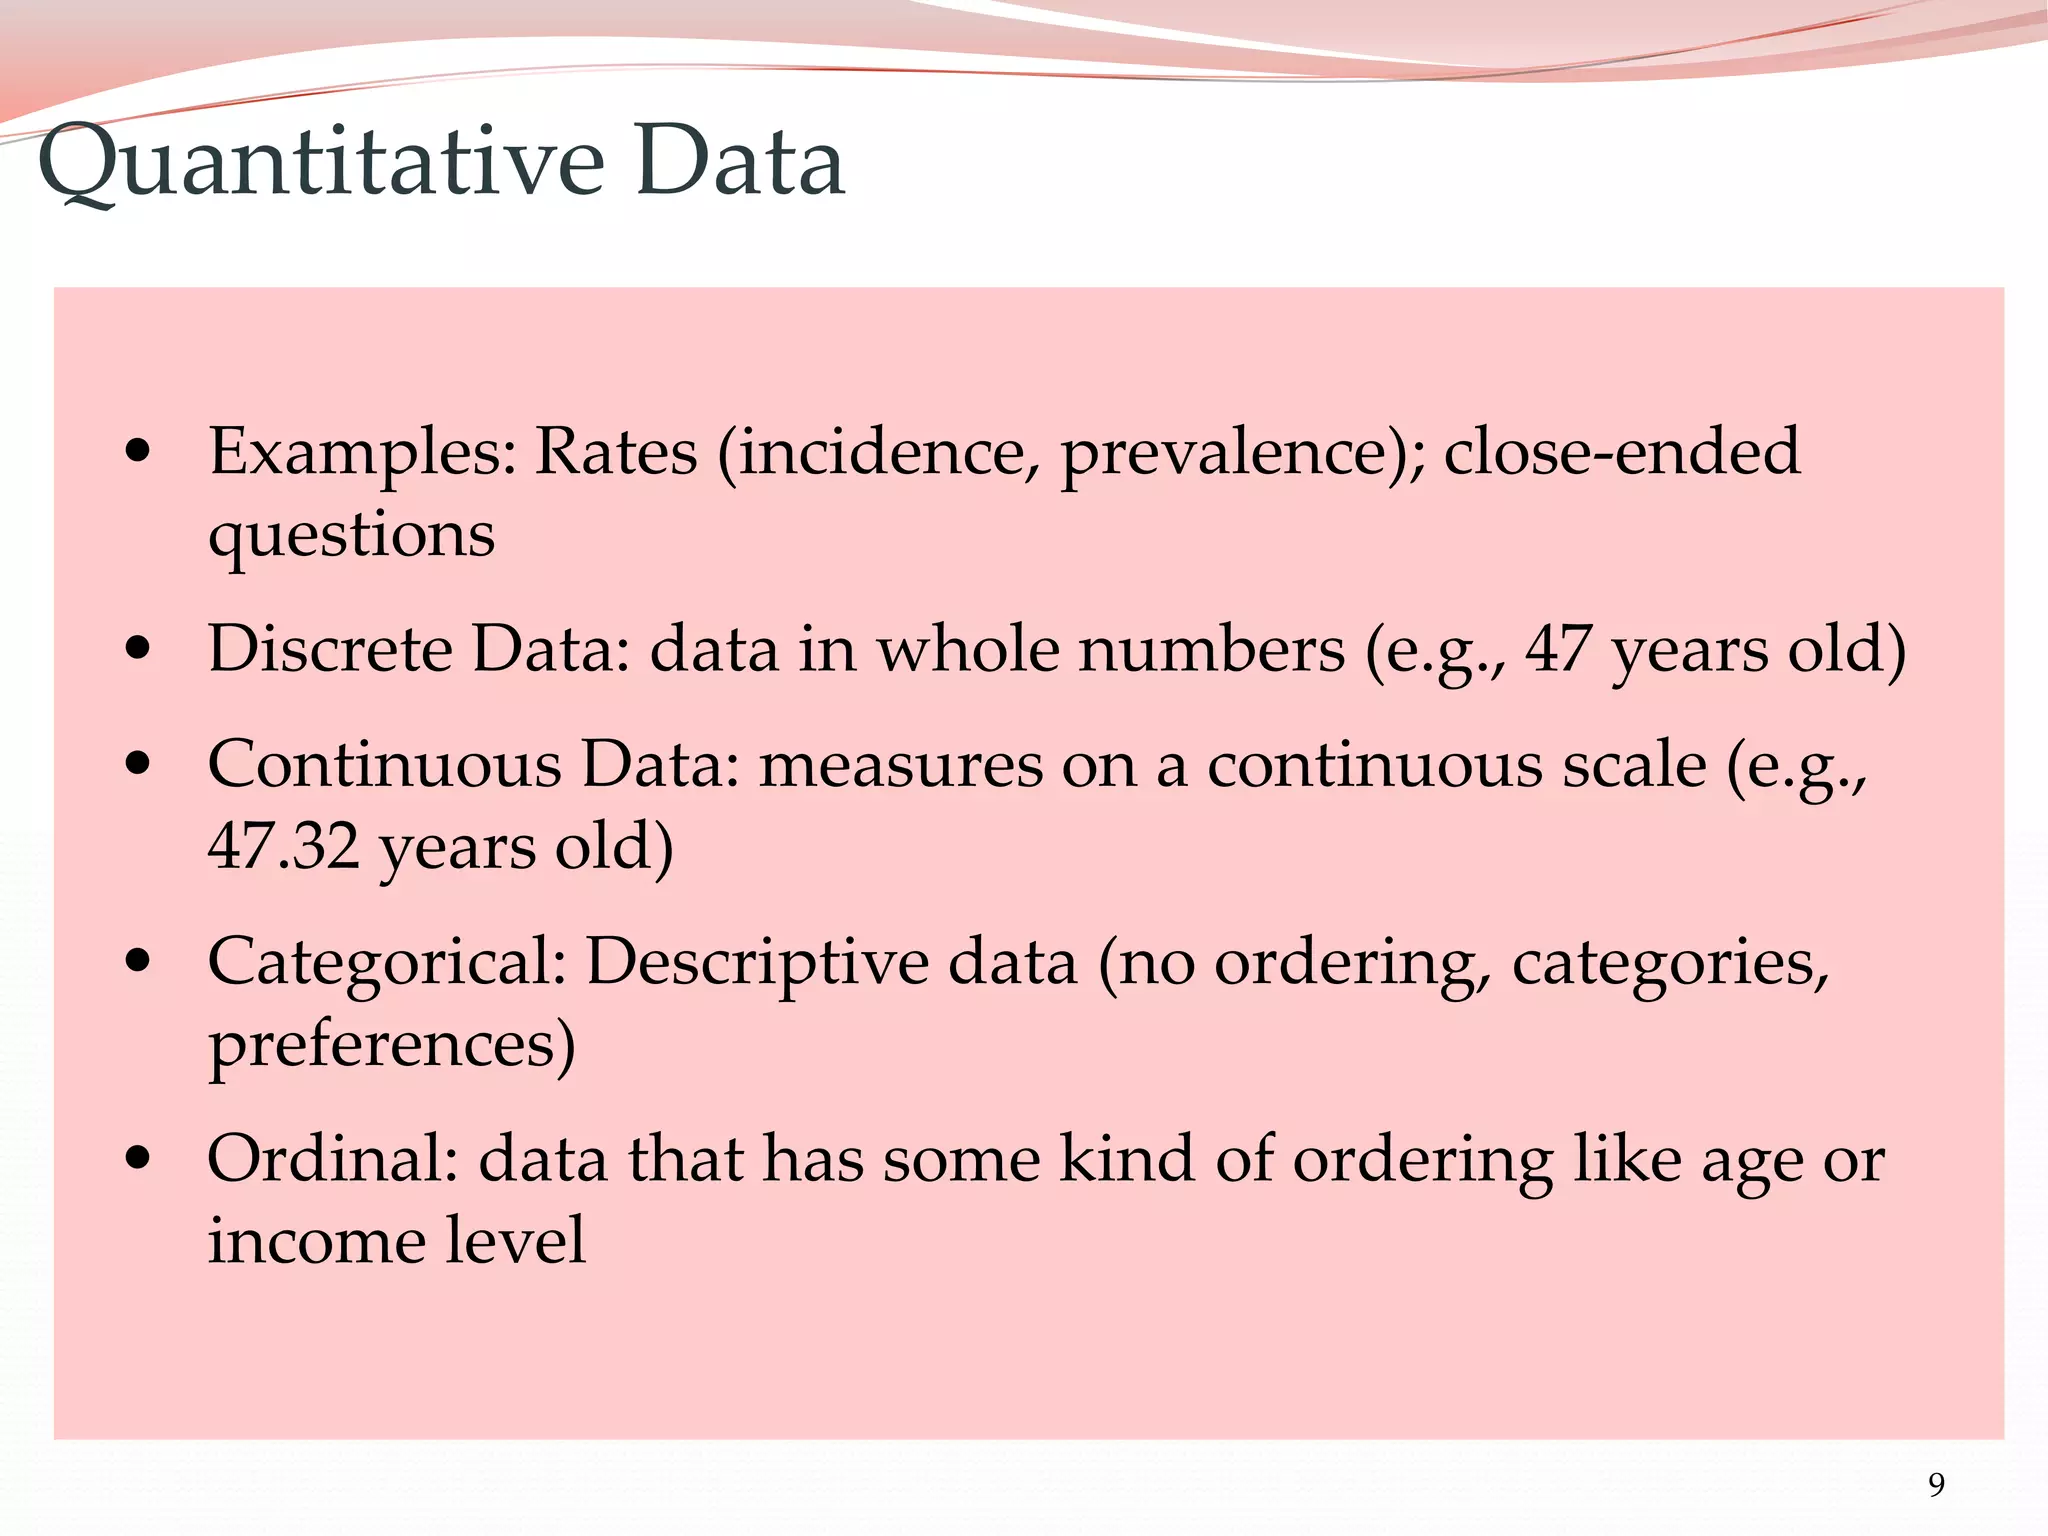
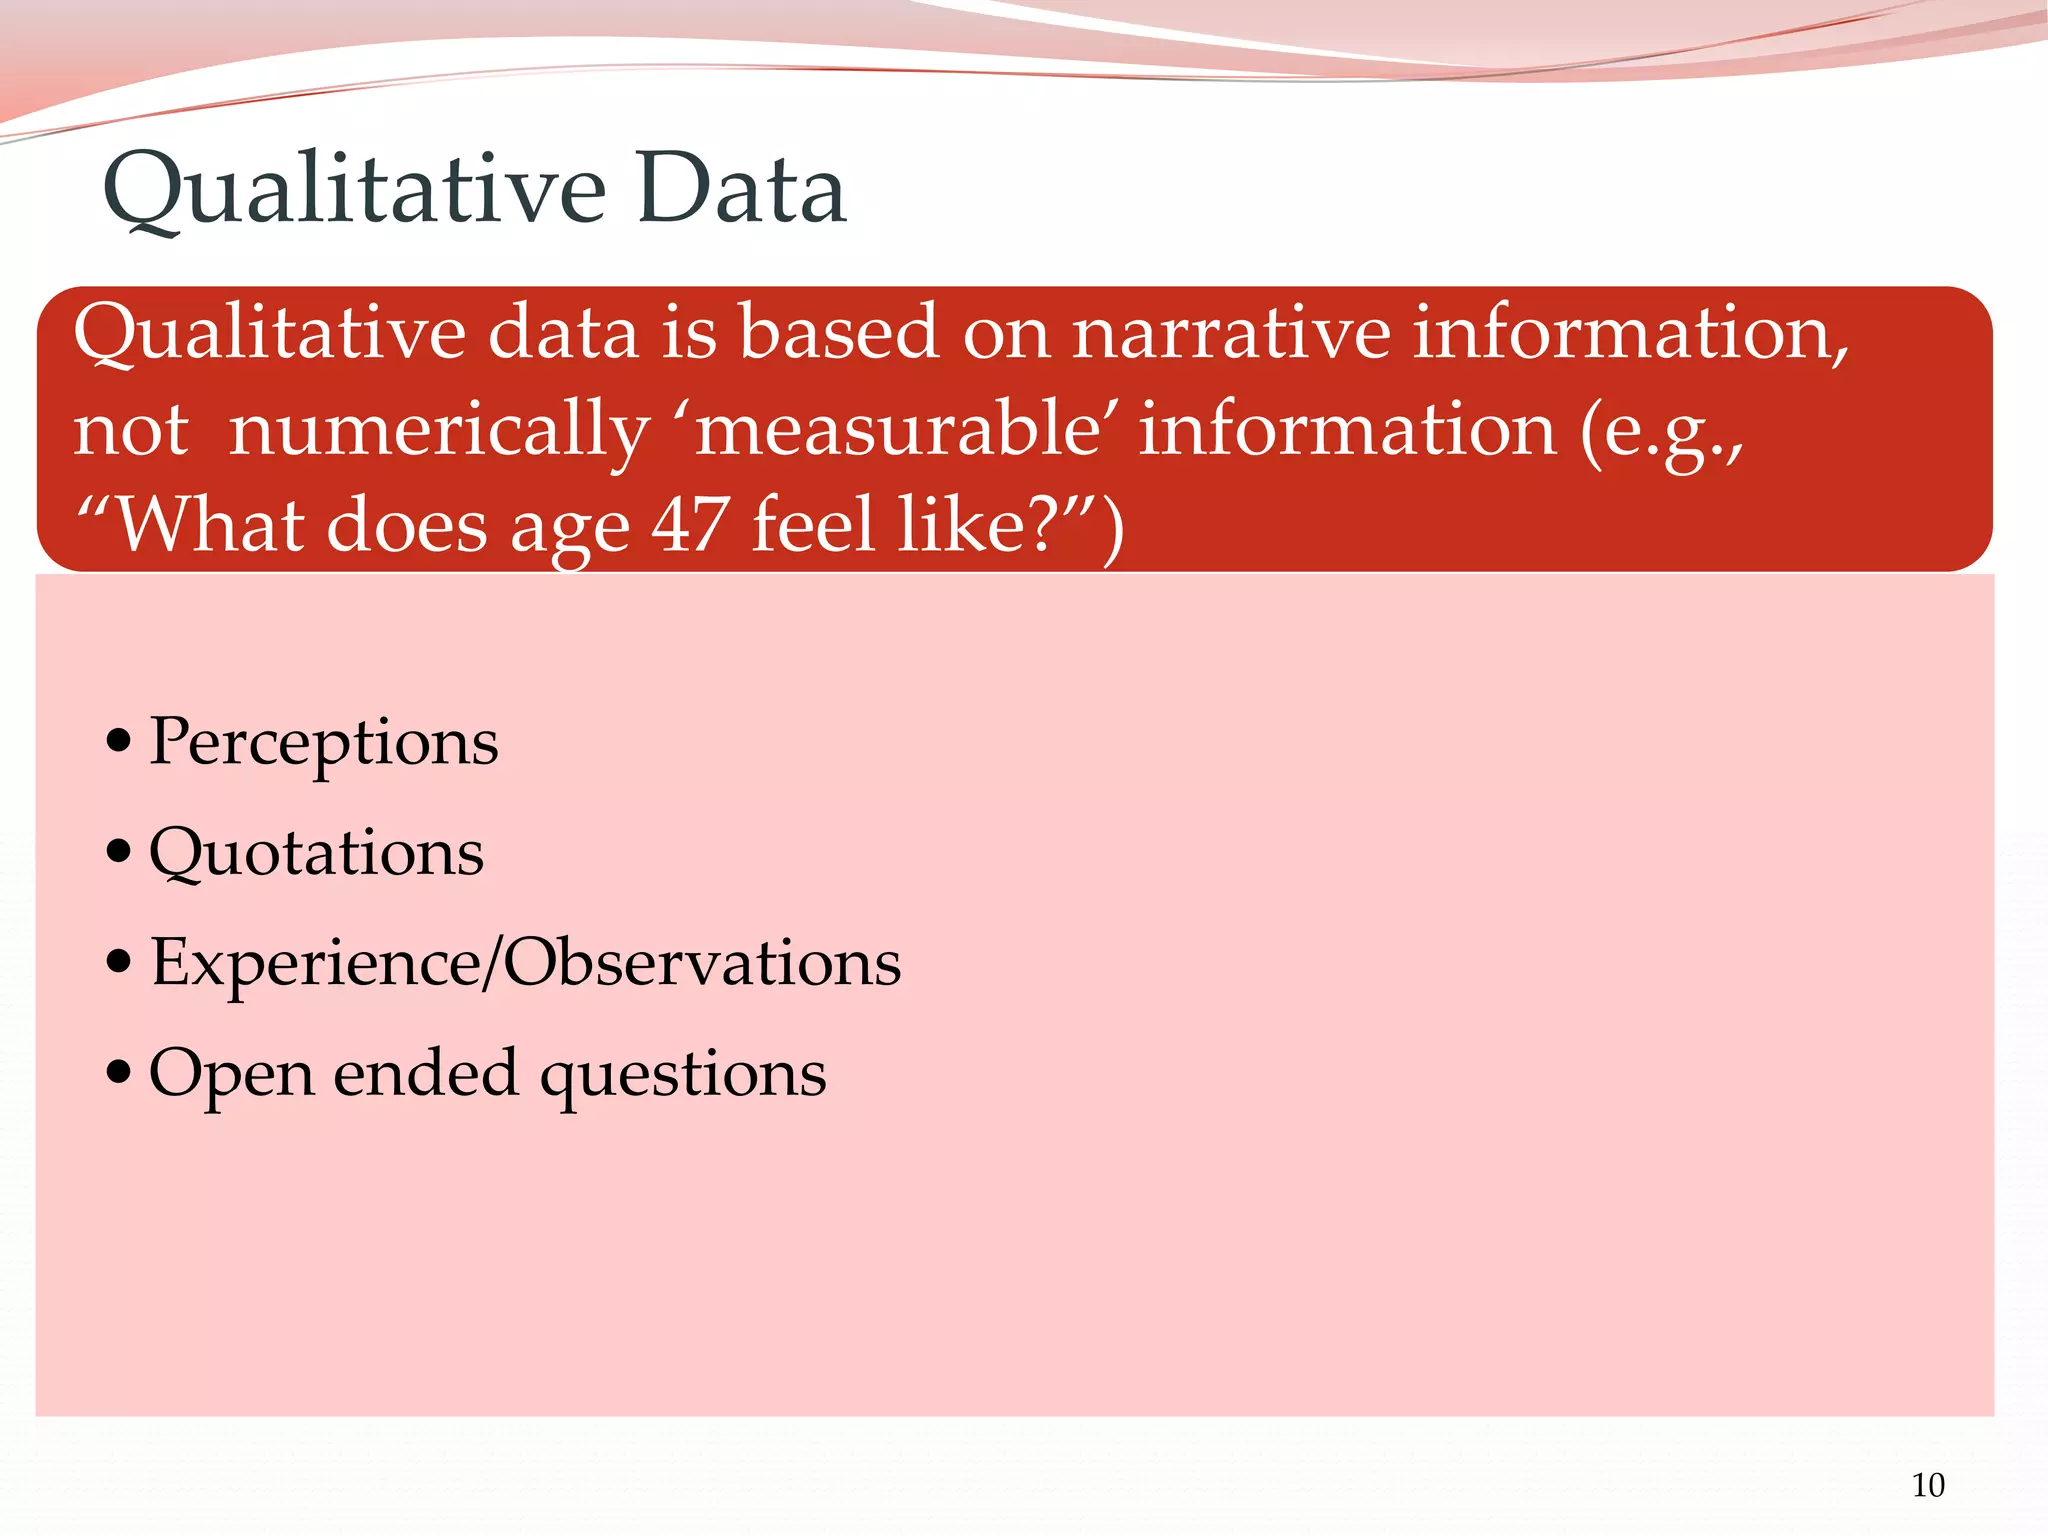
RESEARCH 101 TRAINING
How to be Smart About Research in 8 Hours or Less
Session 3: Data analysis,
interpretation, and presentation
July 13, 2017 @ 5:30-7:00 p.m. Eastern
Copyright 2017 Global Healthy Living Foundation, Inc.
All rights reserved.
1
The 3rd of 3 Sessions
1. Intro and research design
2. Research instruments and data collection
3. Data analysis, interpretation, and presentation
2
3
 Take care of yourself & ask for what you need
 Ask questions (some research lingo may be
unfamiliar and we are here to break it down)
 Step up, step back (draw out others’ ideas)
 Please try to stay off cell phone and social media
 Acknowledge everyone’s experience is different
 “One mic” (please mute phone when not
speaking)
 Session is being recorded
Agreements
Today’s Agenda
1. Analysis and Presentation
2. Interpretation and Conclusions
4
5
1. Analysis and Presentation
6
 Unlikely you will be running the analysis entirely by
yourself!
 But, you may have the opportunity to:
 Code unstructured data
 Have input into the types of analysis to run
 Review the analysis results, and help interpret the findings
 Suggest changes to the way the analysis is run
 To do those things, you need a basic understanding of
how to read and interpret tables, charts, and other types
of data analysis output
Data Analysis – the Patients’ Role
7
Method
Selection &
Sample
Selection
Research
Question
Data
Collection
Data
Analysis &
Presentation
http://www.pcori.org/sites/default/files/PCORI-Methodology-
101-Training-Booklet-and-Resource-Guide.pdf
Research Steps
8
•Level of education influences smoking behavior
•Weather has an impact on joint pain
Informed best guess
about what a study
may find
•Medicine A has better outcomes than medicine B
for chronic pain
•Medicine A has fewer side effects
You can have
multiple hypotheses
•Design your research study to test whether your
hypothesis is true. Do your observations support
your hypothesis or not?
•Test your hypothesis using statistical methods
•Draw conclusions
Test, Test, Test
Research Hypothesis
9
• Examples: Rates (incidence, prevalence); close-ended
questions
• Discrete Data: data in whole numbers (e.g., 47 years old)
• Continuous Data: measures on a continuous scale (e.g.,
47.32 years old)
• Categorical: Descriptive data (no ordering, categories,
preferences)
• Ordinal: data that has some kind of ordering like age or
income level
Quantitative Data
10
Qualitative data is based on narrative information,
not numerically ‘measurable’ information (e.g.,
“What does age 47 feel like?”)
•Perceptions
•Quotations
•Experience/Observations
•Open ended questions
Qualitative Data
11
Health researchers want to understand the effect of a
medication on people with a certain condition
1. Complete a survey of their
symptoms before and after
taking the medicine.
2. Measure their symptoms before
and after taking the medicine.
1. Interview patients & ask them
to talk about their experience
when taking the medicine.
2. Conduct social media
discussion about patient
experiences
Source: http://www.pcori.org/sites/default/files/PCORI-Methodology-101-Training-Booklet-and-Resource-
Guide.pdfthe medicine.
PCORI Example
Qualitative methods
Quantitative methods
12
Tools to Collect and Present Data
 Data can be presented in different formats that include
tables, graphs, narratives.
 Statistics is a tool that is used for quantitative research.
 Qualitative research uses non-statistical tools.
 Graphs can be used to present both qualitative and
quantitative data.
13
58
60
62
64
66
68
70
72
74
0 50 100 150 200
Graphs: A Useful Tool to Communicate
H
e
i
g
h
t
Weight Source ://www.drugabuse.gov/publications/drugfacts/hivaids-
drug-abuse-intertwined-epidemics
14
Data File Formats
15
Quant Data File Example
ID Drugprice Drugtype RA OA Whypharm
1 $99 Generic Yes No I like the convenience
2 $99 Generic Yes Yes
Cheap, easy to get
there
3 $99 Generic No Yes Convenient, friendly
4 $99 Generic No Yes Open 24 hours
5 $199 Brand Yes No Near my house
6 $97 Generic No No Free delivery
Unique
identifier
Categoric
variable
(Single
Response)
Numeric
variable
Categoric variables
(Multiple Response)
Open-ended
Variable
• Columns represent questions (variables)
• First row shows question (variable) names
• Remaining rows represent individual “cases” (participants, respondents)
16
Qualitative
• Transcripts (from
focus group
discussion or
interviews)
• Audio and video
recordings
• Social media posts
Data File Formats
Social Media Chat: Can Pets Help
People with Chronic Illness?
Getting my puppy has made so many
days so much better.
My dogs are my heating pads, my
laughter, my secret keepers, my
exercise, my bed warmers, my heart and
soul. They're there at night when I need
to cry over the pain without judgment.
My cats, horse, and pup give me a
reason to get out of bed on the tough
days.
17
 Not computer programming “coding”
 Rather: Sifting through verbatim responses in patients’
own words, and “bucketizing” the results according to
themes you detect
 Used for both qualitative and quantitative research
 Patient insight can be very useful here
 But also could introduce bias, so be aware
Qual Data Analysis: What is Coding?
18
ID Whypharm Convenient Price
1 I like the convenience 1
2 Cheap, easy to get there 1 1
3 Convenient, friendly 1
4 Open 24 hours 1
5 Near my house 1
6 Free delivery 1 1
7 Low prices 1
8 Can walk there 1
9 Coupons 1
10 In my grocery store 1
Coding - Example
19
 What do you think of this website?
 The graphics are appealing
 The material is interesting
 I couldn’t find what I was looking for
 The font size is a bit too small
 I like the variety of information
 The information is presented in a way that is easy to
understand
 I like the overall look
 It’s hard to see on my smartphone
Discussion - Coding
What codes would you create for the following?
20
Qualitative Analysis - Word Clouds
Source: BJC Health Connected Care
http://www.bjchealth.com.au/connected-care/2013/05/bjc-rheumatology-word-art/
21
Basic Analysis Methods
22
 To analyze
quantitative data we
use statistics
 Research question(s)
and data types dictate
analysis and statistical
methods
Data Analysis
N = Population size
n = Sample size
p = Statistical significance
(How likely differences
between groups are due to
chance)
p <0.05 means less than a 5% likelihood (probability) that study
findings are due to chance (and therefore, a greater than 95%
likelihood that the interventions are related to the results)
23
 Statistical significance can be manipulated:
 http://fivethirtyeight.com/features/science-isnt-
broken/?ex_cid=538fb
 Statistically significant differences are not always
important research findings*
 Clinical significance tells whether research findings are of
practical use to patients and clinicians
Statistical Significance – A Couple of Caveats
24
 Best for understanding “typical”, but still need to
understand distribution/range
 Use t-tests to compare results across groups
Measures of Central Tendency
The arithmetic average of a series of values
Mean
Median
Mode
The middle value in a series
The value that occurs most often in a series
Example:
2, 2, 2, 4, 6, 8, 9
4.7
4
2
25
A way of summarizing data by describing how spread out
the data is.
The average score in a class on a math test may be 65
points. But we may also want to talk about the higher
scores (above 65) and the lower scores (below 65).
Measures of Spread can be calculated using different
statistical methods such as Standard Deviation and
variance.
Measures of Spread
26
Frequency Data Tables
The number of observations
in each category is called
frequency.
Graphs
X-Axis = Categories
Y-Axis = Frequency
Data: Tables & Graphs
Weight in
grams
Frequency %
0-19 3 10%
20-39 14 15%
40-49 8 30%
50+ 12 45%
0
1
2
3
4
5
6
7
Blood Grp A Blood Grp B Blood Grp 0 Blood Grp AB
Blood Groups
80
260
80
0
50
100
150
200
250
300
< $100 $100-$199 $200+
27
Distribution Example & Discussion
How would you describe the results of this study?
Drug Price ($)
Frequency
Price Paid for a One-Month Prescription
(n=420)
80
100
0 0 0 0 0 0 0
60
100
40
20 20
0
20
40
60
80
100
120
<100 $100 110 120 130 140 150 160 170 180 190 200 210 220+
28
Central Tendency Example & Discussion
Mean = 153
Drug Price ($)
Price Paid for a One-Month Prescription
(n=420)
Now, how would you describe the results of this study?
Frequency
29
Crosstab Example & Discussion
Change in Perception of Pain After 3 Months
Exercise Group
(n=300)
Control Group
(n=300)
Increased 10% 12%
No change 14% 66%
Decreased 76% 22%
Total 100% 100%
How would you describe the results of this study?
30
2. Interpretation and Conclusions
31
Describing the data is the first step
Interpretation involves relating results to the research
questions, and sometimes, to previous research
Ultimately, what do you recommend based on the
results?
•How might this affect the target population? (Patient perspective
can be key here)
•What other research is needed?
What Does It All Mean?
32
There are a lot of things we didn’t cover, or just
touched on
• PCORI 101 Training Booklet covers a lot of good
material – some overlap with this training, and some
new
• We plan to continue the conversation…
Wrap-up
33
Thank You!
By Ashashyou (Own work) [CC BY-SA 4.0
(http://creativecommons.org/licenses/by-sa/4.0)], via Wikimedia Commons
34
 PCORI Methodology 101: Training booklet for patients and
stakeholders: http://www.pcori.org/sites/default/files/PCORI-
Methodology-101-Training-Booklet-and-Resource-Guide.pdf
 Gapminder.org: This resource has some very creative graphs and
resources to use statistics: http://www.gapminder.org/
 CDC: Data and statistics http://www.cdc.gov/datastatistics/
 Australian Bureau of statistics: A short video on statistical language:
http://www.abs.gov.au/websitedbs/a3121120.nsf/home/statistical+lan
guage+-+quantitative+and+qualitative+data
 Qualitative Health Research (QHR): This is a peer reviewed journal
on qualitative research: http://qhr.sagepub.com/
Useful Resources
35
 Graphics inspiration
 http://www.washingtonmonthly.com/magazine/mayju
ne_2011/features/the_information_sage029137.php
‘Extra Credit’

Ppr r101-session-3-smart

  • 1.
    RESEARCH 101 TRAINING Howto be Smart About Research in 8 Hours or Less Session 3: Data analysis, interpretation, and presentation July 13, 2017 @ 5:30-7:00 p.m. Eastern
  • 2.
    Copyright 2017 GlobalHealthy Living Foundation, Inc. All rights reserved. 1
  • 3.
    The 3rd of3 Sessions 1. Intro and research design 2. Research instruments and data collection 3. Data analysis, interpretation, and presentation 2
  • 4.
    3  Take careof yourself & ask for what you need  Ask questions (some research lingo may be unfamiliar and we are here to break it down)  Step up, step back (draw out others’ ideas)  Please try to stay off cell phone and social media  Acknowledge everyone’s experience is different  “One mic” (please mute phone when not speaking)  Session is being recorded Agreements
  • 5.
    Today’s Agenda 1. Analysisand Presentation 2. Interpretation and Conclusions 4
  • 6.
    5 1. Analysis andPresentation
  • 7.
    6  Unlikely youwill be running the analysis entirely by yourself!  But, you may have the opportunity to:  Code unstructured data  Have input into the types of analysis to run  Review the analysis results, and help interpret the findings  Suggest changes to the way the analysis is run  To do those things, you need a basic understanding of how to read and interpret tables, charts, and other types of data analysis output Data Analysis – the Patients’ Role
  • 8.
  • 9.
    8 •Level of educationinfluences smoking behavior •Weather has an impact on joint pain Informed best guess about what a study may find •Medicine A has better outcomes than medicine B for chronic pain •Medicine A has fewer side effects You can have multiple hypotheses •Design your research study to test whether your hypothesis is true. Do your observations support your hypothesis or not? •Test your hypothesis using statistical methods •Draw conclusions Test, Test, Test Research Hypothesis
  • 10.
    9 • Examples: Rates(incidence, prevalence); close-ended questions • Discrete Data: data in whole numbers (e.g., 47 years old) • Continuous Data: measures on a continuous scale (e.g., 47.32 years old) • Categorical: Descriptive data (no ordering, categories, preferences) • Ordinal: data that has some kind of ordering like age or income level Quantitative Data
  • 11.
    10 Qualitative data isbased on narrative information, not numerically ‘measurable’ information (e.g., “What does age 47 feel like?”) •Perceptions •Quotations •Experience/Observations •Open ended questions Qualitative Data
  • 12.
    11 Health researchers wantto understand the effect of a medication on people with a certain condition 1. Complete a survey of their symptoms before and after taking the medicine. 2. Measure their symptoms before and after taking the medicine. 1. Interview patients & ask them to talk about their experience when taking the medicine. 2. Conduct social media discussion about patient experiences Source: http://www.pcori.org/sites/default/files/PCORI-Methodology-101-Training-Booklet-and-Resource- Guide.pdfthe medicine. PCORI Example Qualitative methods Quantitative methods
  • 13.
    12 Tools to Collectand Present Data  Data can be presented in different formats that include tables, graphs, narratives.  Statistics is a tool that is used for quantitative research.  Qualitative research uses non-statistical tools.  Graphs can be used to present both qualitative and quantitative data.
  • 14.
    13 58 60 62 64 66 68 70 72 74 0 50 100150 200 Graphs: A Useful Tool to Communicate H e i g h t Weight Source ://www.drugabuse.gov/publications/drugfacts/hivaids- drug-abuse-intertwined-epidemics
  • 15.
  • 16.
    15 Quant Data FileExample ID Drugprice Drugtype RA OA Whypharm 1 $99 Generic Yes No I like the convenience 2 $99 Generic Yes Yes Cheap, easy to get there 3 $99 Generic No Yes Convenient, friendly 4 $99 Generic No Yes Open 24 hours 5 $199 Brand Yes No Near my house 6 $97 Generic No No Free delivery Unique identifier Categoric variable (Single Response) Numeric variable Categoric variables (Multiple Response) Open-ended Variable • Columns represent questions (variables) • First row shows question (variable) names • Remaining rows represent individual “cases” (participants, respondents)
  • 17.
    16 Qualitative • Transcripts (from focusgroup discussion or interviews) • Audio and video recordings • Social media posts Data File Formats Social Media Chat: Can Pets Help People with Chronic Illness? Getting my puppy has made so many days so much better. My dogs are my heating pads, my laughter, my secret keepers, my exercise, my bed warmers, my heart and soul. They're there at night when I need to cry over the pain without judgment. My cats, horse, and pup give me a reason to get out of bed on the tough days.
  • 18.
    17  Not computerprogramming “coding”  Rather: Sifting through verbatim responses in patients’ own words, and “bucketizing” the results according to themes you detect  Used for both qualitative and quantitative research  Patient insight can be very useful here  But also could introduce bias, so be aware Qual Data Analysis: What is Coding?
  • 19.
    18 ID Whypharm ConvenientPrice 1 I like the convenience 1 2 Cheap, easy to get there 1 1 3 Convenient, friendly 1 4 Open 24 hours 1 5 Near my house 1 6 Free delivery 1 1 7 Low prices 1 8 Can walk there 1 9 Coupons 1 10 In my grocery store 1 Coding - Example
  • 20.
    19  What doyou think of this website?  The graphics are appealing  The material is interesting  I couldn’t find what I was looking for  The font size is a bit too small  I like the variety of information  The information is presented in a way that is easy to understand  I like the overall look  It’s hard to see on my smartphone Discussion - Coding What codes would you create for the following?
  • 21.
    20 Qualitative Analysis -Word Clouds Source: BJC Health Connected Care http://www.bjchealth.com.au/connected-care/2013/05/bjc-rheumatology-word-art/
  • 22.
  • 23.
    22  To analyze quantitativedata we use statistics  Research question(s) and data types dictate analysis and statistical methods Data Analysis N = Population size n = Sample size p = Statistical significance (How likely differences between groups are due to chance) p <0.05 means less than a 5% likelihood (probability) that study findings are due to chance (and therefore, a greater than 95% likelihood that the interventions are related to the results)
  • 24.
    23  Statistical significancecan be manipulated:  http://fivethirtyeight.com/features/science-isnt- broken/?ex_cid=538fb  Statistically significant differences are not always important research findings*  Clinical significance tells whether research findings are of practical use to patients and clinicians Statistical Significance – A Couple of Caveats
  • 25.
    24  Best forunderstanding “typical”, but still need to understand distribution/range  Use t-tests to compare results across groups Measures of Central Tendency The arithmetic average of a series of values Mean Median Mode The middle value in a series The value that occurs most often in a series Example: 2, 2, 2, 4, 6, 8, 9 4.7 4 2
  • 26.
    25 A way ofsummarizing data by describing how spread out the data is. The average score in a class on a math test may be 65 points. But we may also want to talk about the higher scores (above 65) and the lower scores (below 65). Measures of Spread can be calculated using different statistical methods such as Standard Deviation and variance. Measures of Spread
  • 27.
    26 Frequency Data Tables Thenumber of observations in each category is called frequency. Graphs X-Axis = Categories Y-Axis = Frequency Data: Tables & Graphs Weight in grams Frequency % 0-19 3 10% 20-39 14 15% 40-49 8 30% 50+ 12 45% 0 1 2 3 4 5 6 7 Blood Grp A Blood Grp B Blood Grp 0 Blood Grp AB Blood Groups
  • 28.
    80 260 80 0 50 100 150 200 250 300 < $100 $100-$199$200+ 27 Distribution Example & Discussion How would you describe the results of this study? Drug Price ($) Frequency Price Paid for a One-Month Prescription (n=420)
  • 29.
    80 100 0 0 00 0 0 0 60 100 40 20 20 0 20 40 60 80 100 120 <100 $100 110 120 130 140 150 160 170 180 190 200 210 220+ 28 Central Tendency Example & Discussion Mean = 153 Drug Price ($) Price Paid for a One-Month Prescription (n=420) Now, how would you describe the results of this study? Frequency
  • 30.
    29 Crosstab Example &Discussion Change in Perception of Pain After 3 Months Exercise Group (n=300) Control Group (n=300) Increased 10% 12% No change 14% 66% Decreased 76% 22% Total 100% 100% How would you describe the results of this study?
  • 31.
  • 32.
    31 Describing the datais the first step Interpretation involves relating results to the research questions, and sometimes, to previous research Ultimately, what do you recommend based on the results? •How might this affect the target population? (Patient perspective can be key here) •What other research is needed? What Does It All Mean?
  • 33.
    32 There are alot of things we didn’t cover, or just touched on • PCORI 101 Training Booklet covers a lot of good material – some overlap with this training, and some new • We plan to continue the conversation… Wrap-up
  • 34.
    33 Thank You! By Ashashyou(Own work) [CC BY-SA 4.0 (http://creativecommons.org/licenses/by-sa/4.0)], via Wikimedia Commons
  • 35.
    34  PCORI Methodology101: Training booklet for patients and stakeholders: http://www.pcori.org/sites/default/files/PCORI- Methodology-101-Training-Booklet-and-Resource-Guide.pdf  Gapminder.org: This resource has some very creative graphs and resources to use statistics: http://www.gapminder.org/  CDC: Data and statistics http://www.cdc.gov/datastatistics/  Australian Bureau of statistics: A short video on statistical language: http://www.abs.gov.au/websitedbs/a3121120.nsf/home/statistical+lan guage+-+quantitative+and+qualitative+data  Qualitative Health Research (QHR): This is a peer reviewed journal on qualitative research: http://qhr.sagepub.com/ Useful Resources
  • 36.
    35  Graphics inspiration http://www.washingtonmonthly.com/magazine/mayju ne_2011/features/the_information_sage029137.php ‘Extra Credit’