Download to read offline


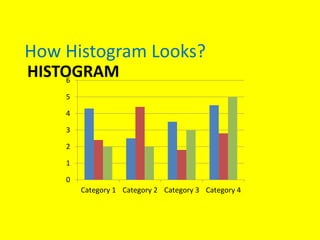
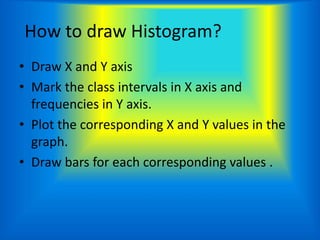
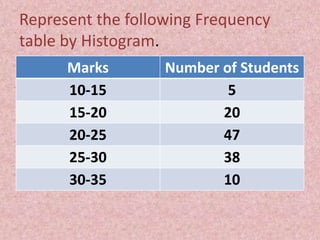


A histogram is a graphical representation of a frequency distribution using bars of equal width, without gaps between them, where the area of each bar corresponds to the frequency of observations in the corresponding interval of values. The document provides instructions on how to draw a histogram from a frequency table by plotting the class intervals on the x-axis, frequencies on the y-axis, and drawing bars to connect the corresponding values. An example histogram is drawn from the sample frequency table provided.