Download to read offline
![STATISTICS
1. Table 1 below shows the mark obtained by 100 students in a test.
Mark 0 1 2 3 4
Frequenc
y
5 16 24 30 25
TABLE 1
Find:
(a) the mean marks
(b) the median marks
(c) the mode of the marks
2. Table 2 shows the scores obtained by students in a quiz.
Score 0 1 2 3 4
Number of students 4 2 1 3 5
TABLE 2
Determine:
(a) The median
(b) The mean
3. The incomplete pictograph shows 12 000
visitors at a computer exhibition in four
days. Total number of visitors on Sat is
not shown in the diagram. .
(a) How many people came on Saturday.
(b) Complete the pictograph.
[5 marks]
Thur
s
¤ ¤ ¤
Fri
¤ ¤ ¤ ¤ ¤ ¤
Sat
Sun
¤ ¤ ¤ ¤ ¤ ¤ ¤
¤ represents 500 visitors.](https://image.slidesharecdn.com/statistics-150515035534-lva1-app6891/85/Statistics-1-320.jpg)
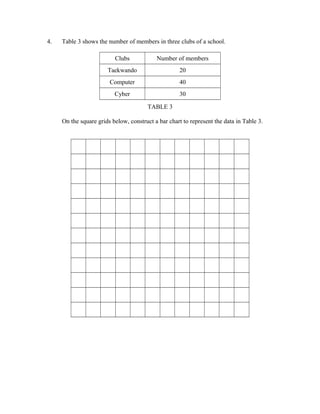

The document provides 4 statistics questions with tables of data and asks to calculate measures of central tendency, determine unknown values, complete a pictograph, and construct a bar chart. Question 1 involves calculating the mean, median, and mode of test scores in Table 1. Question 2 asks for the median and mean of quiz scores in Table 2. Question 3 requires determining the number of visitors on Saturday to complete a pictograph and represents visitor numbers on different days. Question 4 instructs to create a bar chart from the club membership numbers in Table 3.