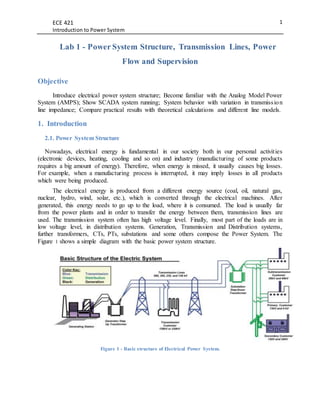
1) The document introduces an electrical power system lab that uses an Analog Model Power System (AMPS) to simulate various power system configurations and behaviors.
2) The objectives are to familiarize students with power system structure, transmission lines, power flow, and the supervisory control and data acquisition (SCADA) system. Tests will be conducted by varying transmission line impedances and load types and comparing results to theoretical calculations.
3) Detailed procedures are provided for setting up resistive and inductive loads on the AMPS and conducting tests while varying transmission line impedances from 100% to 70% to 30% and recording voltage, current, and power flow measurements.
![ECE 421
Introduction to Power System
3
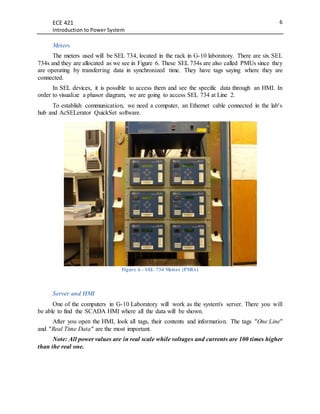
Figure 3 - HMI of a SCADA applied in Industry.
2. Analog Model Power System (AMPS)
The AMPS is located in the room G-10 of the Buchanan Engineering Building. This analog
power system contains six buses which can be connected in different ways in order to get various
networks depending on desired application.
The lab represents a real power system in small scale. You can find there a system with: six
buses, four transmission lines, an infinite bus (Avista), a synchronous machine, loads, breakers,
relays, logic processors, CTs, PTs, meters, communication cables, Ethernet switch, routers, server,
SCADA and some other things.
Further AMPS specifications can be found in the Chapter 1 of the "Draft User’s Manual for
Analog Model Power Systems (AMPS)" [2].
3. Equipment and Lab. Methods - before starting up
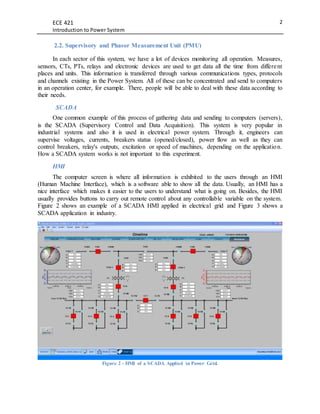
Loads
Two different kinds of loads will be used in these tests and both are going to be Y connection.
Resistive Load: Light bulbs of 100W per phase + Resistor bank with all resistors in series
(around 77.3 Ω each phase);
Inductive Load: Resistive load + Inductor bank with all reactances in series (around
6.3234+j69.7948 Ω each phase, pf = 0.09);](https://image.slidesharecdn.com/ece421labv4updated-171211031821/85/Power-System-Structure-3-320.jpg)
![ECE 421
Introduction to Power System
7
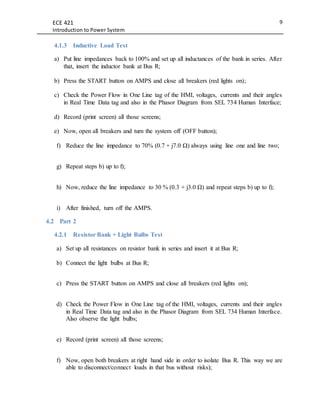
System Network
a) The experiment will be done with an infinite bus feeding a load by two parallel
transmission lines as seen in Figure 7;
Figure 7 - System Network used in this Lab.
Note: 52 → AC Circuit Breaker by ANSI/IEEE Standard Device Numbers.
b) To certify that the system is correctly connected, check/make the following connections
using jumpers cables:
[J1-J2], [J5-J26], [J27-J29], [J30-J31], [J32-J33], [J34-J36], [J38-J22], [J20-J18], [J15-J17],
[J13-J14], [J11-J12], [J8-J10];
DO NOT connect [J23-24].
Figure 8 - Breaker and Jumper Cables on AMPS.](https://image.slidesharecdn.com/ece421labv4updated-171211031821/85/Power-System-Structure-7-320.jpg)
![ECE 421
Introduction to Power System
8
c) The line impedances should be always equal to each other. Initially, let's use 100%
percent of Lines 1 and 2, and completely by-pass Lines 3 and 4. It is done to reduce
errors, as explained in [2];
d) Certify that both source impedances are in tap 10 (100%).
Start Up
The energization must be done by the lab instructor or with his agreement.
"To start up the AMPS, first remove the padlock and turn on the main breaker located on the
south wall. Flip on the “Fault Matrix” and “DC Power Supply” switch located on panel number
2F on the left side of AMPS." 11[2]. Do not energize the system yet.
4. Lab. Methods - after start up
4.1 Part 1
4.1.2 Resistive Load Test
a) Set up all resistances on resistor bank in series and insert it at Bus R, as well as the light
bulbs;
Note: Now, the initial condition test is 100% of top and bottom lines with resistive load.
Note: The load bulbs can draw more power than their nominal power since their resistive load is
not accurate.
b) Press the START button on AMPS and close all breakers (red lights on);
c) Check the Power Flow in One Line tag of the HMI, voltages, currents and their angles
in Real Time Data tag and also in the Phasor Diagram from SEL 734 Human Interface;
d) Record (print screen) all those screens;
e) Now, open all breakers and turn the system off (OFF bottom);
f) Reduce the line impedance to 70% (0.7 + j7.0 Ω) always using line one and line two;
g) Repeat steps b) up to f);
h) Now, reduce the line impedance to 30 % (0.3 + j3.0 Ω) and repeat steps b) up to f);
i) After that, turn off the system and go to heavy load test.](https://image.slidesharecdn.com/ece421labv4updated-171211031821/85/Power-System-Structure-8-320.jpg)
![ECE 421
Introduction to Power System
10
g) Reduce the bank's resistance pulling next switch to left side and putting the switch
above on middle position;
h) Repeat steps b) up to f) up to rest only 𝑅1;
i) After that, open all breakers and turn off the system and go to the next test.
4.2.2 Inductor Bank + Light Bulbs Test
a) Disconnect the resistor bank from the system. Set up all inductances of the bank in series
and connect them at Bus R;
b) Press the START button on AMPS and close all breakers (red lights on);
c) Check the Power Flow in One Line tag of the HMI, voltages, currents and their angles
in Real Time Data tag and also in the Phasor Diagram from SEL 734 Human Interface.
Also observe the light bulbs;
d) Record (print screen) all those screens;
e) Now, open both breakers at right hand side in order to isolate Bus R. This way we are
able to disconnect/connect loads in that bus without risks);
f) Reduce the bank's inductance pulling next switch to left side and putting the switch
above on middle position;
g) Repeat steps b) up to f) up to rest only 𝑋 𝐿1;
h) After that, open all breakers and turn off the system and go to the next test.
5. Post Lab
In order to get a theoretical comparative to this lab, calculate in MathCAD everything what
will be done. Create a variable transmission line impedance vector (10% step) and calculate to
Avista bus, Bus S and Bus R (load bus): voltages and currents, real and reactive power, losses and
power factor.
Do it to different transmission lines models: series impedance and Pi-Circuit. More about
transmission lines models can be found in [3].
Plot all calculations to get a easier visualization.](https://image.slidesharecdn.com/ece421labv4updated-171211031821/85/Power-System-Structure-10-320.jpg)
![ECE 421
Introduction to Power System
11
Tip: To each step of line impedance we have 0.1+j1 ohm. The line capacitive effect is
created by real capacitors of 0.47𝜇𝐹 (to phase-ground and phase-phase is the same value). When
calculating the equivalent transmission line you should use 𝑌𝑒𝑞𝑢𝑖𝑣𝑎𝑙𝑒𝑛𝑡 = 16. 𝑌𝐶.
6. Report
a) In G10 Lab we have, in smaller scale, all structures present in a real Power System.
Describe the Power System lab with a real one. Write all you have learned about how
the lab work (AMPS, Communications, server and so on);
b) Transfer all data to a MathCAD spreadsheet or similar, where you will be able to deal
with those information. Calculate measures which were not present on HMI and you
feel they are important;
c) Compare your MathCAD calculations and plots with the results gotten in lab. Compare
also results from pi model and series impedance models of transmission Lines. Use
graphs to get a better visualization. Plot together real power at Avista bus measured
from: HMI and also from your calculations. Then, compare if they are similar. Do the
same to reactive power, voltage and current;
d) For resistive load, show the results and write about the questions bellow:
What are the effects of line impedance variation in real and reactive power flow,
voltages and currents (take care about unbalances) and power factors (calculate them,
specially the system power factor);
Calculate real and reactive power losses in the line. What do you conclude with the
results?
e) Repeat item 6.b) for the heavy loads;
f) Reflect about obtained results to only resistive load and resistive and inductive loads.
Write your conclusions.
7. References
[1] D. P. Kothari, I. J. Nagrath; Modern Power System Analysis, Mc Graw Hill, 2008;
[2] Draft Users Manual for Analog Model Power Systems (AMPS);
[3] J. Ducan Glover, M. S. Sarma, T. J. Overbye; Power System Analysis and Design -
Fifth Edition.
[4] SEL University IA 309, Synchrophasor Measurement & Application;](https://image.slidesharecdn.com/ece421labv4updated-171211031821/85/Power-System-Structure-11-320.jpg)
![ECE 421
Introduction to Power System
12
[5] J. V. Espinoza, A. Guzmán, F. Calero, M. V. Mynam, E. Palma, SEL; Wide- Area
Measurement and Control Scheme Maintains Central America's Power System
Stability.](https://image.slidesharecdn.com/ece421labv4updated-171211031821/85/Power-System-Structure-12-320.jpg)