Download as PDF, PPTX


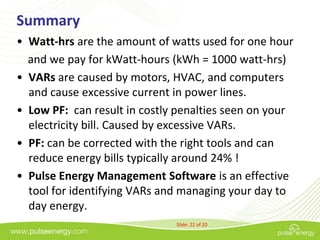


The document discusses the concept of power factor in electricity, explaining its significance, causes, and how it impacts energy costs for buildings. It highlights the role of reactive power (vars) and the penalties associated with low power factor, along with a case study showcasing a power factor correction application resulting in substantial savings. Techniques for identifying and correcting power factor issues are also outlined, emphasizing the use of software for monitoring and management.


![Kvar Presentation Ppt 8.8.08[1]](https://cdn.slidesharecdn.com/ss_thumbnails/kvarpresentationppt8-8-081-090713082239-phpapp01-thumbnail.jpg?width=640&height=640&fit=bounds)


