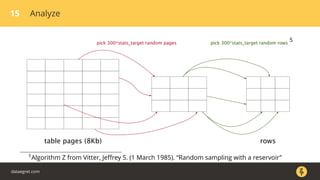
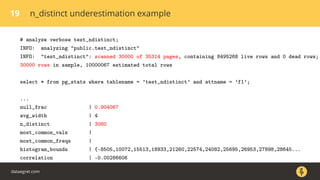
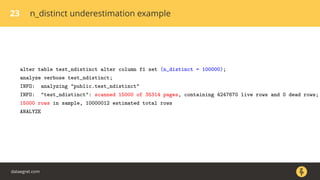
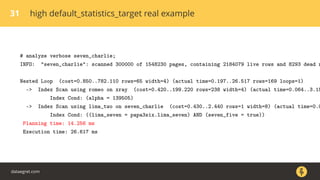
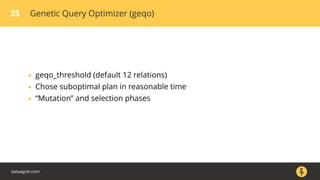
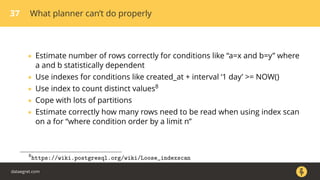
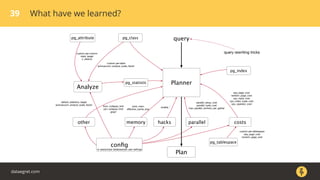
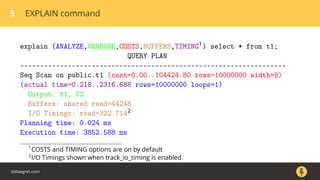
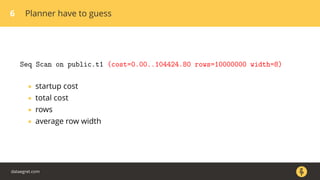
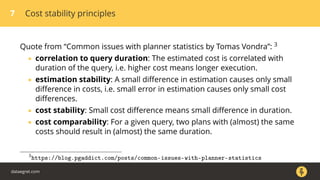
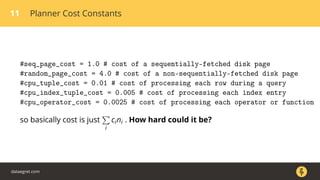
The document discusses how the PostgreSQL query planner works. It explains that a query goes through several stages including parsing, rewriting, planning/optimizing, and execution. The optimizer or planner has to estimate things like the number of rows and cost to determine the most efficient query plan. Statistics collected by ANALYZE are used for these estimates but can sometimes be inaccurate, especially for n_distinct values. Increasing the default_statistics_target or overriding statistics on columns can help address underestimation issues. The document also discusses different plan types like joins, scans, and aggregates that the planner may choose between.


![4 The Path of a Query
Connection
↓
Parser
↓
Rewrite system
↓
Planner/Optimizer
↓
Executor ↔ [Workers]
↓
Send results
all in single process (backend) beside background workers (parallel seq scan,
9.6+)
dataegret.com](https://image.slidesharecdn.com/alexeyermakov-postgresqlqueryplannersinternals-170706055821/85/PostgreSQL-query-planner-s-internals-4-320.jpg)
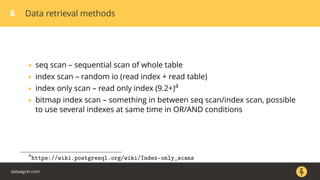
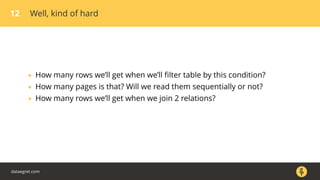
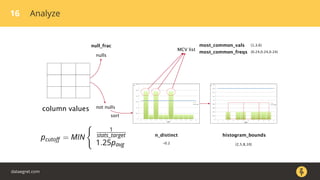
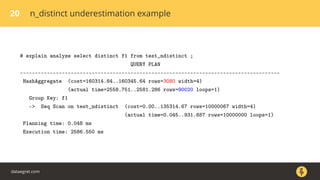
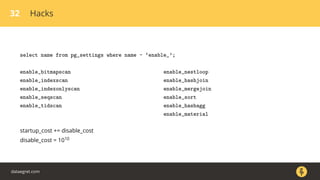
![14 pg_stats
pgday=# d pg_stats
Column | Type |
------------------------+----------+----------------------------------------------------------------
tablename | name | name of the table or functional index
attname | name | name of the column or index column
null_frac | real | fraction of column entries that are null
avg_width | integer | average width in bytes of column’s entries
n_distinct | real | number (or fraction of number of rows) of distinct values
most_common_vals | anyarray | list of the most common values in the column
most_common_freqs | real[] | list of the frequencies of the most common values
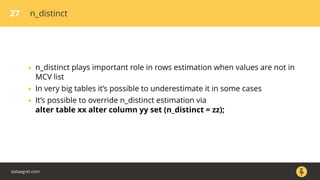
histogram_bounds | anyarray | list of intervals with approximately equal population
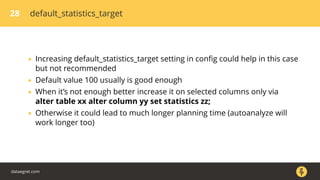
correlation | real | correlation between physical row ordering and logical ordering
most_common_elems | anyarray |
most_common_elem_freqs | real[] |
elem_count_histogram | real[] |
dataegret.com](https://image.slidesharecdn.com/alexeyermakov-postgresqlqueryplannersinternals-170706055821/85/PostgreSQL-query-planner-s-internals-14-320.jpg)