Download as PDF, PPTX

![ClickHouse for Logs Management at Uber
[1] https://eng.uber.com/logging/](https://image.slidesharecdn.com/signoz-observabilitywithclickhouse-210828165254/85/Building-an-Observability-platform-with-ClickHouse-9-320.jpg)
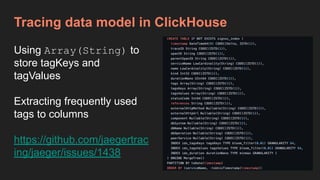
![Comparison with Elastic
● A single ClickHouse node could
ingest 300K logs per second, 10x
a single ES node
● >80% queries are aggregation
queries, such as terms, histogram
and percentile aggregations.
Elastic is not designed to support
fast aggregation
[1] https://eng.uber.com/logging/](https://image.slidesharecdn.com/signoz-observabilitywithclickhouse-210828165254/85/Building-an-Observability-platform-with-ClickHouse-10-320.jpg)
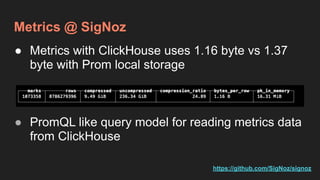
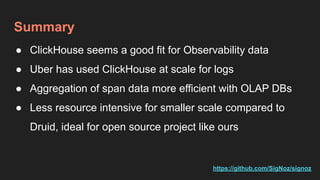

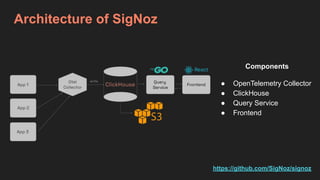
The document discusses using ClickHouse as the backend storage for observability data in SigNoz, an open source observability platform. ClickHouse is well-suited for storing observability data due to its ability to handle wide tables, perform fast aggregation queries, and provide compression capabilities. The document outlines SigNoz's architecture, demonstrates how tracing and metrics data is modeled in ClickHouse, and shows how ClickHouse outperforms Elasticsearch for ingesting and querying logs and metrics at scale. Overall, ClickHouse is presented as an efficient and less resource-intensive solution than alternatives like Druid for storing observability data, especially for open source projects.