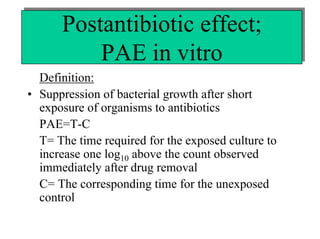
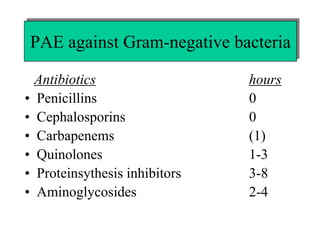
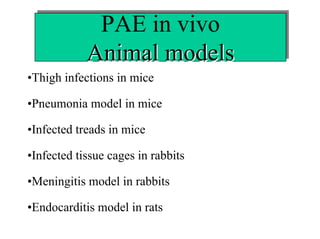
The postantibiotic and sub-MIC
effects in vitro and in vivo
Inga Odenholt, MD., Ph.D.
Department of Infectious Diseases
University hospital
Malmö
Sweden
The postantibiotic effect in vitro
Postantibiotic effect;
PAE in vitro
PAE in vitro
Definition:
• Suppression of bacterial growth after short
exposure of organisms to antibiotics
PAE=T-C
T= The time required for the exposed culture to
increase one log10 above the count observed
immediately after drug removal
C= The corresponding time for the unexposed
control
Postantibiotic effect
9

8

7

log10 cfu/mL

2.3 h

Control

6

PAE
5

4

3
0

2

4

6

8

10

12

h

Odenholt et al. SJID, 1988
Postantibiotic effect
in vitro
in vitro
The PAE is dependent on:
• Type of antibiotic
• Type of bacterial species
• Concentration of the antibiotic
• Duration of exposure
• Size of the inoculum
• Growth phase of the organism
PAE against Gram-positive bacteria
Antibiotics
• Penicillins
• Cephalosporins
• Carbapenems
• Quinolones
• Proteinsythesis inhibitors

hours
1-2
1-2
1-2
1-3
3-5
PAE against Gram-negative bacteria
•
•
•
•
•
•

Antibiotics
Penicillins
Cephalosporins
Carbapenems
Quinolones
Proteinsythesis inhibitors
Aminoglycosides

hours
0
0
(1)
1-3
3-8
2-4
PAE against P. aeruginosa

•
•
•
•
•

Antibiotics
Penicillins
Cephalosporins
Carbapenems
Quinolones
Aminoglycosides

hours
0
0
1-2
1-2
2-3
The PAE at different concentrations against E. coli
8
7
6

hours

5
Rifampicin

4

Tetracykline
Cefamandole

3
2
1
0
0,5

1

2

4
xMIC

8

16

32

Craig & Gudmundsson, 1991
PAE at different exposure times against S. aureus
6

5

PAE (h)

4
Penicillin
Erythromycin

3

2

1

0
0

2

4

6

8

10

12hours
Effect on inoculum size on the PAE
120

100

Min

80
10 9 cfu/mL
10 7 cfu/mL

60

10 5 cfu/mL
10 3 cfu/mL

40

20

0
1
Ciprofloxacin

2
Tobramycin
PAE in vitro
PAE in vitro
Methods
Methods
1.

Viable counts

Methodological pitfalls
• may overestimate killing
• negative PAEs are common with ß-lactams
and gram-negatives due to forming of filaments
• similar inocula of the control and the preexposed culture are desirable
Postantibiotic effect
9

8

7

log10 cfu/mL

2.3 h

Control

6

PAE
5

4

3
0

2

4

6

8

10

12

h

Odenholt et al. SJID, 1988
PAE in vitro
PAE in vitro
Methods
Methods
2.

Optical density

Methodological pitfalls
• killing cannot be measured due to a detection limit
of 106 cfu/ml
• control curves at different inocula and viable
counts after drug removal are necessary to be
performed to ensure that PAE culture and control
are at the same inoculum
PAE in vitro
PAE in vitro
Methods
Methods
3.

ATP measurement

Methodological pitfalls

• bactericidal activity is underestimated due to dead
but intact (not lysed) bacteria still containing
intracellular ATP
• PAE is overestimated due to falsely elevated ATP
content
PAE measured with ATP
-7

log10 M bacterial ATP

-8

-9

Control
PAE

Dilution
-10

-11
0

1

2

3

4

5

6

7

8

9

h
PAE in vitro
PAE in vitro
Methods
Methods
Morphology

4.

• Phase contrast microscopy
– the time it takes for the bacteria to revert to 90%
bacilli

• Ultrastructural changes
-

the changes in structure correlates well with
the PAE measured with viable counting

5. 3H-thymidine incorporation

-correlates well with the PAE measured with
viable counting
Control related effective
regrowth time (CERT)
CERT
CERT
• Definition
CERT=T-C
T=the time required for resumption of
logarithmic growth and increase of one
log10 to occur over the preexposed inoculum
of the test tube
Calculation of CERT with bioluminescence
3

1.3 h
2

ATP log10 M

6h

1
PAE=4,7 h

Control
PAE

0

-1

-2

h

-2

-1

0

1

2

3

4

5

6

7
Calculation of CERT using viable counts
3
1.6 h
2

log10 cfu/mL

1

0
PAE=-0.3 h
Control
PAE

-1
1.3 h

-2

-3

-4
-2

-1

0

1

2

3

4

5

6

7

h
The postantibiotic effect in vivo
Postantibiotic effect in vivo
Definition
PAE= T-C-M
• T= the time required for the counts of cfu in thighs
of treated mice to increase one log10 above the
count closest to but not less than the time M
• C= the time required for the counts of cfu in thighs
of untreated mice to increase one log10 above the
count at time zero
• M= the time serum concentration exceeds the MIC
The postantibiotic effect of gentamicin against K. pneumoniae in vivo
10
9
8

log10 cfu/mL

7
6
5
4

Control
PAE

3
T>MIC
2
1
0
-2

0

2

4

6

8

10

12

Fantin et al. JAC, 1990

14

h
PAE in vivo
PAE in vivo
• Observed in several animal models
• In vitro data are predictive of in vivo results
except that in vivo PAE are usually longer due to
the effect of sub-MICs and/or the effect of
neutrophils
• The major unexplained discordant results are for
ß-lactams and streptococci
PAE in vivo
PAE in vivo
Animal models
Animal models
•Thigh infections in mice
•Pneumonia model in mice
•Infected treads in mice
•Infected tissue cages in rabbits
•Meningitis model in rabbits
•Endocarditis model in rats
Mechanisms of PAE
Mechanisms of PAE
• β-lactam antibiotics.
At least for S. pyogenes and penicillin
it has been shown that PAE stands for
the time it takes for the bacteria to
resynthesize new PBPs
Mechanisms of PAE
Mechanisms of PAE
• Erythromycin and
clarithromycin:
50S ribosomal subunits were reduced
during 90 min and protein synthesis
during 4 h (PAE) due to prolonged
binding of the antibiotics to 50S.
Mechanisms of PAE
Mechanisms of PAE
• Aminoglycosides:
Binding of sublethal amounts of drug enough to
disrupt DNA, RNA and protein synthesis. The
time it takes to resynthesize these proteins.
With a half-life of >2.5 h, the PAE disappears,
reflecting a sufficient time for the repair
mechanism to be restored.
The postantibiotic sub-MIC
effect in vitro
effect in vitro
Postantibiotic sub-MIC
effect; PA SME
effect; PA SME
Definition
• The effect of subinhibitory antibiotic
concentrations on bacteria previously exposed to
suprainhibitory concentrations
PA SME= TPA-C
• TPA=the time it takes for the cultures previously
exposed to antibiotics and thereafter to sub-MICs
to increase by one log10 above the counts observed
immediately after washing.
• C=corresponding time for the unexposed control
PA SME of telithromycin against H. influenzae
10

9

8

log10 cfu/mL

7

6

5

PAE
0.1xMIC

4

0.2xMIC
0.3xMIC
Control

3

2

1
0

3

6

9

12

15

18

21

24

h
The postantibiotic sub-MIC
effect in vivo
effect in vivo
PAE PASME) in vivo of amikacin against K.
PAE (( PASME) in vivo of amikacin against K.
pneumoniae in a thigh-infection model in
mice
mice
• Normal mice (half-life 19 min)

PAE
5.5 h

• Uremic mice (half-life 98 min)

14.6 h
The PAE and PA SME of piperacillin against S. aureus in vivo
9,00
8,50
8,00

log10 cfu/mL

7,50
7,00
Control
PAE
PA SME

6,50
6,00
5,50
Penicillinase

5,00
4,50

T>MIC

4,00

h

-2

0

2

4

6

8

10
Oshida et al. JAC, 1990
Post-MIC effect (PME)
Post-MIC effect; PME
Definition
• The effect of sub-MICs on bacteria previously
exposed to a constant decreasing antibiotic
concentration
PME=Tpme-C
• Tpme= The time for the counts in cfu of the
exposed culture to increase one log10 above the
count observed at the MIC level
• C= the time for an unexposed control to increase
one log10
The post-MIC effect of benzylpenicillin against S. pneumoniae (PcR)
10

9

8

log10 cfu/mL

7

MIC
10mg/l
100 mg/l
Control

6

5

4

PME at 10 mg/l 12.9-2.3= 10.6

3

PME at 100 mg/l 7.5-2.3= 5.2

2

1

0

2

4 MIC

6

8

10

12

14

16

18

20

22

24 h
Mechanism of PA SME?
• The PAE of ß-lactam antibiotics seems to
represent the time necessary to synthesize
new PBPs. When bacteria in the PA-phase
are exposed to sub-MICs, most PBPs are
still inactivated and only a small amount of
the drug is needed to prolong the inhibition
of cell multiplication until a critical number
of free PBPs are once more available
Postantibiotic leucocyte
enhancement
enhancement
Postantibiotic leucocyte
enhancement; PALE
enhancement; PALE
• Bacteria pretreated with antibiotics for a
brief period of time show increased
susceptibility to intracellular killing and
phagocytosis
• In general, antibiotics that produce the
longest PAEs exhibit maximal PALEs
Sub-MIC effects
Sub-MIC effects
The SME of P&G kinolon against S. pneumoniae
9

8

log10 cfu/mL

7

6
Control
0.1xMIC
0.2xMIC
0.3xMIC

5

4

3

2

h

0

3

6

9

12

15

18

21

24
Sub-MIC effects; SME
Definition
• The effect of subinhibitory antibiotic
concentrations on bacteria not previously
exposed to suprainhibitory concentrations
SME= Ts-C
•Ts=the time it takes for the cultures exposed to
sub-MICs to increase by one log10 above the counts
observed immediately after washing
•C=corresponding time for the unexposed control
Sub-MIC effects
Sub-MIC effects
• The minimum antibiotic concentrations that
produces a structural change in bacteria seen
by light or electron microscopy
• The minimum antibiotic concentration that
produces a one log10 decrease in the bacterial
population compared to the control
• Loss or change of bacterial toxins
Sub-MIC effects
Sub-MIC effects
• Loss of surface antigens resulting in
decreased adhesion
• Increased rates of phagocytic ingestion
and killing
• Increased chemotaxsis and opsonization
Mechanism of sub-MIC
effects
effects
• SME probably tests the distribution of
antibiotic susceptibility in the bacterial
population, in which there are
subpopulations that are inhibited by
concentrations less than the MIC. The
SME would therefore represent the time
it takes for the population with the
higher MIC to become dominant
Implications
Implications
• The combined effects of supra- and subinhibitory
concentrations seem to be more important for
dosing regimens then PAE itself.
• A long PA SME/PME indicate that longer dosing
intervals may be used even for antibiotics, which
are dependent on the T>MIC for efficacy

Post antibiotic-sub-mic-effects

  • 1.
    The postantibiotic andsub-MIC The postantibiotic and sub-MIC effects in vitro and in vivo effects in vitro and in vivo Inga Odenholt, MD., Ph.D. Department of Infectious Diseases University hospital Malmö Sweden
  • 2.
    The postantibiotic effectin vitro The postantibiotic effect in vitro
  • 3.
    Postantibiotic effect; Postantibiotic effect; PAEin vitro PAE in vitro Definition: • Suppression of bacterial growth after short exposure of organisms to antibiotics PAE=T-C T= The time required for the exposed culture to increase one log10 above the count observed immediately after drug removal C= The corresponding time for the unexposed control
  • 4.
    Postantibiotic effect 9 8 7 log10 cfu/mL 2.3h Control 6 PAE 5 4 3 0 2 4 6 8 10 12 h Odenholt et al. SJID, 1988
  • 5.
    Postantibiotic effect Postantibiotic effect invitro in vitro The PAE is dependent on: • Type of antibiotic • Type of bacterial species • Concentration of the antibiotic • Duration of exposure • Size of the inoculum • Growth phase of the organism
  • 6.
    PAE against Gram-positivebacteria Antibiotics • Penicillins • Cephalosporins • Carbapenems • Quinolones • Proteinsythesis inhibitors hours 1-2 1-2 1-2 1-3 3-5
  • 7.
    PAE against Gram-negativebacteria PAE against Gram-negative bacteria • • • • • • Antibiotics Penicillins Cephalosporins Carbapenems Quinolones Proteinsythesis inhibitors Aminoglycosides hours 0 0 (1) 1-3 3-8 2-4
  • 8.
    PAE against P.aeruginosa PAE against P. aeruginosa • • • • • Antibiotics Penicillins Cephalosporins Carbapenems Quinolones Aminoglycosides hours 0 0 1-2 1-2 2-3
  • 9.
    The PAE atdifferent concentrations against E. coli 8 7 6 hours 5 Rifampicin 4 Tetracykline Cefamandole 3 2 1 0 0,5 1 2 4 xMIC 8 16 32 Craig & Gudmundsson, 1991
  • 10.
    PAE at differentexposure times against S. aureus 6 5 PAE (h) 4 Penicillin Erythromycin 3 2 1 0 0 2 4 6 8 10 12hours
  • 11.
    Effect on inoculumsize on the PAE 120 100 Min 80 10 9 cfu/mL 10 7 cfu/mL 60 10 5 cfu/mL 10 3 cfu/mL 40 20 0 1 Ciprofloxacin 2 Tobramycin
  • 12.
    PAE in vitro PAEin vitro Methods Methods 1. Viable counts Methodological pitfalls • may overestimate killing • negative PAEs are common with ß-lactams and gram-negatives due to forming of filaments • similar inocula of the control and the preexposed culture are desirable
  • 13.
    Postantibiotic effect 9 8 7 log10 cfu/mL 2.3h Control 6 PAE 5 4 3 0 2 4 6 8 10 12 h Odenholt et al. SJID, 1988
  • 14.
    PAE in vitro PAEin vitro Methods Methods 2. Optical density Methodological pitfalls • killing cannot be measured due to a detection limit of 106 cfu/ml • control curves at different inocula and viable counts after drug removal are necessary to be performed to ensure that PAE culture and control are at the same inoculum
  • 15.
    PAE in vitro PAEin vitro Methods Methods 3. ATP measurement Methodological pitfalls • bactericidal activity is underestimated due to dead but intact (not lysed) bacteria still containing intracellular ATP • PAE is overestimated due to falsely elevated ATP content
  • 16.
    PAE measured withATP -7 log10 M bacterial ATP -8 -9 Control PAE Dilution -10 -11 0 1 2 3 4 5 6 7 8 9 h
  • 17.
    PAE in vitro PAEin vitro Methods Methods Morphology 4. • Phase contrast microscopy – the time it takes for the bacteria to revert to 90% bacilli • Ultrastructural changes - the changes in structure correlates well with the PAE measured with viable counting 5. 3H-thymidine incorporation -correlates well with the PAE measured with viable counting
  • 18.
    Control related effective Controlrelated effective regrowth time (CERT) regrowth time (CERT)
  • 19.
    CERT CERT • Definition CERT=T-C T=the timerequired for resumption of logarithmic growth and increase of one log10 to occur over the preexposed inoculum of the test tube
  • 20.
    Calculation of CERTwith bioluminescence 3 1.3 h 2 ATP log10 M 6h 1 PAE=4,7 h Control PAE 0 -1 -2 h -2 -1 0 1 2 3 4 5 6 7
  • 21.
    Calculation of CERTusing viable counts 3 1.6 h 2 log10 cfu/mL 1 0 PAE=-0.3 h Control PAE -1 1.3 h -2 -3 -4 -2 -1 0 1 2 3 4 5 6 7 h
  • 22.
    The postantibiotic effectin vivo The postantibiotic effect in vivo
  • 23.
    Postantibiotic effect invivo Postantibiotic effect in vivo Definition PAE= T-C-M • T= the time required for the counts of cfu in thighs of treated mice to increase one log10 above the count closest to but not less than the time M • C= the time required for the counts of cfu in thighs of untreated mice to increase one log10 above the count at time zero • M= the time serum concentration exceeds the MIC
  • 24.
    The postantibiotic effectof gentamicin against K. pneumoniae in vivo 10 9 8 log10 cfu/mL 7 6 5 4 Control PAE 3 T>MIC 2 1 0 -2 0 2 4 6 8 10 12 Fantin et al. JAC, 1990 14 h
  • 25.
    PAE in vivo PAEin vivo • Observed in several animal models • In vitro data are predictive of in vivo results except that in vivo PAE are usually longer due to the effect of sub-MICs and/or the effect of neutrophils • The major unexplained discordant results are for ß-lactams and streptococci
  • 26.
    PAE in vivo PAEin vivo Animal models Animal models •Thigh infections in mice •Pneumonia model in mice •Infected treads in mice •Infected tissue cages in rabbits •Meningitis model in rabbits •Endocarditis model in rats
  • 27.
    Mechanisms of PAE Mechanismsof PAE • β-lactam antibiotics. At least for S. pyogenes and penicillin it has been shown that PAE stands for the time it takes for the bacteria to resynthesize new PBPs
  • 28.
    Mechanisms of PAE Mechanismsof PAE • Erythromycin and clarithromycin: 50S ribosomal subunits were reduced during 90 min and protein synthesis during 4 h (PAE) due to prolonged binding of the antibiotics to 50S.
  • 29.
    Mechanisms of PAE Mechanismsof PAE • Aminoglycosides: Binding of sublethal amounts of drug enough to disrupt DNA, RNA and protein synthesis. The time it takes to resynthesize these proteins. With a half-life of >2.5 h, the PAE disappears, reflecting a sufficient time for the repair mechanism to be restored.
  • 30.
    The postantibiotic sub-MIC Thepostantibiotic sub-MIC effect in vitro effect in vitro
  • 31.
    Postantibiotic sub-MIC Postantibiotic sub-MIC effect;PA SME effect; PA SME Definition • The effect of subinhibitory antibiotic concentrations on bacteria previously exposed to suprainhibitory concentrations PA SME= TPA-C • TPA=the time it takes for the cultures previously exposed to antibiotics and thereafter to sub-MICs to increase by one log10 above the counts observed immediately after washing. • C=corresponding time for the unexposed control
  • 32.
    PA SME oftelithromycin against H. influenzae 10 9 8 log10 cfu/mL 7 6 5 PAE 0.1xMIC 4 0.2xMIC 0.3xMIC Control 3 2 1 0 3 6 9 12 15 18 21 24 h
  • 33.
    The postantibiotic sub-MIC Thepostantibiotic sub-MIC effect in vivo effect in vivo
  • 34.
    PAE PASME) invivo of amikacin against K. PAE (( PASME) in vivo of amikacin against K. pneumoniae in a thigh-infection model in pneumoniae in a thigh-infection model in mice mice • Normal mice (half-life 19 min) PAE 5.5 h • Uremic mice (half-life 98 min) 14.6 h
  • 35.
    The PAE andPA SME of piperacillin against S. aureus in vivo 9,00 8,50 8,00 log10 cfu/mL 7,50 7,00 Control PAE PA SME 6,50 6,00 5,50 Penicillinase 5,00 4,50 T>MIC 4,00 h -2 0 2 4 6 8 10 Oshida et al. JAC, 1990
  • 36.
  • 37.
    Post-MIC effect; PME Post-MICeffect; PME Definition • The effect of sub-MICs on bacteria previously exposed to a constant decreasing antibiotic concentration PME=Tpme-C • Tpme= The time for the counts in cfu of the exposed culture to increase one log10 above the count observed at the MIC level • C= the time for an unexposed control to increase one log10
  • 38.
    The post-MIC effectof benzylpenicillin against S. pneumoniae (PcR) 10 9 8 log10 cfu/mL 7 MIC 10mg/l 100 mg/l Control 6 5 4 PME at 10 mg/l 12.9-2.3= 10.6 3 PME at 100 mg/l 7.5-2.3= 5.2 2 1 0 2 4 MIC 6 8 10 12 14 16 18 20 22 24 h
  • 39.
    Mechanism of PASME? Mechanism of PA SME? • The PAE of ß-lactam antibiotics seems to represent the time necessary to synthesize new PBPs. When bacteria in the PA-phase are exposed to sub-MICs, most PBPs are still inactivated and only a small amount of the drug is needed to prolong the inhibition of cell multiplication until a critical number of free PBPs are once more available
  • 40.
  • 41.
    Postantibiotic leucocyte Postantibiotic leucocyte enhancement;PALE enhancement; PALE • Bacteria pretreated with antibiotics for a brief period of time show increased susceptibility to intracellular killing and phagocytosis • In general, antibiotics that produce the longest PAEs exhibit maximal PALEs
  • 42.
  • 43.
    The SME ofP&G kinolon against S. pneumoniae 9 8 log10 cfu/mL 7 6 Control 0.1xMIC 0.2xMIC 0.3xMIC 5 4 3 2 h 0 3 6 9 12 15 18 21 24
  • 44.
    Sub-MIC effects; SME Sub-MICeffects; SME Definition • The effect of subinhibitory antibiotic concentrations on bacteria not previously exposed to suprainhibitory concentrations SME= Ts-C •Ts=the time it takes for the cultures exposed to sub-MICs to increase by one log10 above the counts observed immediately after washing •C=corresponding time for the unexposed control
  • 45.
    Sub-MIC effects Sub-MIC effects •The minimum antibiotic concentrations that produces a structural change in bacteria seen by light or electron microscopy • The minimum antibiotic concentration that produces a one log10 decrease in the bacterial population compared to the control • Loss or change of bacterial toxins
  • 46.
    Sub-MIC effects Sub-MIC effects •Loss of surface antigens resulting in decreased adhesion • Increased rates of phagocytic ingestion and killing • Increased chemotaxsis and opsonization
  • 47.
    Mechanism of sub-MIC Mechanismof sub-MIC effects effects • SME probably tests the distribution of antibiotic susceptibility in the bacterial population, in which there are subpopulations that are inhibited by concentrations less than the MIC. The SME would therefore represent the time it takes for the population with the higher MIC to become dominant
  • 48.
    Implications Implications • The combinedeffects of supra- and subinhibitory concentrations seem to be more important for dosing regimens then PAE itself. • A long PA SME/PME indicate that longer dosing intervals may be used even for antibiotics, which are dependent on the T>MIC for efficacy