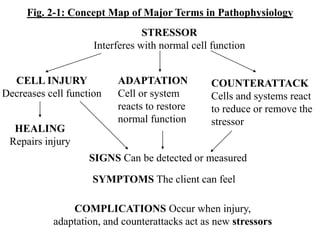
1. Fig. 2-1: Concept Map of Major Terms in Pathophysiology
CELL INJURY
Decreases cell function
ADAPTATION
Cell or system
reacts to restore
normal function
STRESSOR
Interferes with normal cell function
HEALING
Repairs injury
COUNTERATTACK
Cells and systems react
to reduce or remove the
stressor
SIGNS Can be detected or measured
SYMPTOMS The client can feel
COMPLICATIONS Occur when injury,
adaptation, and counterattacks act as new stressors
2. Fig. 2-2: Flow Chart of Lead Toxicity
Prevent
hemolysis
Competes with
enzymes that
Ingested and inhaled lead
More RBCs
destroyed
Anemia
Filtered in
kidneys
Kidney
damage
Less RBC
production
Synthesize
hemoglobin
Hypertension
Enters brain
Demyelination
Cortical cell death
Acute
encephalopathy
Decreased
intelligence
3. Fig. 2-3: Flow Chart of Free Radical Formation
Damage
proteins
FREE RADICALS
Molecules with an extra electron
Smoke,
pollutants,
radiation
Damage
membrane
lipids
Inflammation
Disrupts
enzyme
function
Cell metabolism
Energy generation,
protein and lipid breakdown
Damage DNA
Cell death
Cell transformation,
malignancies
Mutations
Membranes of
organelles
break or leak
4. Fig. 2-4: Flow Chart of Hypoxic Cell Damage
Lactic acid
production
Damage to cell
membranes and
intracellular struct
Increased anaerobic
metabolism
Uses up cell’s glycogen stores
Decreased Na+/K+
ATPase activity
Hypoxia
Decreased pH
Decreased aerobic metabolism
Less ATP generated
Intracellular ion levels rise
and water enters cell Cell swells
Chromatin clumps
Essential enzymes
leak out of cell
Cell membranes become
hyperpermeable
Lysosomal enzymes
leak into cytoplasm,
digesting it