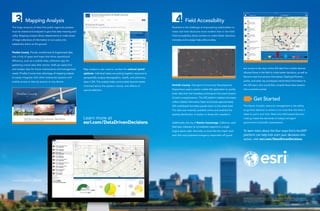
T he value of geographic information system (GIS)
technology for managers and executives in the
civic sphere has been clear for decades. In a very
broad sense, GIS gives stakeholders a holistic picture
of a community’s assets, resources, and problems by
contextualizing them with location. In the simplest
terms, GIS enables understanding of every aspect of
community data as it relates to geography. Today’s
expectations of GIS as a government solution are driven
by the principle of taking more prescriptive action.
Much money and effort is spent by public agencies
like utilities and emergency responders reacting
to events. Esri®
GIS technology now gives decision
makers the tools they need to get ahead of problems.
Over the past few years, governments have been
increasingly expected to deliver services in real-time
and make information more accessible, not only within
departments but with stakeholders such as other
governments and the tax-paying public. At the very
least, problem identification to action must now
occur in real-time.
Here are four ways GIS provides community leaders
with the ability to make informed decisions and
actualize real progress:
Real-time dashboards provide a way to absorb and derive
meaning from real-time data. Dashboards allow government
organizations to visualize information on a large scale and
allocate resources where they’re needed. During weather
emergencies, for instance, dashboards enable more efficient
ways to respond to flurries of endless snow.
In the city of Boston, Massachusetts, public works staff
now use dashboards and real-time data feeds to monitor and
respond to ice storms. During one of the largest blizzards in
U.S. history, that helped the city make decisions in real time,
saving money and protecting the lives of Boston commuters
and pedestrians.
Part of the decision-making process is communicating with
stakeholders. Esri®
story maps are an effective tool to improve
communication and understanding, not just with key members
of government but with citizens as well. They make data
accessible so that people who need critical information can
get the intelligence they need and take immediate action.
Advertising Supplement | esri.com
The Kids First Allen Story Map Journal was used effectively
to spur the eventual passage of a $272 million school bond
measure for Allen Independent School District (AISD) in
the Dallas suburb of Allen, Texas. It helped educate voters
about why a school bond was needed and included school
plans and potential tax implications.
The Celebrating Lost Loved Ones map was created to show
both prescription drug and heroin deaths to show that the
prescription drug and heroin addiction epidemics are bound
together, jointly causing massive impact. States are putting
together resources to display and analyze data such as
mortality trends within a community, prescription drug
dropbox locations, and prescription drug access points.
Each of these resources helps communities become better
informed about the effects of opioid addiction and enables
them to more intelligently fight it. Removing the stigma
attached to both legal and illegal drug addiction using
authoritative data will better inform future response to
opioid addiction in the U.S.
Learn more at
esri.com/DataDrivenDecisions
Real-Time Dashboards
Storytelling
FOUR WAYSto Move from Decision to Action
How GIS Actualizes Smart Communities
Map analysis is also used to combat the national opioid
epidemic. Individual states are putting together resources to
geospatially analyze demographic, health, and pharmacy
data in GIS. This analysis helps communities become better
informed about the patters, trends, and effects of
opioid addiction.
Copyright © 2016 Esri. All rights reserved. Esri, the Esri globe logo, ArcGIS, StreetMap, Business Analyst, @esri.com, and esri.
com are trademarks, service marks, or registered marks of Esri in the United States, the European Community, or certain other
jurisdictions. Other companies and products or services mentioned herein may be trademarks, service marks, or registered marks
of their respective mark owners. G73789
Learn more at
esri.com/DataDrivenDecisions
Nowhere is the challenge of empowering stakeholders to
make real-time decisions more evident than in the field.
Field accessibility allows workers to make better decisions
remotely and to assign help without delay.
DeKalb County, Georgia’s Community Development
Department used a custom mobile GIS application to quickly
enter data from the homeless and pinpoint the exact location
of each surveyed person. The GIS platform helped volunteers
collect reliable information faster and locate approximately
200 unsheltered homeless people down to the street level.
The data was instantly available online and enabled the
speedy distribution of shelter to those who needed it.
Additionally, the city of Rancho Cucamonga, California, used
field data collection to immediately respond to a single
engine plane crash. Normally, an event like this might catch
even the most prepared emergency responders off guard,
but access to the city’s online GIS data from mobile devices
allowed those in the field to make better decisions, as well as
become real-time sensors themselves. Deployed firemen,
police, and other city employees transmitted information to
the GIS team, who would then compile these data streams
into a common portal.
Get Started
The future of public resource management is the ability
to go from decision to action in no more than the time it
takes to point and click. Real-time GIS-based decision
making meets the demands of today’s stringent
government and public expectations.
To learn more about the four ways Esri’s ArcGIS®
platform can help kick start your decisions into
action, visit esri.com/DataDrivenDecisions.
The large amounts of data that public agencies possess
must be shared and analyzed to give that data meaning and
utility. Mapping analysis allows departments to make sense
of large collections of information to turn policy into
substantive action on the ground.
Pinellas County, Florida, transformed its fragmented data
into a hub of apps and maps that drive operational
efficiency, such as a mobile data collection app for
gathering critical data after storms. Staff can easily find
and analyze data for future maintenance and management
needs. Pinellas County took advantage of mapping analysis
to easily integrate with other enterprise systems and
enable access to data by anyone on any device.
Mapping Analysis Field Accessibility
Advertising Supplement | esri.com

PMDataDrivenAdvertorial

  • 1.
    T he valueof geographic information system (GIS) technology for managers and executives in the civic sphere has been clear for decades. In a very broad sense, GIS gives stakeholders a holistic picture of a community’s assets, resources, and problems by contextualizing them with location. In the simplest terms, GIS enables understanding of every aspect of community data as it relates to geography. Today’s expectations of GIS as a government solution are driven by the principle of taking more prescriptive action. Much money and effort is spent by public agencies like utilities and emergency responders reacting to events. Esri® GIS technology now gives decision makers the tools they need to get ahead of problems. Over the past few years, governments have been increasingly expected to deliver services in real-time and make information more accessible, not only within departments but with stakeholders such as other governments and the tax-paying public. At the very least, problem identification to action must now occur in real-time. Here are four ways GIS provides community leaders with the ability to make informed decisions and actualize real progress: Real-time dashboards provide a way to absorb and derive meaning from real-time data. Dashboards allow government organizations to visualize information on a large scale and allocate resources where they’re needed. During weather emergencies, for instance, dashboards enable more efficient ways to respond to flurries of endless snow. In the city of Boston, Massachusetts, public works staff now use dashboards and real-time data feeds to monitor and respond to ice storms. During one of the largest blizzards in U.S. history, that helped the city make decisions in real time, saving money and protecting the lives of Boston commuters and pedestrians. Part of the decision-making process is communicating with stakeholders. Esri® story maps are an effective tool to improve communication and understanding, not just with key members of government but with citizens as well. They make data accessible so that people who need critical information can get the intelligence they need and take immediate action. Advertising Supplement | esri.com The Kids First Allen Story Map Journal was used effectively to spur the eventual passage of a $272 million school bond measure for Allen Independent School District (AISD) in the Dallas suburb of Allen, Texas. It helped educate voters about why a school bond was needed and included school plans and potential tax implications. The Celebrating Lost Loved Ones map was created to show both prescription drug and heroin deaths to show that the prescription drug and heroin addiction epidemics are bound together, jointly causing massive impact. States are putting together resources to display and analyze data such as mortality trends within a community, prescription drug dropbox locations, and prescription drug access points. Each of these resources helps communities become better informed about the effects of opioid addiction and enables them to more intelligently fight it. Removing the stigma attached to both legal and illegal drug addiction using authoritative data will better inform future response to opioid addiction in the U.S. Learn more at esri.com/DataDrivenDecisions Real-Time Dashboards Storytelling FOUR WAYSto Move from Decision to Action How GIS Actualizes Smart Communities
  • 2.
    Map analysis isalso used to combat the national opioid epidemic. Individual states are putting together resources to geospatially analyze demographic, health, and pharmacy data in GIS. This analysis helps communities become better informed about the patters, trends, and effects of opioid addiction. Copyright © 2016 Esri. All rights reserved. Esri, the Esri globe logo, ArcGIS, StreetMap, Business Analyst, @esri.com, and esri. com are trademarks, service marks, or registered marks of Esri in the United States, the European Community, or certain other jurisdictions. Other companies and products or services mentioned herein may be trademarks, service marks, or registered marks of their respective mark owners. G73789 Learn more at esri.com/DataDrivenDecisions Nowhere is the challenge of empowering stakeholders to make real-time decisions more evident than in the field. Field accessibility allows workers to make better decisions remotely and to assign help without delay. DeKalb County, Georgia’s Community Development Department used a custom mobile GIS application to quickly enter data from the homeless and pinpoint the exact location of each surveyed person. The GIS platform helped volunteers collect reliable information faster and locate approximately 200 unsheltered homeless people down to the street level. The data was instantly available online and enabled the speedy distribution of shelter to those who needed it. Additionally, the city of Rancho Cucamonga, California, used field data collection to immediately respond to a single engine plane crash. Normally, an event like this might catch even the most prepared emergency responders off guard, but access to the city’s online GIS data from mobile devices allowed those in the field to make better decisions, as well as become real-time sensors themselves. Deployed firemen, police, and other city employees transmitted information to the GIS team, who would then compile these data streams into a common portal. Get Started The future of public resource management is the ability to go from decision to action in no more than the time it takes to point and click. Real-time GIS-based decision making meets the demands of today’s stringent government and public expectations. To learn more about the four ways Esri’s ArcGIS® platform can help kick start your decisions into action, visit esri.com/DataDrivenDecisions. The large amounts of data that public agencies possess must be shared and analyzed to give that data meaning and utility. Mapping analysis allows departments to make sense of large collections of information to turn policy into substantive action on the ground. Pinellas County, Florida, transformed its fragmented data into a hub of apps and maps that drive operational efficiency, such as a mobile data collection app for gathering critical data after storms. Staff can easily find and analyze data for future maintenance and management needs. Pinellas County took advantage of mapping analysis to easily integrate with other enterprise systems and enable access to data by anyone on any device. Mapping Analysis Field Accessibility Advertising Supplement | esri.com