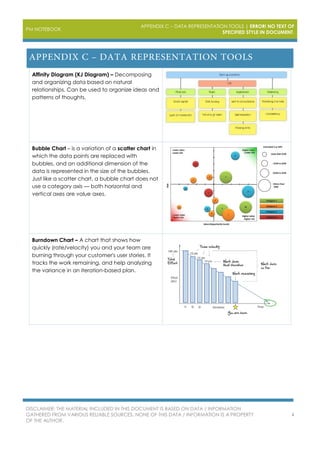
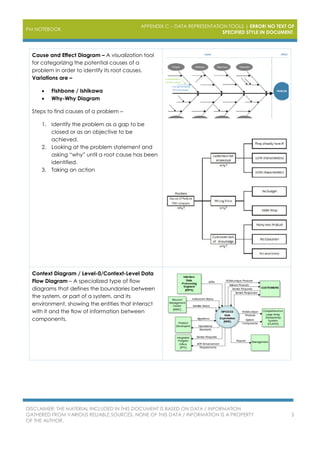
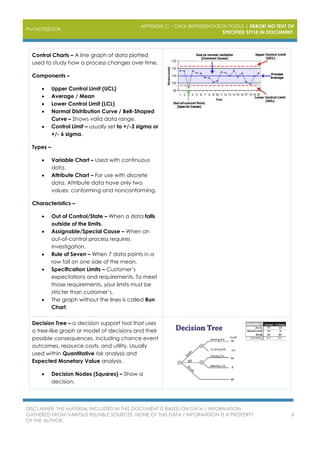
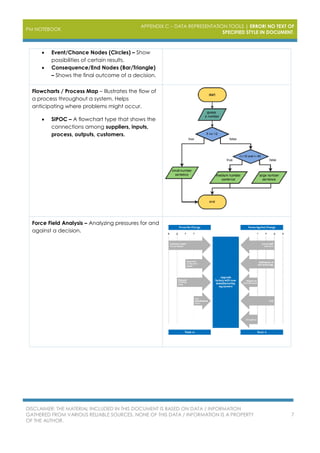
PM Notebook
Summarizing Project Management Concepts for the PMP
Exam
Mohammad Elsheimy Road to PMP
PM NOTEBOOK
APPENDIX C – DATA REPRESENTATION TOOLS | ERROR! NO TEXT OF
SPECIFIED STYLE IN DOCUMENT.
DISCLAIMER: THE MATERIAL INCLUDED IN THIS DOCUMENT IS BASED ON DATA / INFORMATION
GATHERED FROM VARIOUS RELIABLE SOURCES. NONE OF THIS DATA / INFORMATION IS A PROPERTY
OF THE AUTHOR.
1
DISCLAIMER: THE MATERIAL INCLUDED IN THIS DOCUMENT IS
BASED ON DATA/INFORMATION GATHERED FROM VARIOUS
RELIABLE SOURCES. NONE OF THIS DATA/INFORMATION IS A
PROPERTY OF THE AUTHOR. NONE IS INTENDED TO MAKE A
PROFIT IN ANY WAY. THIS IS FOR PERSONAL USE ONLY.
PM NOTEBOOK
APPENDIX C – DATA REPRESENTATION TOOLS | ERROR! NO TEXT OF
SPECIFIED STYLE IN DOCUMENT.
DISCLAIMER: THE MATERIAL INCLUDED IN THIS DOCUMENT IS BASED ON DATA / INFORMATION
GATHERED FROM VARIOUS RELIABLE SOURCES. NONE OF THIS DATA / INFORMATION IS A PROPERTY
OF THE AUTHOR.
2
No great man ever complains of want of opportunity.
Ralph Waldo Emerson
PM NOTEBOOK
APPENDIX C – DATA REPRESENTATION TOOLS | ERROR! NO TEXT OF
SPECIFIED STYLE IN DOCUMENT.
DISCLAIMER: THE MATERIAL INCLUDED IN THIS DOCUMENT IS BASED ON DATA / INFORMATION
GATHERED FROM VARIOUS RELIABLE SOURCES. NONE OF THIS DATA / INFORMATION IS A PROPERTY
OF THE AUTHOR.
3
Table of Contents
Appendix C – Data Representation Tools........................................................................................................... 4
PM NOTEBOOK
APPENDIX C – DATA REPRESENTATION TOOLS | ERROR! NO TEXT OF
SPECIFIED STYLE IN DOCUMENT.
DISCLAIMER: THE MATERIAL INCLUDED IN THIS DOCUMENT IS BASED ON DATA / INFORMATION
GATHERED FROM VARIOUS RELIABLE SOURCES. NONE OF THIS DATA / INFORMATION IS A PROPERTY
OF THE AUTHOR.
4
Affinity Diagram (KJ Diagram) – Decomposing
and organizing data based on natural
relationships. Can be used to organize ideas and
patterns of thoughts.
Bubble Chart – is a variation of a scatter chart in
which the data points are replaced with
bubbles, and an additional dimension of the
data is represented in the size of the bubbles.
Just like a scatter chart, a bubble chart does not
use a category axis — both horizontal and
vertical axes are value axes.
Burndown Chart – A chart that shows how
quickly (rate/velocity) you and your team are
burning through your customer's user stories. It
tracks the work remaining, and help analyzing
the variance in an iteration-based plan.
PM NOTEBOOK
APPENDIX C – DATA REPRESENTATION TOOLS | ERROR! NO TEXT OF
SPECIFIED STYLE IN DOCUMENT.
DISCLAIMER: THE MATERIAL INCLUDED IN THIS DOCUMENT IS BASED ON DATA / INFORMATION
GATHERED FROM VARIOUS RELIABLE SOURCES. NONE OF THIS DATA / INFORMATION IS A PROPERTY
OF THE AUTHOR.
5
Cause and Effect Diagram – A visualization tool
for categorizing the potential causes of a
problem in order to identify its root causes.
Variations are –
 Fishbone / Ishikawa
 Why-Why Diagram
Steps to find causes of a problem –
1. Identify the problem as a gap to be
closed or as an objective to be
achieved.
2. Looking at the problem statement and
asking “why” until a root cause has been
identified.
3. Taking an action
Context Diagram / Level-0/Context-Level Data
Flow Diagram – A specialized type of flow
diagrams that defines the boundaries between
the system, or part of a system, and its
environment, showing the entities that interact
with it and the flow of information between
components.
PM NOTEBOOK
APPENDIX C – DATA REPRESENTATION TOOLS | ERROR! NO TEXT OF
SPECIFIED STYLE IN DOCUMENT.
DISCLAIMER: THE MATERIAL INCLUDED IN THIS DOCUMENT IS BASED ON DATA / INFORMATION
GATHERED FROM VARIOUS RELIABLE SOURCES. NONE OF THIS DATA / INFORMATION IS A PROPERTY
OF THE AUTHOR.
6
Control Charts – A line graph of data plotted
used to study how a process changes over time.
Components –
 Upper Control Limit (UCL)
 Average / Mean
 Lower Control Limit (LCL)
 Normal Distribution Curve / Bell-Shaped
Curve – Shows valid data range.
 Control Limit – usually set to +/-3 sigma or
+/- 6 sigma.
Types –
 Variable Chart – Used with continuous
data.
 Attribute Chart – For use with discrete
data. Attribute data have only two
values: conforming and nonconforming.
Characteristics –
 Out of Control/State – When a data falls
outside of the limits.
 Assignable/Special Cause – When an
out-of-control process requires
investigation.
 Rule of Seven – When 7 data points in a
row fall on one side of the mean.
 Specification Limits – Customer’s
expectations and requirements. To meet
those requirements, your limits must be
stricter than customer’s.
 The graph without the lines is called Run
Chart.
Decision Tree – a decision support tool that uses
a tree-like graph or model of decisions and their
possible consequences, including chance event
outcomes, resource costs, and utility. Usually
used within Quantitative risk analysis and
Expected Monetary Value analysis.
 Decision Nodes (Squares) – Show a
decision.
PM NOTEBOOK
APPENDIX C – DATA REPRESENTATION TOOLS | ERROR! NO TEXT OF
SPECIFIED STYLE IN DOCUMENT.
DISCLAIMER: THE MATERIAL INCLUDED IN THIS DOCUMENT IS BASED ON DATA / INFORMATION
GATHERED FROM VARIOUS RELIABLE SOURCES. NONE OF THIS DATA / INFORMATION IS A PROPERTY
OF THE AUTHOR.
7
 Event/Chance Nodes (Circles) – Show
possibilities of certain results.
 Consequence/End Nodes (Bar/Triangle)
– Shows the final outcome of a decision.
Flowcharts / Process Map – Illustrates the flow of
a process throughout a system. Helps
anticipating where problems might occur.
 SIPOC – A flowchart type that shows the
connections among suppliers, inputs,
process, outputs, customers.
Force Field Analysis – Analyzing pressures for and
against a decision.
PM NOTEBOOK
APPENDIX C – DATA REPRESENTATION TOOLS | ERROR! NO TEXT OF
SPECIFIED STYLE IN DOCUMENT.
DISCLAIMER: THE MATERIAL INCLUDED IN THIS DOCUMENT IS BASED ON DATA / INFORMATION
GATHERED FROM VARIOUS RELIABLE SOURCES. NONE OF THIS DATA / INFORMATION IS A PROPERTY
OF THE AUTHOR.
8
Grantt Chart – plots current work schedule
against calendar. Gives quick insights into task
schedules and resource utilizations.
Histograms – A type of bar charts, has no
particular order and used to represent
 Central Tendency
 Dispersion
 Shape of Statistical Distribution
Influence Diagram - graphical representations of
situations showing causal influences, time
ordering of events, and other relationships
among variables and outcomes.
Interrelationship Digraphs – Allows you to see
and analyze relationships among numerous
different issues.
PM NOTEBOOK
APPENDIX C – DATA REPRESENTATION TOOLS | ERROR! NO TEXT OF
SPECIFIED STYLE IN DOCUMENT.
DISCLAIMER: THE MATERIAL INCLUDED IN THIS DOCUMENT IS BASED ON DATA / INFORMATION
GATHERED FROM VARIOUS RELIABLE SOURCES. NONE OF THIS DATA / INFORMATION IS A PROPERTY
OF THE AUTHOR.
9
Matrix Diagrams – Tables, spreadsheets and
pivot tables.
Manpower/Resource Histogram – Shows how
many people / hours are needed to get a job
done over time, so you can schedule the right
number of workers for each stage of a project.
Mind Maps – Decomposing and grouping
brainstormed ideas.
Pareto Charts/Diagrams – A type of histogram
that contains both bars and a line graph, where
individual values are represented in descending
order by bars, and the cumulative total is
represented by the line.
 Basic Pareto – identifies that vital few
contributors that account for most
quality problems.
 Weighted Pareto – gives a measure of
significance to factors that may not
appear significant at first (such as cost,
time, and criticality.)
 Comparative Pareto – focuses on any
number of program options or actions.
80/20 Rule / Vilfredo Pareto Principle / Principle
of Factor Sparsity / Solzo Rule / Law of Vital Few
(Joseph Juran) – A rule that says that 80 percent
of quality problems are caused by 20 percent of
potential sources of problems.
PM NOTEBOOK
APPENDIX C – DATA REPRESENTATION TOOLS | ERROR! NO TEXT OF
SPECIFIED STYLE IN DOCUMENT.
DISCLAIMER: THE MATERIAL INCLUDED IN THIS DOCUMENT IS BASED ON DATA / INFORMATION
GATHERED FROM VARIOUS RELIABLE SOURCES. NONE OF THIS DATA / INFORMATION IS A PROPERTY
OF THE AUTHOR.
10
Process Decision Program Chart (PDPC) – to
identify the consequential impact of failure on
activity plans, and create appropriate
contingency plans to limit risks.
Run Chart – a line graph of data plotted over
time.
 Trend – Where 5 or more sequential data
points are all going up or are all going
down.
Scatter Diagram / Correlation Chart – A graph in
which the values of two variables are plotted
along two axes, the pattern of the resulting
points revealing any correlation present.
Correlation –
 Regression/Correlation Line – To show the
correlation. Can be used for estimation
and forecasting.
 Positive/Proportional Correlation – As one
quantity increases, so does the other.
 Negative/Inverse Correlation – As one
quantity increases, the other decreases.
 No Correlation – Both quantities vary with
no clear relationship.
Variables –
 Independent Variable – variable that
does not change by other variables.
 Dependent Variable – variable that
changes based on the change of
another variable.
PM NOTEBOOK
APPENDIX C – DATA REPRESENTATION TOOLS | ERROR! NO TEXT OF
SPECIFIED STYLE IN DOCUMENT.
DISCLAIMER: THE MATERIAL INCLUDED IN THIS DOCUMENT IS BASED ON DATA / INFORMATION
GATHERED FROM VARIOUS RELIABLE SOURCES. NONE OF THIS DATA / INFORMATION IS A PROPERTY
OF THE AUTHOR.
11
Tornado Diagram / Sensitivity Analysis – A
special bar chart which is a graphical output of
a comparative sensitivity analysis. It is meant to
give you an idea of which factors are most
important to the decision / risk at hand.
Tree Diagram – can be used to find the number
of possible outcomes and calculate the
probability of possible outcomes. Each branch in
a tree diagram represents a possible outcome.
Venn Diagram / Primary Diagram / Set Diagram
– a diagram representing logical sets pictorially
as circles or closed curves within an enclosing
rectangle (the universal set), common elements
of the sets being represented by intersections of
the circles. You can see the Venn Diagram in
Salience Model stakeholder analysis technique.

PM Notebook - Appendix C - Data Representation Tools

  • 1.
    PM Notebook Summarizing ProjectManagement Concepts for the PMP Exam Mohammad Elsheimy Road to PMP
  • 2.
    PM NOTEBOOK APPENDIX C– DATA REPRESENTATION TOOLS | ERROR! NO TEXT OF SPECIFIED STYLE IN DOCUMENT. DISCLAIMER: THE MATERIAL INCLUDED IN THIS DOCUMENT IS BASED ON DATA / INFORMATION GATHERED FROM VARIOUS RELIABLE SOURCES. NONE OF THIS DATA / INFORMATION IS A PROPERTY OF THE AUTHOR. 1 DISCLAIMER: THE MATERIAL INCLUDED IN THIS DOCUMENT IS BASED ON DATA/INFORMATION GATHERED FROM VARIOUS RELIABLE SOURCES. NONE OF THIS DATA/INFORMATION IS A PROPERTY OF THE AUTHOR. NONE IS INTENDED TO MAKE A PROFIT IN ANY WAY. THIS IS FOR PERSONAL USE ONLY.
  • 3.
    PM NOTEBOOK APPENDIX C– DATA REPRESENTATION TOOLS | ERROR! NO TEXT OF SPECIFIED STYLE IN DOCUMENT. DISCLAIMER: THE MATERIAL INCLUDED IN THIS DOCUMENT IS BASED ON DATA / INFORMATION GATHERED FROM VARIOUS RELIABLE SOURCES. NONE OF THIS DATA / INFORMATION IS A PROPERTY OF THE AUTHOR. 2 No great man ever complains of want of opportunity. Ralph Waldo Emerson
  • 4.
    PM NOTEBOOK APPENDIX C– DATA REPRESENTATION TOOLS | ERROR! NO TEXT OF SPECIFIED STYLE IN DOCUMENT. DISCLAIMER: THE MATERIAL INCLUDED IN THIS DOCUMENT IS BASED ON DATA / INFORMATION GATHERED FROM VARIOUS RELIABLE SOURCES. NONE OF THIS DATA / INFORMATION IS A PROPERTY OF THE AUTHOR. 3 Table of Contents Appendix C – Data Representation Tools........................................................................................................... 4
  • 5.
    PM NOTEBOOK APPENDIX C– DATA REPRESENTATION TOOLS | ERROR! NO TEXT OF SPECIFIED STYLE IN DOCUMENT. DISCLAIMER: THE MATERIAL INCLUDED IN THIS DOCUMENT IS BASED ON DATA / INFORMATION GATHERED FROM VARIOUS RELIABLE SOURCES. NONE OF THIS DATA / INFORMATION IS A PROPERTY OF THE AUTHOR. 4 Affinity Diagram (KJ Diagram) – Decomposing and organizing data based on natural relationships. Can be used to organize ideas and patterns of thoughts. Bubble Chart – is a variation of a scatter chart in which the data points are replaced with bubbles, and an additional dimension of the data is represented in the size of the bubbles. Just like a scatter chart, a bubble chart does not use a category axis — both horizontal and vertical axes are value axes. Burndown Chart – A chart that shows how quickly (rate/velocity) you and your team are burning through your customer's user stories. It tracks the work remaining, and help analyzing the variance in an iteration-based plan.
  • 6.
    PM NOTEBOOK APPENDIX C– DATA REPRESENTATION TOOLS | ERROR! NO TEXT OF SPECIFIED STYLE IN DOCUMENT. DISCLAIMER: THE MATERIAL INCLUDED IN THIS DOCUMENT IS BASED ON DATA / INFORMATION GATHERED FROM VARIOUS RELIABLE SOURCES. NONE OF THIS DATA / INFORMATION IS A PROPERTY OF THE AUTHOR. 5 Cause and Effect Diagram – A visualization tool for categorizing the potential causes of a problem in order to identify its root causes. Variations are –  Fishbone / Ishikawa  Why-Why Diagram Steps to find causes of a problem – 1. Identify the problem as a gap to be closed or as an objective to be achieved. 2. Looking at the problem statement and asking “why” until a root cause has been identified. 3. Taking an action Context Diagram / Level-0/Context-Level Data Flow Diagram – A specialized type of flow diagrams that defines the boundaries between the system, or part of a system, and its environment, showing the entities that interact with it and the flow of information between components.
  • 7.
    PM NOTEBOOK APPENDIX C– DATA REPRESENTATION TOOLS | ERROR! NO TEXT OF SPECIFIED STYLE IN DOCUMENT. DISCLAIMER: THE MATERIAL INCLUDED IN THIS DOCUMENT IS BASED ON DATA / INFORMATION GATHERED FROM VARIOUS RELIABLE SOURCES. NONE OF THIS DATA / INFORMATION IS A PROPERTY OF THE AUTHOR. 6 Control Charts – A line graph of data plotted used to study how a process changes over time. Components –  Upper Control Limit (UCL)  Average / Mean  Lower Control Limit (LCL)  Normal Distribution Curve / Bell-Shaped Curve – Shows valid data range.  Control Limit – usually set to +/-3 sigma or +/- 6 sigma. Types –  Variable Chart – Used with continuous data.  Attribute Chart – For use with discrete data. Attribute data have only two values: conforming and nonconforming. Characteristics –  Out of Control/State – When a data falls outside of the limits.  Assignable/Special Cause – When an out-of-control process requires investigation.  Rule of Seven – When 7 data points in a row fall on one side of the mean.  Specification Limits – Customer’s expectations and requirements. To meet those requirements, your limits must be stricter than customer’s.  The graph without the lines is called Run Chart. Decision Tree – a decision support tool that uses a tree-like graph or model of decisions and their possible consequences, including chance event outcomes, resource costs, and utility. Usually used within Quantitative risk analysis and Expected Monetary Value analysis.  Decision Nodes (Squares) – Show a decision.
  • 8.
    PM NOTEBOOK APPENDIX C– DATA REPRESENTATION TOOLS | ERROR! NO TEXT OF SPECIFIED STYLE IN DOCUMENT. DISCLAIMER: THE MATERIAL INCLUDED IN THIS DOCUMENT IS BASED ON DATA / INFORMATION GATHERED FROM VARIOUS RELIABLE SOURCES. NONE OF THIS DATA / INFORMATION IS A PROPERTY OF THE AUTHOR. 7  Event/Chance Nodes (Circles) – Show possibilities of certain results.  Consequence/End Nodes (Bar/Triangle) – Shows the final outcome of a decision. Flowcharts / Process Map – Illustrates the flow of a process throughout a system. Helps anticipating where problems might occur.  SIPOC – A flowchart type that shows the connections among suppliers, inputs, process, outputs, customers. Force Field Analysis – Analyzing pressures for and against a decision.
  • 9.
    PM NOTEBOOK APPENDIX C– DATA REPRESENTATION TOOLS | ERROR! NO TEXT OF SPECIFIED STYLE IN DOCUMENT. DISCLAIMER: THE MATERIAL INCLUDED IN THIS DOCUMENT IS BASED ON DATA / INFORMATION GATHERED FROM VARIOUS RELIABLE SOURCES. NONE OF THIS DATA / INFORMATION IS A PROPERTY OF THE AUTHOR. 8 Grantt Chart – plots current work schedule against calendar. Gives quick insights into task schedules and resource utilizations. Histograms – A type of bar charts, has no particular order and used to represent  Central Tendency  Dispersion  Shape of Statistical Distribution Influence Diagram - graphical representations of situations showing causal influences, time ordering of events, and other relationships among variables and outcomes. Interrelationship Digraphs – Allows you to see and analyze relationships among numerous different issues.
  • 10.
    PM NOTEBOOK APPENDIX C– DATA REPRESENTATION TOOLS | ERROR! NO TEXT OF SPECIFIED STYLE IN DOCUMENT. DISCLAIMER: THE MATERIAL INCLUDED IN THIS DOCUMENT IS BASED ON DATA / INFORMATION GATHERED FROM VARIOUS RELIABLE SOURCES. NONE OF THIS DATA / INFORMATION IS A PROPERTY OF THE AUTHOR. 9 Matrix Diagrams – Tables, spreadsheets and pivot tables. Manpower/Resource Histogram – Shows how many people / hours are needed to get a job done over time, so you can schedule the right number of workers for each stage of a project. Mind Maps – Decomposing and grouping brainstormed ideas. Pareto Charts/Diagrams – A type of histogram that contains both bars and a line graph, where individual values are represented in descending order by bars, and the cumulative total is represented by the line.  Basic Pareto – identifies that vital few contributors that account for most quality problems.  Weighted Pareto – gives a measure of significance to factors that may not appear significant at first (such as cost, time, and criticality.)  Comparative Pareto – focuses on any number of program options or actions. 80/20 Rule / Vilfredo Pareto Principle / Principle of Factor Sparsity / Solzo Rule / Law of Vital Few (Joseph Juran) – A rule that says that 80 percent of quality problems are caused by 20 percent of potential sources of problems.
  • 11.
    PM NOTEBOOK APPENDIX C– DATA REPRESENTATION TOOLS | ERROR! NO TEXT OF SPECIFIED STYLE IN DOCUMENT. DISCLAIMER: THE MATERIAL INCLUDED IN THIS DOCUMENT IS BASED ON DATA / INFORMATION GATHERED FROM VARIOUS RELIABLE SOURCES. NONE OF THIS DATA / INFORMATION IS A PROPERTY OF THE AUTHOR. 10 Process Decision Program Chart (PDPC) – to identify the consequential impact of failure on activity plans, and create appropriate contingency plans to limit risks. Run Chart – a line graph of data plotted over time.  Trend – Where 5 or more sequential data points are all going up or are all going down. Scatter Diagram / Correlation Chart – A graph in which the values of two variables are plotted along two axes, the pattern of the resulting points revealing any correlation present. Correlation –  Regression/Correlation Line – To show the correlation. Can be used for estimation and forecasting.  Positive/Proportional Correlation – As one quantity increases, so does the other.  Negative/Inverse Correlation – As one quantity increases, the other decreases.  No Correlation – Both quantities vary with no clear relationship. Variables –  Independent Variable – variable that does not change by other variables.  Dependent Variable – variable that changes based on the change of another variable.
  • 12.
    PM NOTEBOOK APPENDIX C– DATA REPRESENTATION TOOLS | ERROR! NO TEXT OF SPECIFIED STYLE IN DOCUMENT. DISCLAIMER: THE MATERIAL INCLUDED IN THIS DOCUMENT IS BASED ON DATA / INFORMATION GATHERED FROM VARIOUS RELIABLE SOURCES. NONE OF THIS DATA / INFORMATION IS A PROPERTY OF THE AUTHOR. 11 Tornado Diagram / Sensitivity Analysis – A special bar chart which is a graphical output of a comparative sensitivity analysis. It is meant to give you an idea of which factors are most important to the decision / risk at hand. Tree Diagram – can be used to find the number of possible outcomes and calculate the probability of possible outcomes. Each branch in a tree diagram represents a possible outcome. Venn Diagram / Primary Diagram / Set Diagram – a diagram representing logical sets pictorially as circles or closed curves within an enclosing rectangle (the universal set), common elements of the sets being represented by intersections of the circles. You can see the Venn Diagram in Salience Model stakeholder analysis technique.