Downloaded 13 times


![PM NOTEBOOK CHAPTER 6 – SCHEDULE MANAGEMENT | ACTIVITIES
DISCLAIMER: THE MATERIAL INCLUDED IN THIS DOCUMENT IS BASED ON DATA / INFORMATION
GATHERED FROM VARIOUS RELIABLE SOURCES. NONE OF THIS DATA / INFORMATION IS A PROPERTY
OF THE AUTHOR.
69
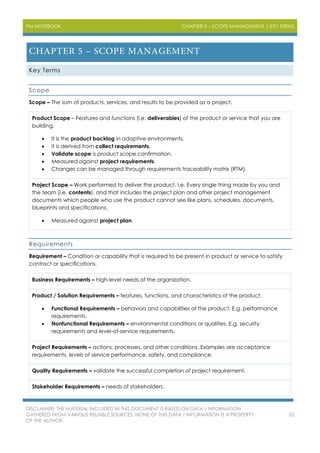
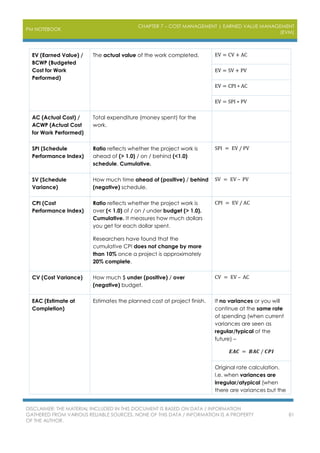
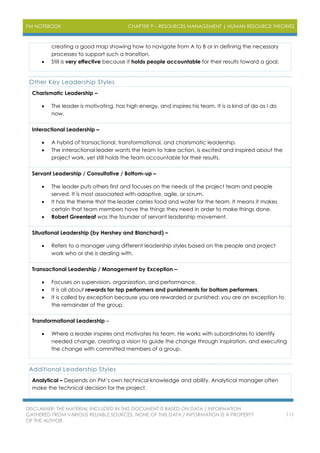
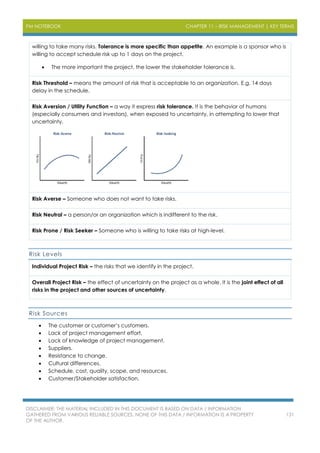
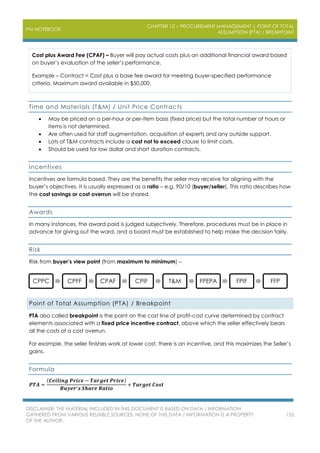
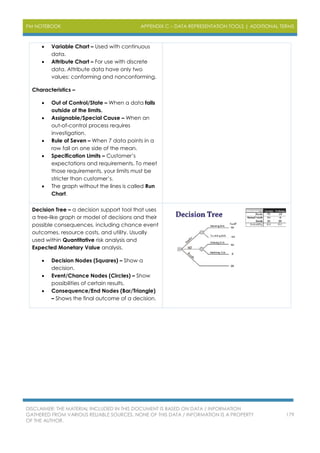
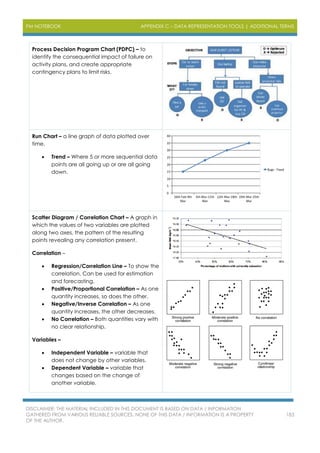
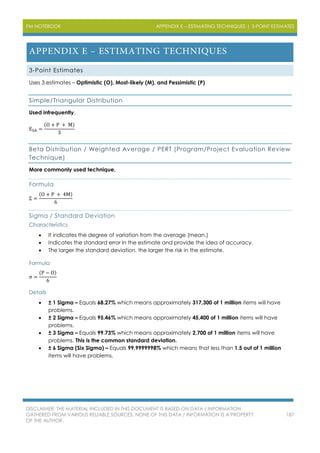
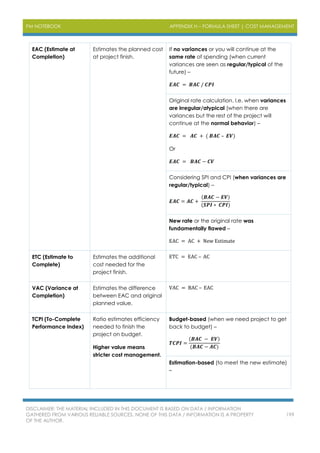
Hammock Activity – It is a type of activity that is used for grouping smaller activities that hang
between two dates. The size of the hammock, or the duration of the hammock is calculated by
the start date of the earliest task, and the finish date of the last task.
Laddering Activities – It is when work elements in an activity are progressively released to the next
activity thus causing them to be overlapped during their execution.
Relationships
Types of relationships between two dependencies A (first) and B (second) –
1. Finish to Start (FS) – B(S) = A(F) [ + 1 ]
2. Start to Start (SS) – B(S) = A(S)](https://image.slidesharecdn.com/pmnotebook-200316175425/85/PM-Notebook-70-320.jpg)
![PM NOTEBOOK
CHAPTER 6 – SCHEDULE MANAGEMENT | CRITICAL PATH METHOD (CPM)
/ LOGIC-DRIVEN SCHEDULING
DISCLAIMER: THE MATERIAL INCLUDED IN THIS DOCUMENT IS BASED ON DATA / INFORMATION
GATHERED FROM VARIOUS RELIABLE SOURCES. NONE OF THIS DATA / INFORMATION IS A PROPERTY
OF THE AUTHOR.
70
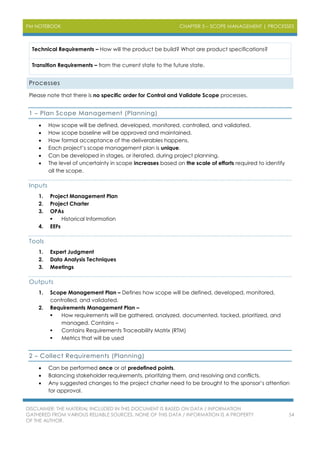
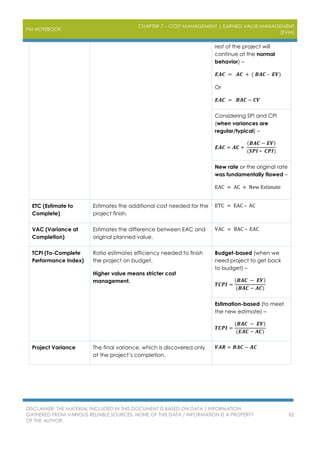
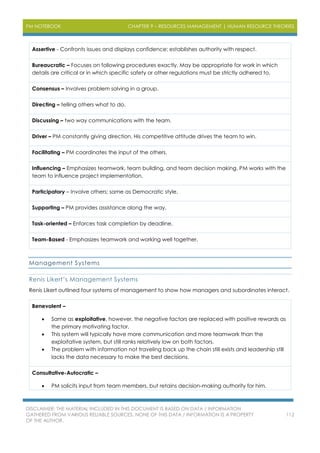
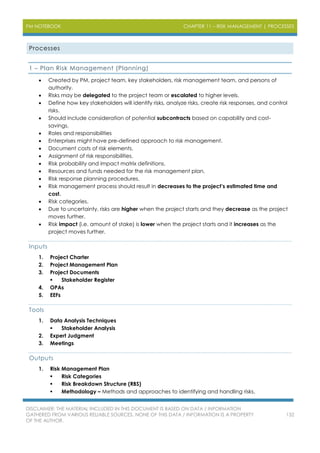
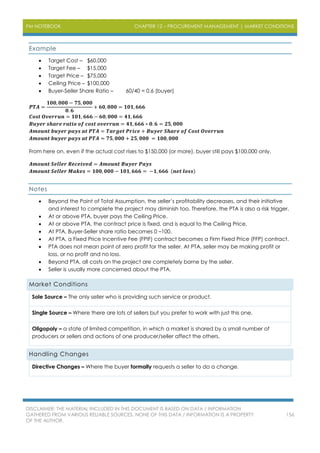
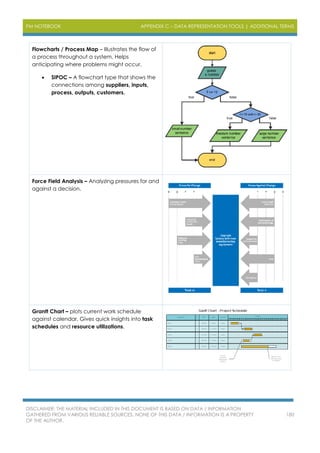
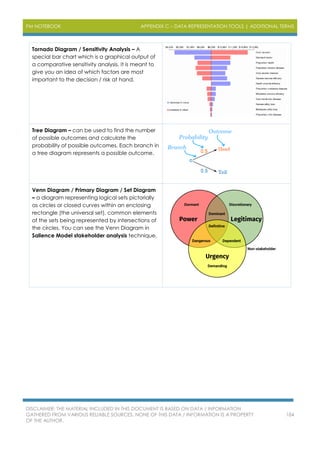
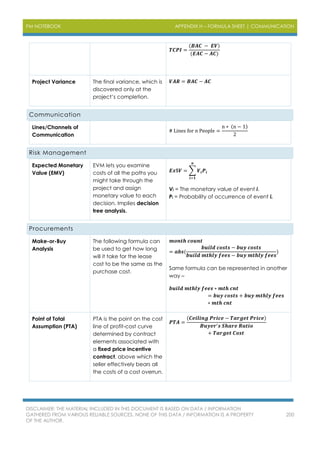
3. Finish to Finish (FF) – B(F) = A(F)
4. Start to Finish (SF) – B(F) = A(S) [ - 1 ]
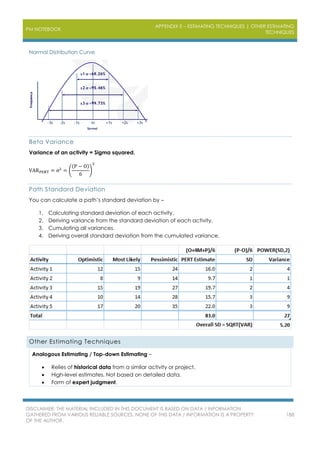
Critical Path Method (CPM) / Logic-Driven Scheduling
Critical Path Method involves measuring the longest sequence of activities, it focuses on activity
order.
Critical Path (CP) – The string of activities that is longer than any other path. A delay in any
one of the critical activities will delay the whole project.
Near-Critical Path – The path that is close in duration to the critical path. Sometimes, the
near-critical path becomes the critical.
Please note that following regarding critical path –
Multiple critical paths increase project risk.
Critical path has zero or negative float in case that there is a constraint set on the project
finish date.
Float / Slack
The amount of time that an activity can slip before it causes the project to be delayed.
Total Float (Slack) – The amount of time an activity can be delayed without delaying the project
end date. It cannot be aggregated, and is shared across the path.
Free Float – The amount of time an activity can be delayed without delaying the early start date
of its successor (S).
Project Float – The amount of time a project can be delayed without delaying the externally
imposed project completion date required by the customer or management.
Negative Float – Means that estimated completion date is after the desired date.
Components
Early Start (ES) – The earliest time that an activity can start.
Early Finish (EF) – The earliest time that an activity can finish.
Late Start (LS) – The latest time that an activity can start.
Late Finish (LF) – The latest time that an activity can finish without delaying the project.
Forward Pass – For early start and finish.
ES = Maximum EF of all predecessors + 1
EF = ES + Duration − 1
Backward Pass – For late start and finish.
LF – Minimum LS of all successors – 1
LS – LF − Duration + 1](https://image.slidesharecdn.com/pmnotebook-200316175425/85/PM-Notebook-71-320.jpg)

This document is a comprehensive notebook summarizing project management concepts for the PMP exam, compiling information from various reliable sources. It covers key topics including project lifecycle, integration management, scope management, schedule management, cost management, quality management, and stakeholder management, among others. Additionally, it outlines processes, frameworks, methodologies, and techniques relevant to effective project management.


