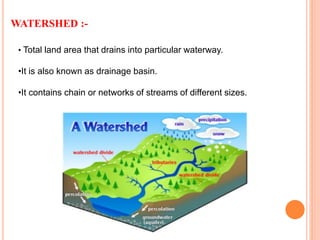
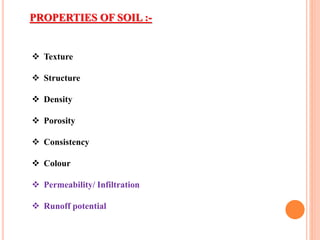
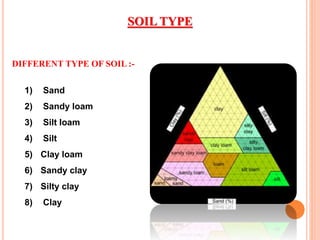
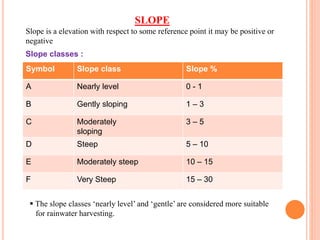
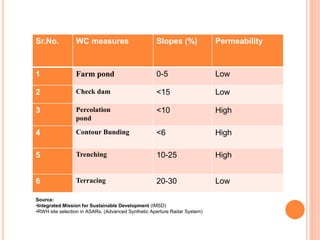
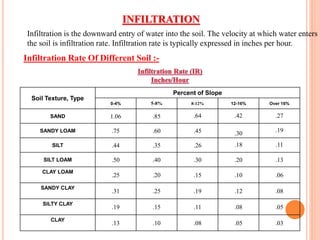
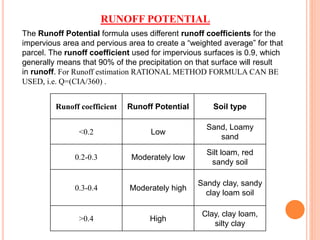
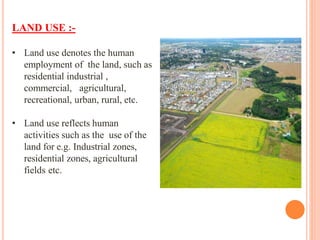
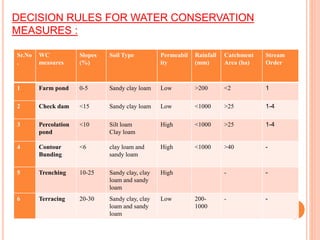
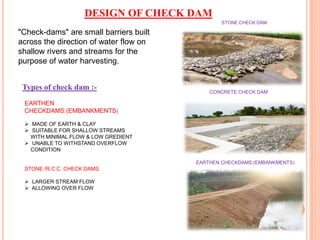
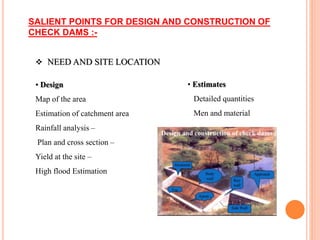
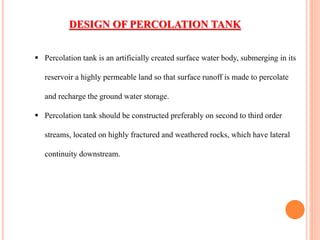
 DETERMINATION OF POTENTIAL SITES
FOR WATER CONSERVATION STRUCTURES .
POTENTIAL SITES;-
 The site which is suitable for construction of particular structure and
which satisfied the design aspects and fulfil the requirement after
construction.
 The suitable sites for water harvesting structures can be identify with the
help of Remote sensing and GIS. The contour map, watershed boundary
map, drainage map, land use map, soil map, DEM and buffer zone map
can be prepared using satellite imagery and SOI toposheets.
WATERSHED :-
• Total land area that drains into particular waterway.
•It is also known as drainage basin.
•It contains chain or networks of streams of different sizes.
PROPERTIES OF SOIL :-
 Texture
 Structure
 Density
 Porosity
 Consistency
 Colour
 Permeability/ Infiltration
 Runoff potential
SOIL TYPE
DIFFERENT TYPE OF SOIL :-
1) Sand
2) Sandy loam
3) Silt loam
4) Silt
5) Clay loam
6) Sandy clay
7) Silty clay
8) Clay
Symbol Slope class Slope %
A Nearly level 0 - 1
B Gently sloping 1 – 3
C Moderately
sloping
3 – 5
D Steep 5 – 10
E Moderately steep 10 – 15
F Very Steep 15 – 30
 The slope classes ‘nearly level’ and ‘gentle’ are considered more suitable
for rainwater harvesting.
Slope classes :
SLOPE
Slope is a elevation with respect to some reference point it may be positive or
negative
Source:
•Integrated Mission for Sustainable Development (IMSD)
•RWH site selection in ASARs. (Advanced Synthetic Aperture Radar System)
Sr.No. WC measures Slopes (%) Permeability
1 Farm pond 0-5 Low
2 Check dam <15 Low
3 Percolation
pond
<10 High
4 Contour Bunding <6 High
5 Trenching 10-25 High
6 Terracing 20-30 Low
Infiltration is the downward entry of water into the soil. The velocity at which water enters
the soil is infiltration rate. Infiltration rate is typically expressed in inches per hour.
INFILTRATION
Infiltration Rate Of Different Soil :-
Soil Texture, Type
Percent of Slope
0-4% 5-8% 8-12% 12-16% Over 16%
SAND 1.06 .85 .64 .42 .27
SANDY LOAM .75 .60 .45 .30
.19
SILT .44 .35 .26 .18 .11
SILT LOAM .50 .40 .30 .20 .13
CLAY LOAM
.25 .20 .15 .10 .06
SANDY CLAY
.31 .25 .19 .12 .08
SILTY CLAY
.19 .15 .11 .08 .05
CLAY
.13 .10 .08 .05 .03
RUNOFF POTENTIAL
The Runoff Potential formula uses different runoff coefficients for the
impervious area and pervious area to create a “weighted average” for that
parcel. The runoff coefficient used for impervious surfaces is 0.9, which
generally means that 90% of the precipitation on that surface will result
in runoff. For Runoff estimation RATIONAL METHOD FORMULA CAN BE
USED, i.e. Q=(CIA/360) .
Runoff coefficient Runoff Potential Soil type
<0.2 Low
Sand, Loamy
sand
0.2-0.3 Moderately low
Silt loam, red
sandy soil
0.3-0.4 Moderately high
Sandy clay, sandy
clay loam soil
>0.4 High
Clay, clay loam,
silty clay
GROUP CLASSIFICATION OF VARIOUS SOILAND
IT’S VARIOUS FACTORS :-
TYPE SOIL TYPE
RUNOFF
POTENTIAL
INFILTRATIO-
N RATE
Group A
Sand, loamy
sand Low High
Group B
Silt loam, red
sandy soil Moderately low Moderate
Group C
Sandy clay,
sandy clay loam
soil
Moderatly high Low
Group D
Clay, clay loam,
silty clay High Very low
LAND COVER LAND USE
• Now a days due to rapid growth in urbanization and industrialization,
there is increasing pressure on land, water and environment.
• There are many problems related with conversion of agricultural land in
to urban use. Every city is expanding in all directions resulting in large-
scale changes in urban land use.
LAND COVER :-
• Land cover refers to features of land
surface which may be natural, semi-
natural, managed or manmade .
• Land cover includes: water, grassland,
forest, bare soil etc.
• Land cover denotes the physical state
of land, such as the quantity and type
of surface vegetation, water and earth
materials.
LAND USE :-
• Land use denotes the human
employment of the land, such as
residential industrial ,
commercial, agricultural,
recreational, urban, rural, etc.
• Land use reflects human
activities such as the use of the
land for e.g. Industrial zones,
residential zones, agricultural
fields etc.
• Tomake property maps and to do settlement.
• Toconduct topographic survey for infrastructure
development.
• Tokeep database records related to property.
• Toevaluate the property value.
• Todivide the property in case of disputes.
• Towork with Board of Revenue, Public works departments, Utility
companies etc.
Need of Land Cover Land Use:-
Conventional methods :-
• Chains to measure distances
• Old mechanical Theodolites
• Vernier Theodolites
• Paper maps
Drawbacks :-
• Conventional Survey Methods are very tedious and time consuming.
• Large Number of measurements are required to prepare a map.
• Automated Survey Techniques are simpler and easy to record survey measurements
Modern Methods :-
• Automatic and Laser level
• Total Stations
• Photogrammetric Survey
• Remote Sensing Methods
• Global positioning systems
Fig. GPS SURVEY
Urban Growth in Bangalore City :-
STREAM ORDER
• Stream order is a measure of the relative size of streams.
• Range from smallest first-order to the largest the twelveth-order (Amazon)
• Over 80% of total length of Earth’s rivers and Streams are headwater
streams (first and second order).
• Greater the stream order the larger and longer the waterway.
• Two of the same order streams must come together before that stream goes
up one level.
• As water travels from source to mouth, the streams tend to increase in
width, depth, and discharge.
•The order of a stream can only increase by one unit when it joins a
stream of equal order.
STREAM ORDER :-
FIRST ORDER STREAMS:-
• First order streams have no
tributaries but can themselves be
tributaries of larger waterways.
• Smallest streams.
• Perennial: carry water all year.
• 1st order streams are fed by springs
lakes &/or surface runoff.
SECOND ORDER STREAMS:-
• Two first order streams come
together to form second order
streams.
• However, if a first order stream joins
a second order, it is still a second
order .
• It includes mountain cascades,
small streams coming out of hill
side and narrow, riffled shallow
forest brooks .
• When two second order
streams come together, it
forms a third order stream.
• When 2 third order streams
come together it forms a
fourth order stream and so
on.
• Streams having order 6th to
10th are considered as river.
Sr.No
.
WC
measures
Slopes
(%)
Soil Type Permeabil
ity
Rainfall
(mm)
Catchment
Area (ha)
Stream
Order
1 Farm pond 0-5 Sandy clay loam Low >200 <2 1
2 Check dam <15 Sandy clay loam Low <1000 >25 1-4
3 Percolation
pond
<10 Silt loam
Clay loam
High <1000 >25 1-4
4 Contour
Bunding
<6 clay loam and
sandy loam
High <1000 >40 -
5 Trenching 10-25 Sandy clay, clay
loam and sandy
loam
High - -
6 Terracing 20-30 Sandy clay, clay
loam and sandy
loam
Low 200-
1000
- -
DECISION RULES FOR WATER CONSERVATION
MEASURES :
"Check-dams" are small barriers built
across the direction of water flow on
shallow rivers and streams for the
purpose of water harvesting.
STONE CHECK DAM
CONCRETE CHECK DAM
Types of check dam :-
EARTHEN
CHECKDAMS:(EMBANKMENTS)
 MADE OF EARTH & CLAY
 SUITABLE FOR SHALLOW STREAMS
WITH MINIMAL FLOW & LOW GREDIENT
 UNABLE TO WITHSTAND OVERFLOW
CONDITION
STONE /R.C.C. CHECK DAMS
 LARGER STREAM FLOW
 ALLOWING OVER FLOW
EARTHEN CHECKDAMS:(EMBANKMENTS)
DESIGN OF CHECK DAM
SALIENT POINTS FOR DESIGN AND CONSTRUCTION OF
CHECK DAMS :-
 NEED AND SITE LOCATION
• Design
Map of the area
Estimation of catchment area
Rainfall analysis –
Plan and cross section –
Yield at the site –
High flood Estimation
• Estimates
Detailed quantities
Men and material
DESIGN OF PERCOLATION TANK
 Percolation tank is an artificially created surface water body, submerging in its
reservoir a highly permeable land so that surface runoff is made to percolate
and recharge the ground water storage.
 Percolation tank should be constructed preferably on second to third order
streams, located on highly fractured and weathered rocks, which have lateral
continuity downstream.
Capacity of the percolation tank has to be calculated on the basis of the
rainfall and catchment area of the tank. Also the weir length (surplus weir)
has to be calculated.
The procedure is as follows:
 Select the site for the percolation tank.
 From the toposheet, find out the correct catchment area of the watershed
at that location.
 Compute catchment yield from rainfall and runoff coefficient or Strange's
table (using monsoon rainfall; nature of catchment - good, average or bad;
and catchment area).
 Make suitable assumptions - such as number of fillings per year (say 2),
utilization of yield per filling (say 5%) etc. Compute capacity of percolation
tank (based-upon utilization of yield per filling).
 Development of stage-capacity curve/table: Draw the contour lines at
every 50 cm interval between the bed level and the highest ground level at
the site. From these contour lines, the capacity of the tank at 0.5 m, 1.0 m,
1.5 m, 2.0 m, …. height above the bed level is calculated.
 Compute full tank level (FTL) from stage-capacity curve/table.
 Guidelines for selection of sites for percolation tanks
 Site should be upper reaches of streams preferably through wasteland
Saucer shaped
 There should be existing wells 2 wells per sq.km Area should be there for
irrigation and a soil cover of 25 cm Aquifer should be weathered and
fractured Design criteria
 Dependability of rainfall < 300 mm 40% 380- 760 50 % 760 And above
65 % Absence of gauged values, adopt strange tables Only 20 % available
yield should be considered for design.
Guidelines for selection of sites for percolation tanks:-
Planing for water conservation structures

Planing for water conservation structures

  • 1.
     DETERMINATION OFPOTENTIAL SITES FOR WATER CONSERVATION STRUCTURES .
  • 2.
    POTENTIAL SITES;-  Thesite which is suitable for construction of particular structure and which satisfied the design aspects and fulfil the requirement after construction.  The suitable sites for water harvesting structures can be identify with the help of Remote sensing and GIS. The contour map, watershed boundary map, drainage map, land use map, soil map, DEM and buffer zone map can be prepared using satellite imagery and SOI toposheets.
  • 4.
    WATERSHED :- • Totalland area that drains into particular waterway. •It is also known as drainage basin. •It contains chain or networks of streams of different sizes.
  • 5.
    PROPERTIES OF SOIL:-  Texture  Structure  Density  Porosity  Consistency  Colour  Permeability/ Infiltration  Runoff potential
  • 6.
    SOIL TYPE DIFFERENT TYPEOF SOIL :- 1) Sand 2) Sandy loam 3) Silt loam 4) Silt 5) Clay loam 6) Sandy clay 7) Silty clay 8) Clay
  • 7.
    Symbol Slope classSlope % A Nearly level 0 - 1 B Gently sloping 1 – 3 C Moderately sloping 3 – 5 D Steep 5 – 10 E Moderately steep 10 – 15 F Very Steep 15 – 30  The slope classes ‘nearly level’ and ‘gentle’ are considered more suitable for rainwater harvesting. Slope classes : SLOPE Slope is a elevation with respect to some reference point it may be positive or negative
  • 8.
    Source: •Integrated Mission forSustainable Development (IMSD) •RWH site selection in ASARs. (Advanced Synthetic Aperture Radar System) Sr.No. WC measures Slopes (%) Permeability 1 Farm pond 0-5 Low 2 Check dam <15 Low 3 Percolation pond <10 High 4 Contour Bunding <6 High 5 Trenching 10-25 High 6 Terracing 20-30 Low
  • 9.
    Infiltration is thedownward entry of water into the soil. The velocity at which water enters the soil is infiltration rate. Infiltration rate is typically expressed in inches per hour. INFILTRATION Infiltration Rate Of Different Soil :- Soil Texture, Type Percent of Slope 0-4% 5-8% 8-12% 12-16% Over 16% SAND 1.06 .85 .64 .42 .27 SANDY LOAM .75 .60 .45 .30 .19 SILT .44 .35 .26 .18 .11 SILT LOAM .50 .40 .30 .20 .13 CLAY LOAM .25 .20 .15 .10 .06 SANDY CLAY .31 .25 .19 .12 .08 SILTY CLAY .19 .15 .11 .08 .05 CLAY .13 .10 .08 .05 .03
  • 10.
    RUNOFF POTENTIAL The RunoffPotential formula uses different runoff coefficients for the impervious area and pervious area to create a “weighted average” for that parcel. The runoff coefficient used for impervious surfaces is 0.9, which generally means that 90% of the precipitation on that surface will result in runoff. For Runoff estimation RATIONAL METHOD FORMULA CAN BE USED, i.e. Q=(CIA/360) . Runoff coefficient Runoff Potential Soil type <0.2 Low Sand, Loamy sand 0.2-0.3 Moderately low Silt loam, red sandy soil 0.3-0.4 Moderately high Sandy clay, sandy clay loam soil >0.4 High Clay, clay loam, silty clay
  • 11.
    GROUP CLASSIFICATION OFVARIOUS SOILAND IT’S VARIOUS FACTORS :- TYPE SOIL TYPE RUNOFF POTENTIAL INFILTRATIO- N RATE Group A Sand, loamy sand Low High Group B Silt loam, red sandy soil Moderately low Moderate Group C Sandy clay, sandy clay loam soil Moderatly high Low Group D Clay, clay loam, silty clay High Very low
  • 12.
    LAND COVER LANDUSE • Now a days due to rapid growth in urbanization and industrialization, there is increasing pressure on land, water and environment. • There are many problems related with conversion of agricultural land in to urban use. Every city is expanding in all directions resulting in large- scale changes in urban land use.
  • 13.
    LAND COVER :- •Land cover refers to features of land surface which may be natural, semi- natural, managed or manmade . • Land cover includes: water, grassland, forest, bare soil etc. • Land cover denotes the physical state of land, such as the quantity and type of surface vegetation, water and earth materials.
  • 14.
    LAND USE :- •Land use denotes the human employment of the land, such as residential industrial , commercial, agricultural, recreational, urban, rural, etc. • Land use reflects human activities such as the use of the land for e.g. Industrial zones, residential zones, agricultural fields etc.
  • 15.
    • Tomake propertymaps and to do settlement. • Toconduct topographic survey for infrastructure development. • Tokeep database records related to property. • Toevaluate the property value. • Todivide the property in case of disputes. • Towork with Board of Revenue, Public works departments, Utility companies etc. Need of Land Cover Land Use:-
  • 16.
    Conventional methods :- •Chains to measure distances • Old mechanical Theodolites • Vernier Theodolites • Paper maps Drawbacks :- • Conventional Survey Methods are very tedious and time consuming. • Large Number of measurements are required to prepare a map. • Automated Survey Techniques are simpler and easy to record survey measurements
  • 17.
    Modern Methods :- •Automatic and Laser level • Total Stations • Photogrammetric Survey • Remote Sensing Methods • Global positioning systems Fig. GPS SURVEY Urban Growth in Bangalore City :-
  • 18.
    STREAM ORDER • Streamorder is a measure of the relative size of streams. • Range from smallest first-order to the largest the twelveth-order (Amazon) • Over 80% of total length of Earth’s rivers and Streams are headwater streams (first and second order). • Greater the stream order the larger and longer the waterway.
  • 19.
    • Two ofthe same order streams must come together before that stream goes up one level. • As water travels from source to mouth, the streams tend to increase in width, depth, and discharge. •The order of a stream can only increase by one unit when it joins a stream of equal order. STREAM ORDER :-
  • 20.
    FIRST ORDER STREAMS:- •First order streams have no tributaries but can themselves be tributaries of larger waterways. • Smallest streams. • Perennial: carry water all year. • 1st order streams are fed by springs lakes &/or surface runoff.
  • 21.
    SECOND ORDER STREAMS:- •Two first order streams come together to form second order streams. • However, if a first order stream joins a second order, it is still a second order . • It includes mountain cascades, small streams coming out of hill side and narrow, riffled shallow forest brooks .
  • 22.
    • When twosecond order streams come together, it forms a third order stream. • When 2 third order streams come together it forms a fourth order stream and so on. • Streams having order 6th to 10th are considered as river.
  • 23.
    Sr.No . WC measures Slopes (%) Soil Type Permeabil ity Rainfall (mm) Catchment Area(ha) Stream Order 1 Farm pond 0-5 Sandy clay loam Low >200 <2 1 2 Check dam <15 Sandy clay loam Low <1000 >25 1-4 3 Percolation pond <10 Silt loam Clay loam High <1000 >25 1-4 4 Contour Bunding <6 clay loam and sandy loam High <1000 >40 - 5 Trenching 10-25 Sandy clay, clay loam and sandy loam High - - 6 Terracing 20-30 Sandy clay, clay loam and sandy loam Low 200- 1000 - - DECISION RULES FOR WATER CONSERVATION MEASURES :
  • 24.
    "Check-dams" are smallbarriers built across the direction of water flow on shallow rivers and streams for the purpose of water harvesting. STONE CHECK DAM CONCRETE CHECK DAM Types of check dam :- EARTHEN CHECKDAMS:(EMBANKMENTS)  MADE OF EARTH & CLAY  SUITABLE FOR SHALLOW STREAMS WITH MINIMAL FLOW & LOW GREDIENT  UNABLE TO WITHSTAND OVERFLOW CONDITION STONE /R.C.C. CHECK DAMS  LARGER STREAM FLOW  ALLOWING OVER FLOW EARTHEN CHECKDAMS:(EMBANKMENTS) DESIGN OF CHECK DAM
  • 25.
    SALIENT POINTS FORDESIGN AND CONSTRUCTION OF CHECK DAMS :-  NEED AND SITE LOCATION • Design Map of the area Estimation of catchment area Rainfall analysis – Plan and cross section – Yield at the site – High flood Estimation • Estimates Detailed quantities Men and material
  • 26.
    DESIGN OF PERCOLATIONTANK  Percolation tank is an artificially created surface water body, submerging in its reservoir a highly permeable land so that surface runoff is made to percolate and recharge the ground water storage.  Percolation tank should be constructed preferably on second to third order streams, located on highly fractured and weathered rocks, which have lateral continuity downstream.
  • 27.
    Capacity of thepercolation tank has to be calculated on the basis of the rainfall and catchment area of the tank. Also the weir length (surplus weir) has to be calculated. The procedure is as follows:  Select the site for the percolation tank.  From the toposheet, find out the correct catchment area of the watershed at that location.  Compute catchment yield from rainfall and runoff coefficient or Strange's table (using monsoon rainfall; nature of catchment - good, average or bad; and catchment area).  Make suitable assumptions - such as number of fillings per year (say 2), utilization of yield per filling (say 5%) etc. Compute capacity of percolation tank (based-upon utilization of yield per filling).  Development of stage-capacity curve/table: Draw the contour lines at every 50 cm interval between the bed level and the highest ground level at the site. From these contour lines, the capacity of the tank at 0.5 m, 1.0 m, 1.5 m, 2.0 m, …. height above the bed level is calculated.  Compute full tank level (FTL) from stage-capacity curve/table.
  • 28.
     Guidelines forselection of sites for percolation tanks  Site should be upper reaches of streams preferably through wasteland Saucer shaped  There should be existing wells 2 wells per sq.km Area should be there for irrigation and a soil cover of 25 cm Aquifer should be weathered and fractured Design criteria  Dependability of rainfall < 300 mm 40% 380- 760 50 % 760 And above 65 % Absence of gauged values, adopt strange tables Only 20 % available yield should be considered for design. Guidelines for selection of sites for percolation tanks:-