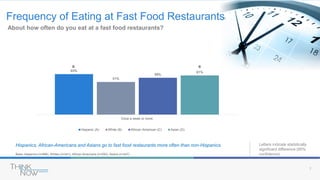
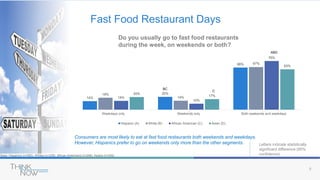
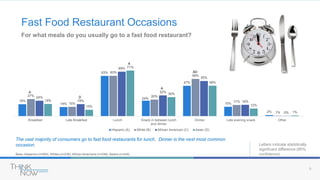
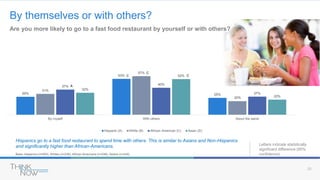
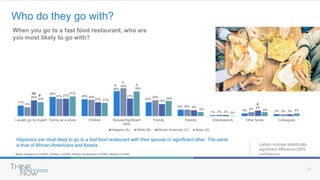
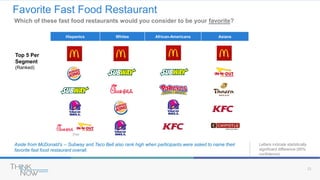
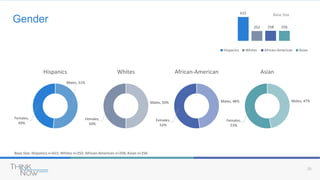
Fast Food
Report 2016
Restaurants
Methodology
3
Online Survey Via ThinkNow Research’s Omnibus Study
Sample Size
Nationwide, April 2016
615
Hispanics
256
Asian
252
White
258
African-American
Self identify
as Hispanic
origin
Hispanics Non-Hispanics Age
Self identify as White,
African-American or Asian
18 -64 years
of age
Screening Criteria
Spanish
dominant
35%
Bilingual
35% English
dominant
30%
4
Who We Are
An authority on creating
and managing research
products that help clients
gather insights about
rapidly changing consumer
segments.
Conduct online, in-person
and telephone research.
Research experience
specifically in the Hispanic,
African American, Asian and
Total markets.
Experience in hard-to reach
demographic sub-groups.
Only full-service market
research company that
owns & operates an in-
house Hispanic panel.
Servicing Fortune 500
clients, ad agencies, non-
profits and other market
research companies.
5
Our Services
QUANTITATIVE
QUALITATIVE
MIXED MODE
ONLINE MARKET
RESEARCH
COMMUNITIES
CONCEPT AND
COPY TESTING
ADVERTISING
EFFECTIVENESS
ONLINE PANEL
BUILDING
WEBSITE
USABILITY
STUDIES
OMNIBUS
SURVEYS
ATTITUDES &
USAGE
BRAND
TRACKING
PRODUCT
TESTING
ONLINE &
OFFLINE
QUALITATIVE
ONLINE
PANEL
INTERCEPTS PHONE
Survey
Results
7
Base: Hispanics (n=586), Whites (n=241), African Americans (n=250), Asians (n=247)
About how often do you eat at a fast food restaurants?
Hispanics, African-Americans and Asians go to fast food restaurants more often than non-Hispanics.
63%
51%
58%
61%
Once a week or more
Hispanic (A) White (B) African American (C) Asian (D)
Letters indicate statistically
significant difference (95%
confidence)
Frequency of Eating at Fast Food Restaurants
B B
8
14%
20%
66%
19%
14%
67%
14%
10%
76%
20%
17%
63%
Weekdays only Weekends only Both weekends and weekdays
Hispanic (A) White (B) African American (C) Asian (D)
BC
C
ABD
Letters indicate statistically
significant difference (95%
confidence)
Fast Food Restaurant Days
Do you usually go to fast food restaurants
during the week, on weekends or both?
Base: Hispanics (n=583), Whites (n=238), African Americans (n=248), Asians (n=245)
Consumers are most likely to eat at fast food restaurants both weekends and weekdays.
However, Hispanics prefer to go on weekends only more than the other segments.
9
Base: Hispanics (n=583), Whites (n=238), African Americans (n=248), Asians (n=245)
The vast majority of consumers go to fast food restaurants for lunch. Dinner is the next most common
occasion.
19%
14%
63%
24%
47%
15%
2%
27%
15%
63%
26%
58%
17%
1%
24%
19%
69%
32%
55%
18%
0%
19%
10%
71%
30%
48%
12%
1%
Breakfast Late Breakfast Lunch Snack in between lunch
and dinner
Dinner Late evening snack Other
Hispanic (A) White (B) African American (C) Asian (D)
Letters indicate statistically
significant difference (95%
confidence)
A
D
A
A
AD
For what meals do you usually go to a fast food restaurant?
Fast Food Restaurant Occasions
10
Base: Hispanics (n=583), Whites (n=238), African Americans (n=248), Asians (n=245)
By themselves or with others?
Hispanics go to a fast food restaurant to spend time with others. This is similar to Asians and Non-Hispanics
and significantly higher than African-Americans.
26%
53%
25%
31%
57%
20%
37%
40%
27%
32%
52%
22%
By myself With others About the same
Hispanic (A) White (B) African American (C) Asian (D)
Letters indicate statistically
significant difference (95%
confidence)
A
C
C
C
Are you more likely to go to a fast food restaurant by yourself or with others?
11
Base: Hispanics (n=583), Whites (n=238), African Americans (n=248), Asians (n=245)
Who do they go with?
When you go to a fast food restaurant, who are
you most likely to go with?
Hispanics are most likely to go to a fast food restaurant with their spouse or significant other. The same
is true of African-Americans and Asians.
17%
30%
26%
39%
22%
10%
1%
4% 3%
14%
27% 26%
44%
25%
10%
2%
6%
3%
25%
27%
22%
27%
19%
9%
2%
9%
3%
22%
31%
21%
39%
24%
6%
0%
6% 4%
I usually go by myself Family as a whole Children Spouse/Significant
other
Friends Parents Grandparents Other family Colleagues
Hispanic (A) White (B) African American (C) Asian (D)
Letters indicate statistically
significant difference (95%
confidence)
AB
B
C
C
C
A
12
$29.0
$8.9
$27.8
$8.0
$24.9
$8.5
$26.1
$8.7
With others By myself
Hispanic (A) White (B) African American (C) Asian (D)
Base: Hispanics (n=583), Whites (n=238), African Americans (n=248), Asians (n=245)
Hispanics spend the most at fast food restaurants. They average $29 when they go with others and $9 when
they go by themselves. Letters indicate statistically
significant difference (95%
confidence)
Mean Spent at Fast Food Restaurants
Approximately, about how much do you usually spend at a fast food
restaurant when you go by yourself / with others?
B
B
13
Fast Food Restaurants Visited in P6M
Which of the following fast food restaurants have you been to in the past 6 months?
Letters indicate statistically
significant difference (95%
confidence)
McDonald’s is the leading fast food restaurant among all segments – Hispanics and African-Americans, in
particular.
Hispanics
(A)
Whites
(B)
African-
American (C)
Asian
(D)
Base Size n=615 n=252 n=258 n=256
McDonald’s 65% 59% 66% 58%
Subway 50% 45% 52% 51%
Burger King 44% 40% 50% B 42%
Taco Bell 39% 41% 41% 35%
KFC 36% 31% 40% B 41% B
Wendy’s 35% 33% 46% ABD 31%
Pizza Hut 34% 29% 37% 34%
Starbuck’s 33% C 28% 21% 49% ABC
Domino’s Pizza 32% B 24% 29% 26%
Jack in the Box 27% BCD 15% 12% 21% C
Dunkin Donuts 22% 26% 24% 28%
Panda Express 22% BC 13% 12% 31% ABC
Chipotle 20% BC 12% 12% 29% ABC
Chic-Fil-A 19% 22% 23% 22%
Hispanics
(A)
Whites
(B)
African-
American (C)
Asian
(D)
Base Size n=615 n=252 n=258 n=256
In-N-Out 19% BC 10% 6% 24% BC
Panera 19% C 22% C 12% 29% AC
Sonic 19% D 20% D 22% D 10%
Carl’s Jr. 17% BC 11% C 6% 13% C
Popeye’s Louisiana Kitchen 17% 14% 35% ABD 20%
El Pollo Loco 14% BC 7% C 2% 11% C
Del Taco 12% BCD 5% 6% 6%
Arby’s 10% 27% ACD 16% A 13%
Long John Silver’s 8% 9% 8% 5%
Quizno’s 6% 7% 5% 5%
White Castle 5% 9% D 10% AD 4%
Hardee’s 4% 11% AD 15% AD 3%
Weinerschnitzel 4% C 2% 1% 3%
14
Fast Food Restaurants Visited Most Often
Which of these fast food restaurants do you eat at most often?
Letters indicate statistically
significant difference (95%
confidence)
McDonald’s is the most frequented restaurant among all segments. Subway and Burger King share the number
two spot among Hispanics.
Hispanics
(A)
Whites
(B)
African-
American (C)
Asian
(D)
Base Size n=578 n=237 n=247 n=244
McDonald’s 24% 21% 25% 20%
Subway 10% 9% 11% 7%
Burger King 10% D 8% 8% 6%
Taco Bell 7% D 4% 5% D 1%
Chic-Fil-A 5% 4% 5% 5%
Jack in the Box 5% CD 2% 1% 0%
Wendy’s 4% 5% 8% D 3%
Chipotle 4% B 1% 2% 7% BC
KFC 3% 4% 5% 8% AB
Domino’s Pizza 3% 3% 3% 1%
In-N-Out 3% C 2% 1% 6% BC
Dunkin Donuts 2% 5% A 2% 5%
Pizza Hut 2% 5% 2% 2%
Panera 2% 4% 2% 6% AC
Hispanics
(A)
Whites
(B)
African-
American (C)
Asian
(D)
Base Size n=578 n=237 n=247 n=244
Starbuck’s 2% 3% 2% 7% AC
Sonic 2% 2% 1% na
Carl’s Jr. 2% 2% 0% 3%
Popeye’s Louisiana Kitchen 2% 1% 6% ABD 2%
El Pollo Loco 2% C 1% 0% 1%
Panda Express 1% 2% 2% 2%
Del Taco 1% na 1% 0%
Hardee’s 0% 1% 2% 1%
Arby’s 0% 2% 1% 1%
White Castle 0% na 2% na
Long John Silver’s 0% 1% na 1%
Quizno’s 0% 1% na na
Weinerschnitzel 0% na na na
Pei Wei na 1% 0% 1%
15
Favorite Fast Food Restaurant
Which of these fast food restaurants would you consider to be your favorite?
Letters indicate statistically
significant difference (95%
confidence)
Hispanics Whites African-Americans Asians
Aside from McDonald’s -- Subway and Taco Bell also rank high when participants were asked to name their
favorite fast food restaurant overall.
(Tie)
Top 5 Per
Segment
(Ranked)
16
Most Important Factors When Choosing Fast Food Restaurants
When it comes to choosing a fast food restaurant to go to, what would you say are the three (3) most
important factors?
Letters indicate statistically
significant difference (95%
confidence)
All segments agree that great tasting food is the most important factor in a fast food restaurant,
followed by low prices and good value
Top 3 Factors
Hispanics
(A)
Whites
(B)
African-
American (C)
Asian
(D)
Has great tasting food 52% 59% D 56% 49%
Has low prices 48% B 35% 49% B 42%
Provides a good value 33% 39% C 27% 36%
Is convenient/Close to home and/or work 23% 24% 21% 28%
Offers quality food 21% 22% 21% 20%
Uses fresh products 16% 23% A 19% 19%
Is healthier than other fast food restaurants 15% 14% 16% 19%
Has clean/nice-looking restaurants 15% B 10% 14% 10%
My children like it 14% 12% 14% 10%
Can be in and out quickly 12% 13% 14% 20% A
Has a great menu/many items to choose from 11% 13% 15% 11%
Has great service 11% 6% 9% 10%
Has drive-thru service 7% 10% C 5% 7%
Has at least one item that I love 7% C 6% 4% 6%
Has great specials 6% 6% 8% D 3%
Has a nice, family atmosphere 4% 3% 4% 3%
Makes me feel welcome 3% 3% 3% 5%
Has a good children’s menu 3% B 1% 2% 1%
17
Fast Food Restaurants best Described by Statements: Hispanics
Please select the restaurant or restaurants that you feel are best described by each of the statements below.
Note: Fast Food Restaurants
below base size 50 may not
be shown.
Hispanics conclude that McDonald’s rate highest in most of the fast food restaurant attributes.
Ranked by Importance (Hispanics)
Burger
King
Popeye’s
Louisiana
Kitchen KFC McDonald’s Pizza Hut Subway Taco Bell
Domino’s
Pizza Wendy’s
Base: Have visited fast food restaurant n=189 n=63 n=138 n=303 n=123 n=221 n=174 n=132 n=157
Has low prices 53% 50% 39% 73% 38% 49% 60% 40% 53%
Provides a good value 57% 48% 53% 54% 55% 56% 56% 53% 58%
Has great tasting food 55% 59% 66% 46% 63% 68% 55% 59% 56%
Is healthier than other fast food restaurants 21% 26% 25% 16% 9% 69% 18% 10% 31%
Uses fresh products 28% 29% 29% 28% 34% 71% 30% 35% 49%
Is convenient/Close to home and/or work 56% 46% 53% 68% 49% 61% 56% 49% 53%
Has clean/nice-looking restaurants 49% 53% 48% 49% 59% 61% 47% 44% 57%
My children like it 32% 27% 34% 53% 42% 34% 32% 37% 36%
Offers quality food 41% 42% 41% 41% 41% 66% 36% 42% 48%
Has a great menu/many items to choose from 49% 54% 47% 57% 48% 55% 58% 53% 51%
Has great service 47% 43% 51% 44% 55% 58% 47% 46% 49%
Makes me feel welcome 41% 51% 41% 43% 50% 57% 41% 43% 46%
Can be in and out quickly 59% 54% 53% 68% 44% 58% 57% 47% 59%
Has a nice, family atmosphere 43% 43% 44% 55% 50% 47% 42% 30% 47%
Has a good children’s menu 48% 31% 37% 60% 39% 39% 32% 35% 48%
Has at least one item that I love 62% 59% 60% 54% 60% 60% 53% 50% 55%
Has great specials 45% 44% 47% 56% 50% 49% 44% 42% 54%
Has drive-thru service 68% 57% 57% 73% 31% 34% 65% 24% 57%
Top rated restaurant per attribute
Continued
on next
slide
18
Fast Food Restaurants best Described by Statements: Hispanic
Note: Fast Food Restaurants
below base size 50 may not
be shown.
Chic Fil A provides a good value and has great tasting food, as does Chipotle.
Ranked by Importance (Hispanic) Carl’s Jr. Chic Fil A Chipotle
Dunkin’
Donuts In N Out
Jack in the
Box
Panda
Express Panera Sonic Starbucks
Base: Have visited fast food restaurant n=64 n=87 n=78 n=104 n=77 n=91 n=77 n=71 n=74 n=126
Has low prices 37% 30% 33% 45% 39% 62% 29% 25% 40% 13%
Provides a good value 60% 73% 61% 38% 69% 51% 50% 53% 49% 37%
Has great tasting food 66% 76% 76% 44% 61% 53% 64% 66% 50% 51%
Is healthier than other fast food restaurants 23% 45% 58% 18% 29% 20% 31% 61% 19% 24%
Uses fresh products 47% 43% 73% 27% 60% 21% 31% 72% 29% 34%
Is convenient/Close to home and/or work 56% 38% 39% 49% 54% 64% 44% 33% 48% 57%
Has clean/nice-looking restaurants 65% 66% 64% 48% 52% 51% 61% 71% 48% 66%
My children like it 50% 41% 33% 35% 37% 34% 38% 23% 38% 20%
Offers quality food 49% 64% 65% 32% 56% 44% 47% 60% 45% 37%
Has a great menu/many items to choose from 71% 51% 53% 35% 42% 60% 61% 68% 54% 39%
Has great service 55% 54% 53% 49% 57% 52% 56% 67% 47% 54%
Makes me feel welcome 52% 58% 50% 43% 62% 47% 45% 60% 43% 54%
Can be in and out quickly 60% 54% 28% 54% 51% 55% 52% 31% 57% 41%
Has a nice, family atmosphere 48% 65% 46% 43% 56% 43% 53% 59% 40% 37%
Has a good children’s menu 47% 41% 27% 22% 33% 38% 26% 27% 35% 18%
Has at least one item that I love 62% 65% 53% 51% 60% 65% 62% 56% 64% 55%
Has great specials 50% 35% 26% 42% 33% 47% 28% 33% 42% 31%
Has drive-thru service 71% 70% 13% 44% 65% 69% 45% 18% 74% 56%
Top rated restaurant per attribute
Please select the restaurant or restaurants that you feel are best described by each of the statements below.
Demographics
20
Gender
Base Size: Hispanics n=615, Whites n=252, African-American n=258, Asian n=256
Males, 51%
Females,
49%
Hispanics
Males, 50%
Females,
50%
Whites
Males, 48%
Females,
52%
African-American
Males, 47%
Females,
53%
Asian
615
252 258 256
Hispanics Whites African-American Asian
Base Size
21
Age
Base Size: Hispanics n=615, Whites n=252, African-American n=258, Asian n=256
18-34, 46%
35-64, 54%
Hispanics
18-34, 34%
35-64, 66%
Whites
18-34, 41%
35-64, 59%
African-American
18-34, 39%
35-64, 61%
Asian
37
41.8
39.4 39
Hispanics Whites African-American Asian
Mean Age
22
Demographic
Base Size: Hispanics n=615, Whites n=252, African-American n=258, Asian n=256
62% 60%
51%
70%
Employed
Hispanics Whites African-American Asian
29%
35%
21%
61%
College Graduate or More
Hispanics Whites African-American Asian
$42K
$63K
$34K
$77K
Median Household Income
Hispanics Whites African-American Asian
23
Demographic Profile, Hispanics
Spanish-
Dominant,
35%
Bilingual,
35%
English-
Dominant,
29%
Home Language Use
n=615
Less
Acculturated
, 16%
Bicultural,
54%
More
Acculturated
, 30%
Acculturation Level
Mexican
Origin, 64%
Puerto Rican,
12%
South
American,
10%
Central
American,
6%
Dominican,
5%
Cuban, 5% Other, 3%
Country or Origin

Fast Food Restaurants Report 2016

  • 1.
  • 2.
  • 3.
    3 Online Survey ViaThinkNow Research’s Omnibus Study Sample Size Nationwide, April 2016 615 Hispanics 256 Asian 252 White 258 African-American Self identify as Hispanic origin Hispanics Non-Hispanics Age Self identify as White, African-American or Asian 18 -64 years of age Screening Criteria Spanish dominant 35% Bilingual 35% English dominant 30%
  • 4.
    4 Who We Are Anauthority on creating and managing research products that help clients gather insights about rapidly changing consumer segments. Conduct online, in-person and telephone research. Research experience specifically in the Hispanic, African American, Asian and Total markets. Experience in hard-to reach demographic sub-groups. Only full-service market research company that owns & operates an in- house Hispanic panel. Servicing Fortune 500 clients, ad agencies, non- profits and other market research companies.
  • 5.
    5 Our Services QUANTITATIVE QUALITATIVE MIXED MODE ONLINEMARKET RESEARCH COMMUNITIES CONCEPT AND COPY TESTING ADVERTISING EFFECTIVENESS ONLINE PANEL BUILDING WEBSITE USABILITY STUDIES OMNIBUS SURVEYS ATTITUDES & USAGE BRAND TRACKING PRODUCT TESTING ONLINE & OFFLINE QUALITATIVE ONLINE PANEL INTERCEPTS PHONE
  • 6.
  • 7.
    7 Base: Hispanics (n=586),Whites (n=241), African Americans (n=250), Asians (n=247) About how often do you eat at a fast food restaurants? Hispanics, African-Americans and Asians go to fast food restaurants more often than non-Hispanics. 63% 51% 58% 61% Once a week or more Hispanic (A) White (B) African American (C) Asian (D) Letters indicate statistically significant difference (95% confidence) Frequency of Eating at Fast Food Restaurants B B
  • 8.
    8 14% 20% 66% 19% 14% 67% 14% 10% 76% 20% 17% 63% Weekdays only Weekendsonly Both weekends and weekdays Hispanic (A) White (B) African American (C) Asian (D) BC C ABD Letters indicate statistically significant difference (95% confidence) Fast Food Restaurant Days Do you usually go to fast food restaurants during the week, on weekends or both? Base: Hispanics (n=583), Whites (n=238), African Americans (n=248), Asians (n=245) Consumers are most likely to eat at fast food restaurants both weekends and weekdays. However, Hispanics prefer to go on weekends only more than the other segments.
  • 9.
    9 Base: Hispanics (n=583),Whites (n=238), African Americans (n=248), Asians (n=245) The vast majority of consumers go to fast food restaurants for lunch. Dinner is the next most common occasion. 19% 14% 63% 24% 47% 15% 2% 27% 15% 63% 26% 58% 17% 1% 24% 19% 69% 32% 55% 18% 0% 19% 10% 71% 30% 48% 12% 1% Breakfast Late Breakfast Lunch Snack in between lunch and dinner Dinner Late evening snack Other Hispanic (A) White (B) African American (C) Asian (D) Letters indicate statistically significant difference (95% confidence) A D A A AD For what meals do you usually go to a fast food restaurant? Fast Food Restaurant Occasions
  • 10.
    10 Base: Hispanics (n=583),Whites (n=238), African Americans (n=248), Asians (n=245) By themselves or with others? Hispanics go to a fast food restaurant to spend time with others. This is similar to Asians and Non-Hispanics and significantly higher than African-Americans. 26% 53% 25% 31% 57% 20% 37% 40% 27% 32% 52% 22% By myself With others About the same Hispanic (A) White (B) African American (C) Asian (D) Letters indicate statistically significant difference (95% confidence) A C C C Are you more likely to go to a fast food restaurant by yourself or with others?
  • 11.
    11 Base: Hispanics (n=583),Whites (n=238), African Americans (n=248), Asians (n=245) Who do they go with? When you go to a fast food restaurant, who are you most likely to go with? Hispanics are most likely to go to a fast food restaurant with their spouse or significant other. The same is true of African-Americans and Asians. 17% 30% 26% 39% 22% 10% 1% 4% 3% 14% 27% 26% 44% 25% 10% 2% 6% 3% 25% 27% 22% 27% 19% 9% 2% 9% 3% 22% 31% 21% 39% 24% 6% 0% 6% 4% I usually go by myself Family as a whole Children Spouse/Significant other Friends Parents Grandparents Other family Colleagues Hispanic (A) White (B) African American (C) Asian (D) Letters indicate statistically significant difference (95% confidence) AB B C C C A
  • 12.
    12 $29.0 $8.9 $27.8 $8.0 $24.9 $8.5 $26.1 $8.7 With others Bymyself Hispanic (A) White (B) African American (C) Asian (D) Base: Hispanics (n=583), Whites (n=238), African Americans (n=248), Asians (n=245) Hispanics spend the most at fast food restaurants. They average $29 when they go with others and $9 when they go by themselves. Letters indicate statistically significant difference (95% confidence) Mean Spent at Fast Food Restaurants Approximately, about how much do you usually spend at a fast food restaurant when you go by yourself / with others? B B
  • 13.
    13 Fast Food RestaurantsVisited in P6M Which of the following fast food restaurants have you been to in the past 6 months? Letters indicate statistically significant difference (95% confidence) McDonald’s is the leading fast food restaurant among all segments – Hispanics and African-Americans, in particular. Hispanics (A) Whites (B) African- American (C) Asian (D) Base Size n=615 n=252 n=258 n=256 McDonald’s 65% 59% 66% 58% Subway 50% 45% 52% 51% Burger King 44% 40% 50% B 42% Taco Bell 39% 41% 41% 35% KFC 36% 31% 40% B 41% B Wendy’s 35% 33% 46% ABD 31% Pizza Hut 34% 29% 37% 34% Starbuck’s 33% C 28% 21% 49% ABC Domino’s Pizza 32% B 24% 29% 26% Jack in the Box 27% BCD 15% 12% 21% C Dunkin Donuts 22% 26% 24% 28% Panda Express 22% BC 13% 12% 31% ABC Chipotle 20% BC 12% 12% 29% ABC Chic-Fil-A 19% 22% 23% 22% Hispanics (A) Whites (B) African- American (C) Asian (D) Base Size n=615 n=252 n=258 n=256 In-N-Out 19% BC 10% 6% 24% BC Panera 19% C 22% C 12% 29% AC Sonic 19% D 20% D 22% D 10% Carl’s Jr. 17% BC 11% C 6% 13% C Popeye’s Louisiana Kitchen 17% 14% 35% ABD 20% El Pollo Loco 14% BC 7% C 2% 11% C Del Taco 12% BCD 5% 6% 6% Arby’s 10% 27% ACD 16% A 13% Long John Silver’s 8% 9% 8% 5% Quizno’s 6% 7% 5% 5% White Castle 5% 9% D 10% AD 4% Hardee’s 4% 11% AD 15% AD 3% Weinerschnitzel 4% C 2% 1% 3%
  • 14.
    14 Fast Food RestaurantsVisited Most Often Which of these fast food restaurants do you eat at most often? Letters indicate statistically significant difference (95% confidence) McDonald’s is the most frequented restaurant among all segments. Subway and Burger King share the number two spot among Hispanics. Hispanics (A) Whites (B) African- American (C) Asian (D) Base Size n=578 n=237 n=247 n=244 McDonald’s 24% 21% 25% 20% Subway 10% 9% 11% 7% Burger King 10% D 8% 8% 6% Taco Bell 7% D 4% 5% D 1% Chic-Fil-A 5% 4% 5% 5% Jack in the Box 5% CD 2% 1% 0% Wendy’s 4% 5% 8% D 3% Chipotle 4% B 1% 2% 7% BC KFC 3% 4% 5% 8% AB Domino’s Pizza 3% 3% 3% 1% In-N-Out 3% C 2% 1% 6% BC Dunkin Donuts 2% 5% A 2% 5% Pizza Hut 2% 5% 2% 2% Panera 2% 4% 2% 6% AC Hispanics (A) Whites (B) African- American (C) Asian (D) Base Size n=578 n=237 n=247 n=244 Starbuck’s 2% 3% 2% 7% AC Sonic 2% 2% 1% na Carl’s Jr. 2% 2% 0% 3% Popeye’s Louisiana Kitchen 2% 1% 6% ABD 2% El Pollo Loco 2% C 1% 0% 1% Panda Express 1% 2% 2% 2% Del Taco 1% na 1% 0% Hardee’s 0% 1% 2% 1% Arby’s 0% 2% 1% 1% White Castle 0% na 2% na Long John Silver’s 0% 1% na 1% Quizno’s 0% 1% na na Weinerschnitzel 0% na na na Pei Wei na 1% 0% 1%
  • 15.
    15 Favorite Fast FoodRestaurant Which of these fast food restaurants would you consider to be your favorite? Letters indicate statistically significant difference (95% confidence) Hispanics Whites African-Americans Asians Aside from McDonald’s -- Subway and Taco Bell also rank high when participants were asked to name their favorite fast food restaurant overall. (Tie) Top 5 Per Segment (Ranked)
  • 16.
    16 Most Important FactorsWhen Choosing Fast Food Restaurants When it comes to choosing a fast food restaurant to go to, what would you say are the three (3) most important factors? Letters indicate statistically significant difference (95% confidence) All segments agree that great tasting food is the most important factor in a fast food restaurant, followed by low prices and good value Top 3 Factors Hispanics (A) Whites (B) African- American (C) Asian (D) Has great tasting food 52% 59% D 56% 49% Has low prices 48% B 35% 49% B 42% Provides a good value 33% 39% C 27% 36% Is convenient/Close to home and/or work 23% 24% 21% 28% Offers quality food 21% 22% 21% 20% Uses fresh products 16% 23% A 19% 19% Is healthier than other fast food restaurants 15% 14% 16% 19% Has clean/nice-looking restaurants 15% B 10% 14% 10% My children like it 14% 12% 14% 10% Can be in and out quickly 12% 13% 14% 20% A Has a great menu/many items to choose from 11% 13% 15% 11% Has great service 11% 6% 9% 10% Has drive-thru service 7% 10% C 5% 7% Has at least one item that I love 7% C 6% 4% 6% Has great specials 6% 6% 8% D 3% Has a nice, family atmosphere 4% 3% 4% 3% Makes me feel welcome 3% 3% 3% 5% Has a good children’s menu 3% B 1% 2% 1%
  • 17.
    17 Fast Food Restaurantsbest Described by Statements: Hispanics Please select the restaurant or restaurants that you feel are best described by each of the statements below. Note: Fast Food Restaurants below base size 50 may not be shown. Hispanics conclude that McDonald’s rate highest in most of the fast food restaurant attributes. Ranked by Importance (Hispanics) Burger King Popeye’s Louisiana Kitchen KFC McDonald’s Pizza Hut Subway Taco Bell Domino’s Pizza Wendy’s Base: Have visited fast food restaurant n=189 n=63 n=138 n=303 n=123 n=221 n=174 n=132 n=157 Has low prices 53% 50% 39% 73% 38% 49% 60% 40% 53% Provides a good value 57% 48% 53% 54% 55% 56% 56% 53% 58% Has great tasting food 55% 59% 66% 46% 63% 68% 55% 59% 56% Is healthier than other fast food restaurants 21% 26% 25% 16% 9% 69% 18% 10% 31% Uses fresh products 28% 29% 29% 28% 34% 71% 30% 35% 49% Is convenient/Close to home and/or work 56% 46% 53% 68% 49% 61% 56% 49% 53% Has clean/nice-looking restaurants 49% 53% 48% 49% 59% 61% 47% 44% 57% My children like it 32% 27% 34% 53% 42% 34% 32% 37% 36% Offers quality food 41% 42% 41% 41% 41% 66% 36% 42% 48% Has a great menu/many items to choose from 49% 54% 47% 57% 48% 55% 58% 53% 51% Has great service 47% 43% 51% 44% 55% 58% 47% 46% 49% Makes me feel welcome 41% 51% 41% 43% 50% 57% 41% 43% 46% Can be in and out quickly 59% 54% 53% 68% 44% 58% 57% 47% 59% Has a nice, family atmosphere 43% 43% 44% 55% 50% 47% 42% 30% 47% Has a good children’s menu 48% 31% 37% 60% 39% 39% 32% 35% 48% Has at least one item that I love 62% 59% 60% 54% 60% 60% 53% 50% 55% Has great specials 45% 44% 47% 56% 50% 49% 44% 42% 54% Has drive-thru service 68% 57% 57% 73% 31% 34% 65% 24% 57% Top rated restaurant per attribute Continued on next slide
  • 18.
    18 Fast Food Restaurantsbest Described by Statements: Hispanic Note: Fast Food Restaurants below base size 50 may not be shown. Chic Fil A provides a good value and has great tasting food, as does Chipotle. Ranked by Importance (Hispanic) Carl’s Jr. Chic Fil A Chipotle Dunkin’ Donuts In N Out Jack in the Box Panda Express Panera Sonic Starbucks Base: Have visited fast food restaurant n=64 n=87 n=78 n=104 n=77 n=91 n=77 n=71 n=74 n=126 Has low prices 37% 30% 33% 45% 39% 62% 29% 25% 40% 13% Provides a good value 60% 73% 61% 38% 69% 51% 50% 53% 49% 37% Has great tasting food 66% 76% 76% 44% 61% 53% 64% 66% 50% 51% Is healthier than other fast food restaurants 23% 45% 58% 18% 29% 20% 31% 61% 19% 24% Uses fresh products 47% 43% 73% 27% 60% 21% 31% 72% 29% 34% Is convenient/Close to home and/or work 56% 38% 39% 49% 54% 64% 44% 33% 48% 57% Has clean/nice-looking restaurants 65% 66% 64% 48% 52% 51% 61% 71% 48% 66% My children like it 50% 41% 33% 35% 37% 34% 38% 23% 38% 20% Offers quality food 49% 64% 65% 32% 56% 44% 47% 60% 45% 37% Has a great menu/many items to choose from 71% 51% 53% 35% 42% 60% 61% 68% 54% 39% Has great service 55% 54% 53% 49% 57% 52% 56% 67% 47% 54% Makes me feel welcome 52% 58% 50% 43% 62% 47% 45% 60% 43% 54% Can be in and out quickly 60% 54% 28% 54% 51% 55% 52% 31% 57% 41% Has a nice, family atmosphere 48% 65% 46% 43% 56% 43% 53% 59% 40% 37% Has a good children’s menu 47% 41% 27% 22% 33% 38% 26% 27% 35% 18% Has at least one item that I love 62% 65% 53% 51% 60% 65% 62% 56% 64% 55% Has great specials 50% 35% 26% 42% 33% 47% 28% 33% 42% 31% Has drive-thru service 71% 70% 13% 44% 65% 69% 45% 18% 74% 56% Top rated restaurant per attribute Please select the restaurant or restaurants that you feel are best described by each of the statements below.
  • 19.
  • 20.
    20 Gender Base Size: Hispanicsn=615, Whites n=252, African-American n=258, Asian n=256 Males, 51% Females, 49% Hispanics Males, 50% Females, 50% Whites Males, 48% Females, 52% African-American Males, 47% Females, 53% Asian 615 252 258 256 Hispanics Whites African-American Asian Base Size
  • 21.
    21 Age Base Size: Hispanicsn=615, Whites n=252, African-American n=258, Asian n=256 18-34, 46% 35-64, 54% Hispanics 18-34, 34% 35-64, 66% Whites 18-34, 41% 35-64, 59% African-American 18-34, 39% 35-64, 61% Asian 37 41.8 39.4 39 Hispanics Whites African-American Asian Mean Age
  • 22.
    22 Demographic Base Size: Hispanicsn=615, Whites n=252, African-American n=258, Asian n=256 62% 60% 51% 70% Employed Hispanics Whites African-American Asian 29% 35% 21% 61% College Graduate or More Hispanics Whites African-American Asian $42K $63K $34K $77K Median Household Income Hispanics Whites African-American Asian
  • 23.
    23 Demographic Profile, Hispanics Spanish- Dominant, 35% Bilingual, 35% English- Dominant, 29% HomeLanguage Use n=615 Less Acculturated , 16% Bicultural, 54% More Acculturated , 30% Acculturation Level Mexican Origin, 64% Puerto Rican, 12% South American, 10% Central American, 6% Dominican, 5% Cuban, 5% Other, 3% Country or Origin