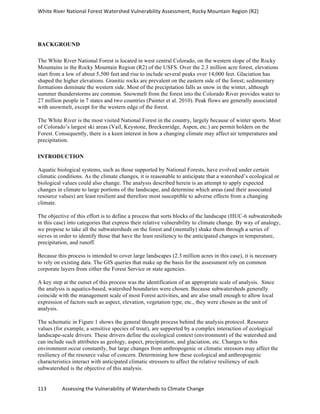
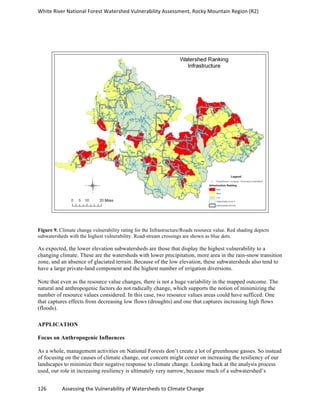
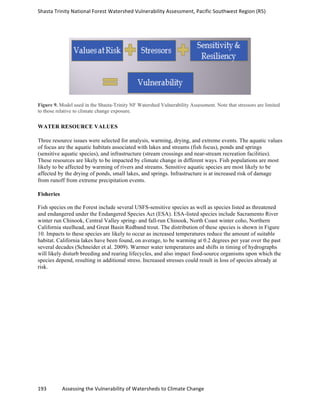
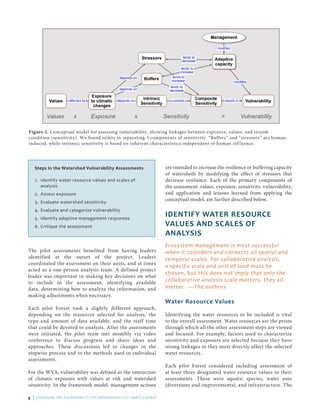
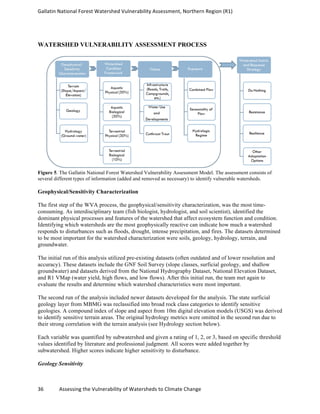
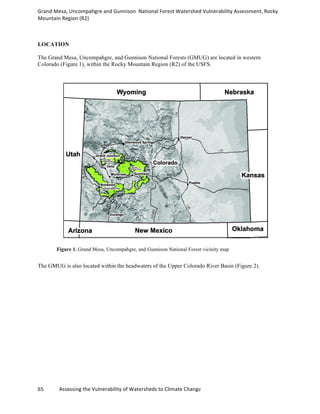
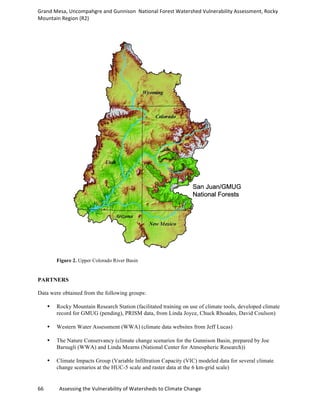
This document details the results of national forest watershed vulnerability pilot assessments conducted by eleven national forests in the U.S. to evaluate the impacts of climate change on water resources. It emphasizes the need to understand the varying vulnerabilities of different watersheds and provides recommendations for land managers to enhance watershed resilience in response to projected changes. The report aims to fill existing information gaps regarding vulnerability to climate change by offering a structured assessment framework for national forest managers.
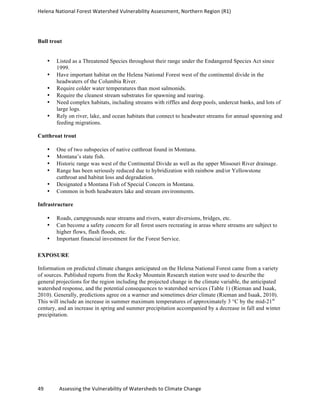


![Grand
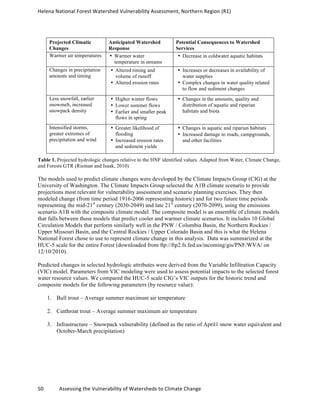
Mesa,
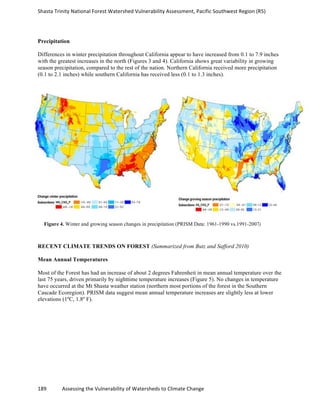
Uncompahgre
and
Gunnison
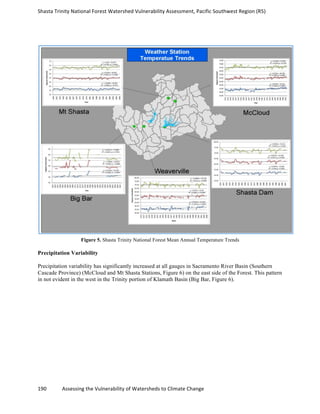
National
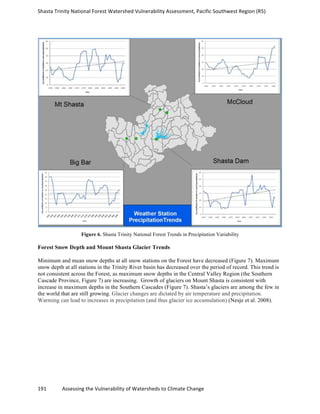
Forest
Watershed
Vulnerability
Assessment,
Rocky
Mountain
Region
(R2)
82
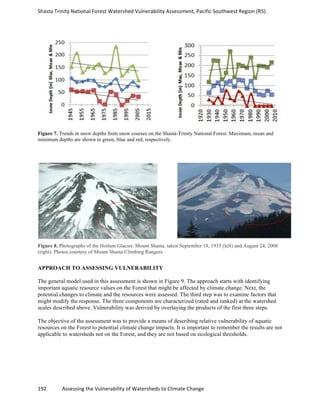
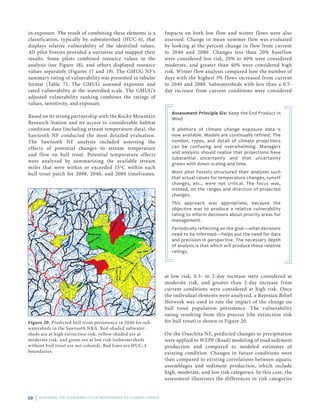
Assessing
the
Vulnerability
of
Watersheds
to
Climate
Change
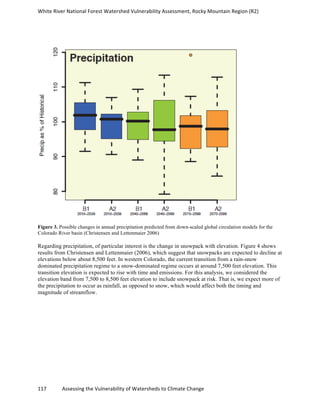
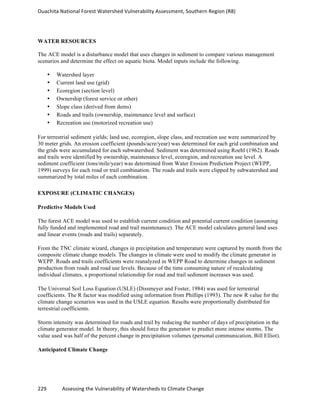
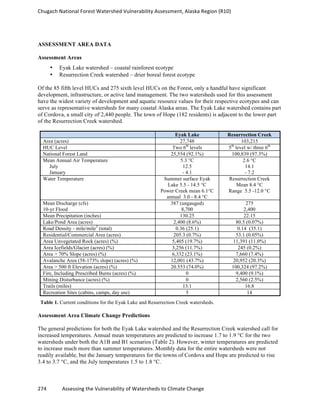
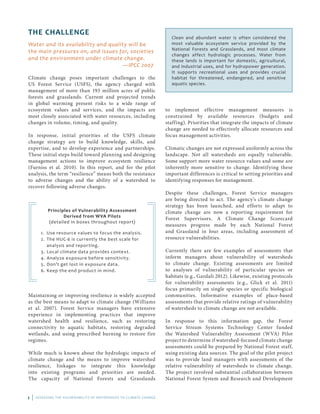
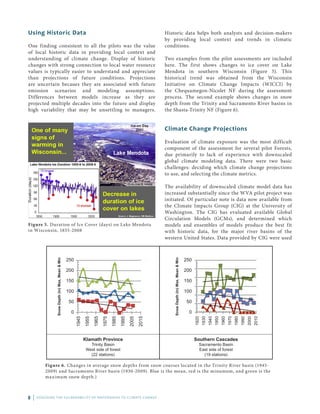
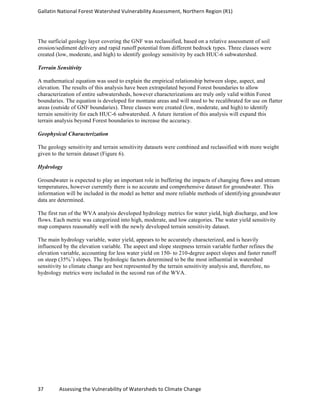
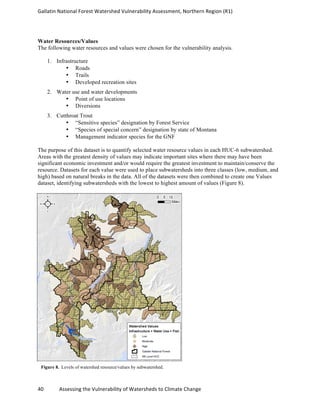
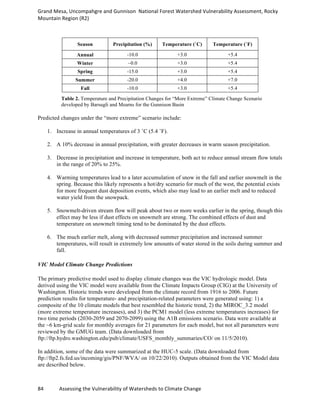
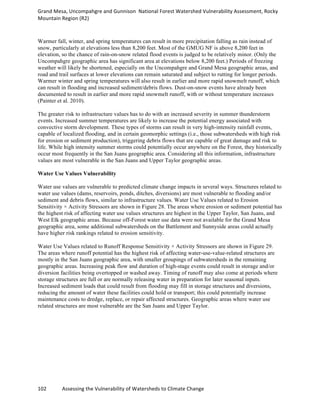
Climate change projections for the State of Colorado are summarized in “Climate Change in Colorado: A
Synthesis to Support Water Resources Management and Adaptation” (Ray et al. 2008) and include the
following projections.
1. In Colorado, temperatures have increased about 2 ˚F in the past 30 years. Climate models project
Colorado will continue to warm 2.5 ˚F [+1.5 to +3.5 ˚F] by 2025, relative to the 1950-99 baseline,
and 4 ˚F [+2.5 to +5.5 ˚F] by 2050. The 2050 projections show summers warming by +5 ˚F [+3 to
+7 ˚F], and winters by +3 ˚F [+2 to +5 ˚F].
2. Winter projections show fewer extreme cold months, more extreme warm months, and more
strings of consecutive warm winters.
3. In all seasons, the climate of the mountains is projected to migrate upward in elevation, and the
climate of the desert southwest is projected to progress up into the valleys of the Western Slope.
4. Variability in annual precipitation is high and no long-term trend in annual precipitation has been
detected for Colorado. Multi-model average projections show little change in future annual mean
precipitation, although seasonal shift in precipitation does emerge.
5. Dramatic declines in lower-elevation (< 8,200 ft) snowpack are projected, due to more winter
precipitation coming as rain than snow. Modest declines in snowpack are projected (10%-20%)
for Colorado’s high-elevations (> 8,200 ft) by 2050.
6. Between 1978 and 2004, the onset of spring runoff from melting snow has shifted earlier by two
weeks. By 2050, the timing of runoff is projected to shift earlier in the spring, and late-summer
flows may be reduced. These changes are projected to occur regardless of changes in
precipitation.
7. The Upper Colorado River Basin average runoff is projected to decrease as much as 20% by
2050, compared to the 20th
century average.
8. Increased storm intensity and variability are projected to elevate risks for floods and droughts.
9. Increasing temperature and soil moisture changes may shift mountain habitats higher in elevation.
Forest, rangeland, and riparian plant communities may change with more xeric, drought-tolerant
species becoming more abundant.
10. More extensive wildfire activity, especially at lower elevation/fire dominated ecosystems is
predicted.
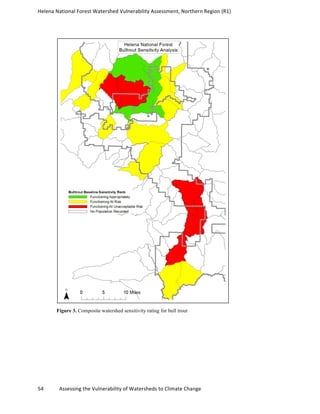
11. Decreased snowpack and earlier spring melt could diminish recharge of subsurface aquifers that
support late summer and winter baseflows.
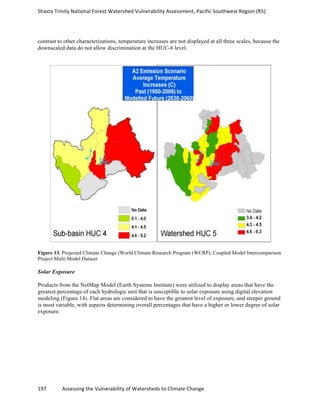
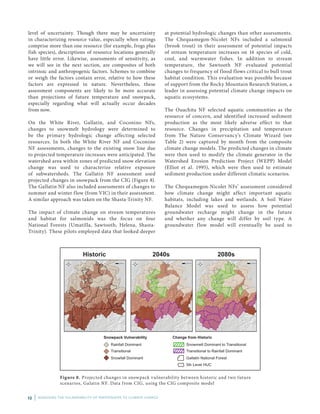
Downscaled Scenarios for Gunnison Basin for 2040-2060
Downscaled climate changes were also available for the GMUG. Barsugli and Mearns (Draft 2010)
developed two climate change scenarios for a Climate Change Adaptation Workshop for Natural
Resource Managers in the Gunnison Basin, facilitated by The Nature Conservancy. These scenarios were
specifically designed to represent a “moderate” and a “more extreme” scenario for the 2040-2060
timeframe. These scenarios were designed using the A2 emissions scenario because the world is already
on this scenario path. Two hydrologic change scenarios were developed in tandem with the climate
change scenarios, which produced quantitative estimates of how soil moisture, snowpack, and runoff
would change, consistent with the temperature and precipitation change scenarios. These hydrologic
scenarios were developed using the Sacramento Soil Moisture Accounting hydrology model, coupled to
the “Snow-17” snow model, developed by the NOAA.](https://image.slidesharecdn.com/pilotnfwatershedvulnerabilityreport-130610134954-phpapp01/85/Assessing-the-Vulnerability-of-Watersheds-to-Climate-Change-86-320.jpg)

![Grand
Mesa,
Uncompahgre
and
Gunnison
National
Forest
Watershed
Vulnerability
Assessment,
Rocky
Mountain
Region
(R2)
99
Assessing
the
Vulnerability
of
Watersheds
to
Climate
Change
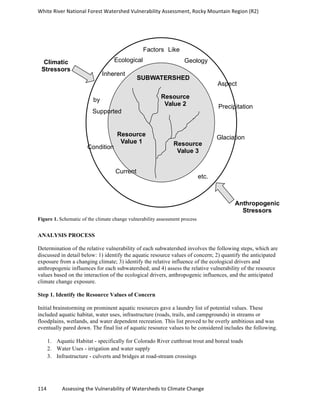
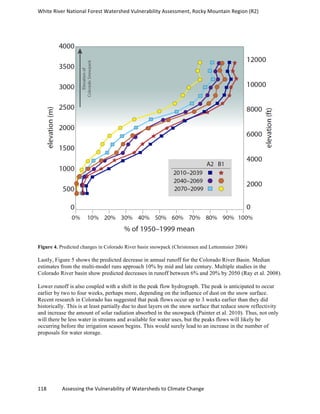
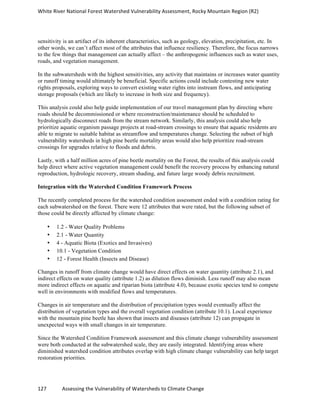
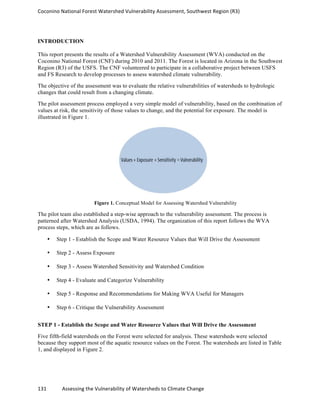
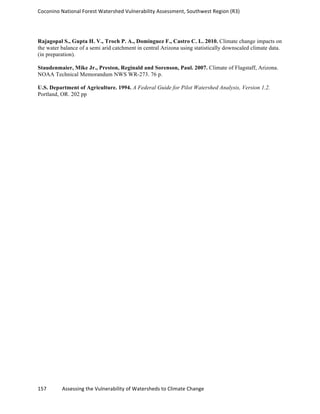
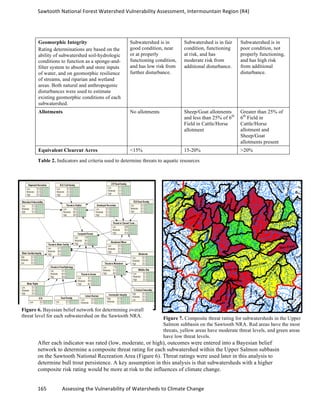
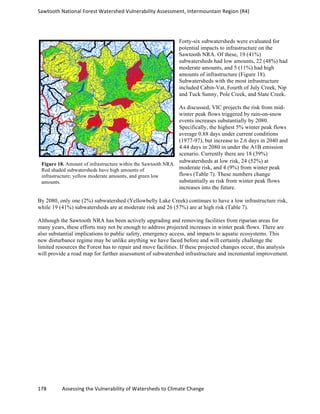
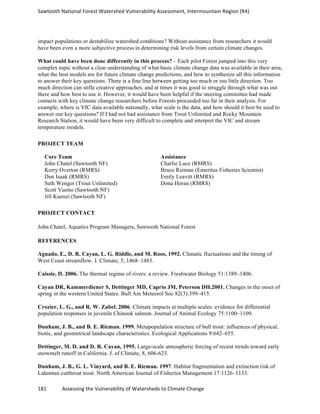
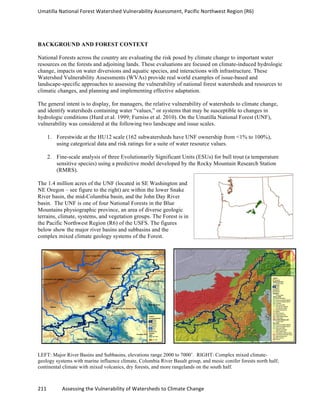
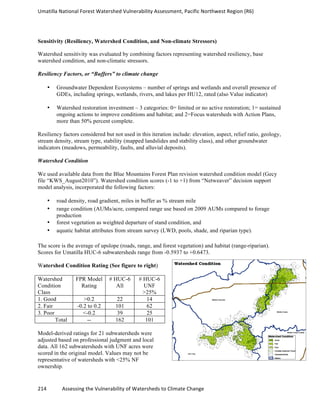
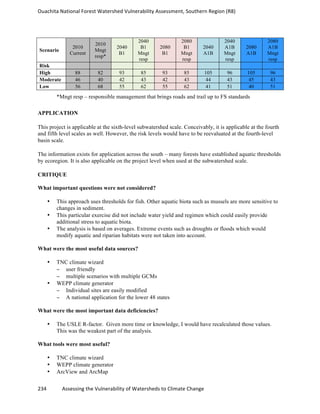
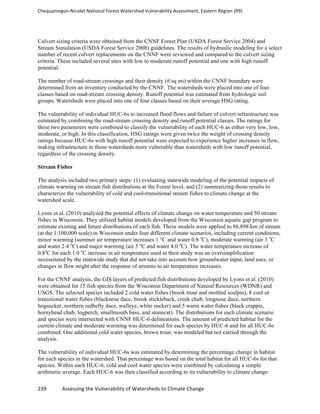
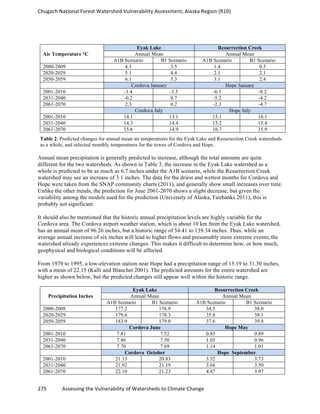
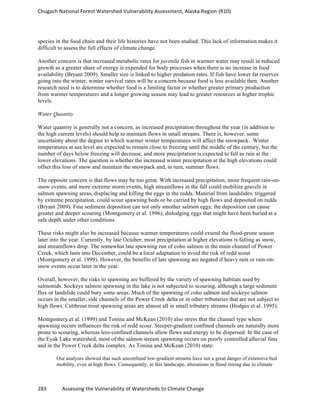
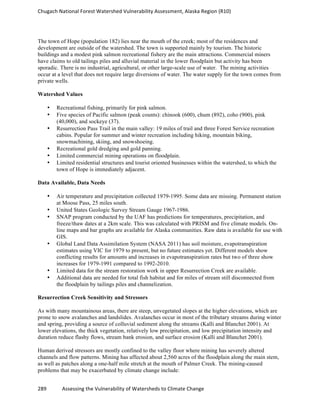
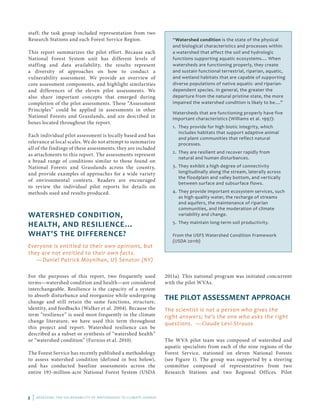
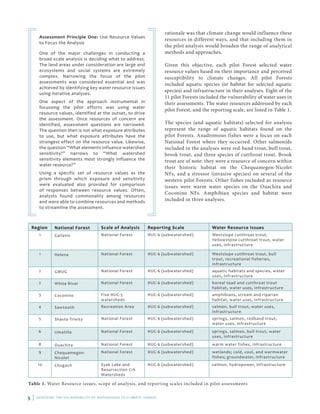
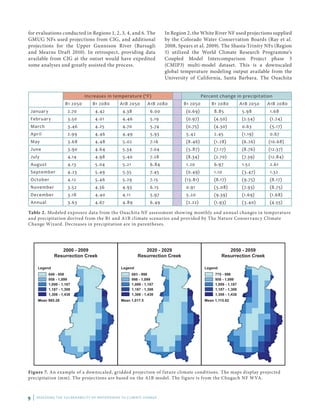
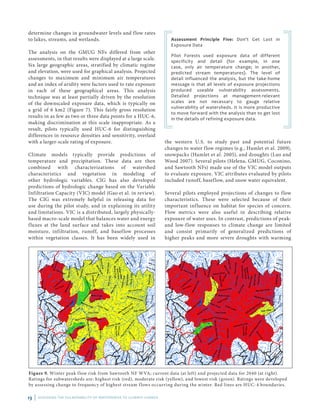
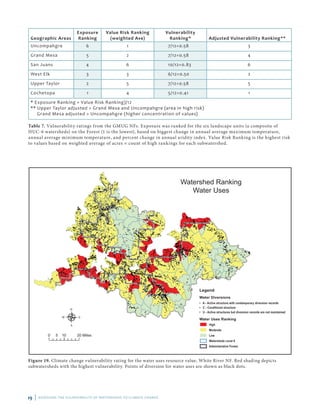
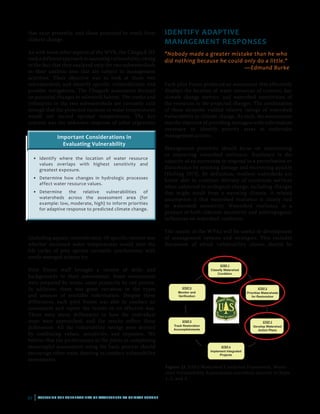
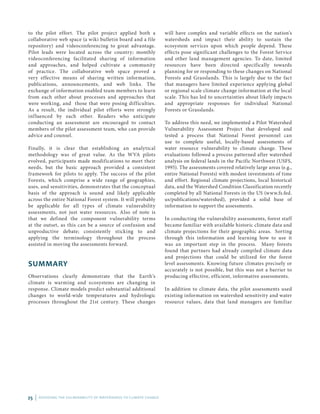
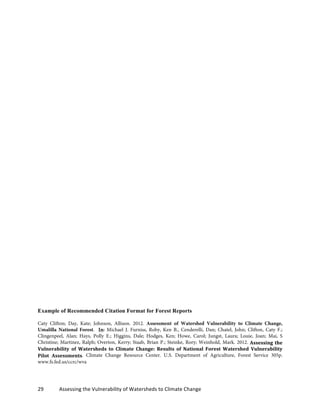
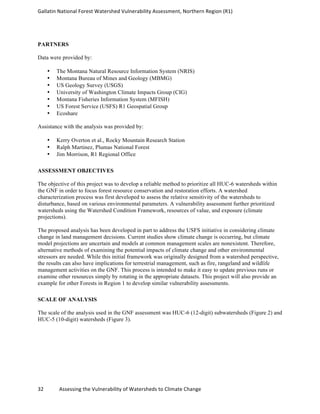
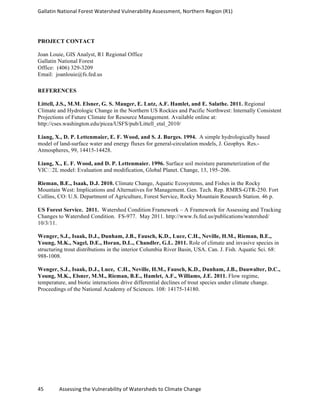
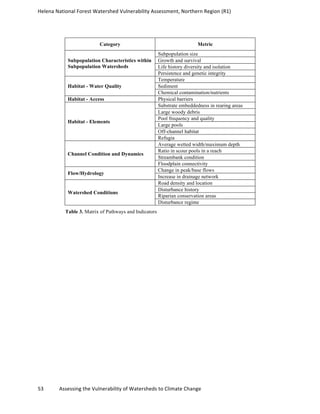
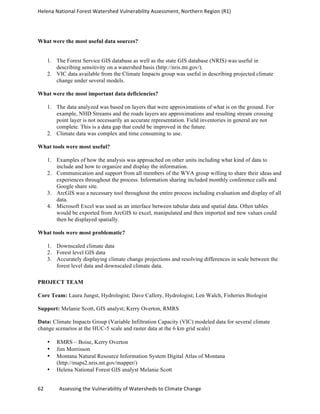
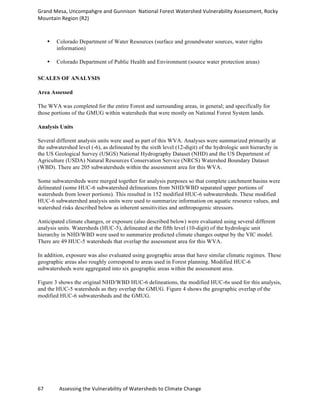
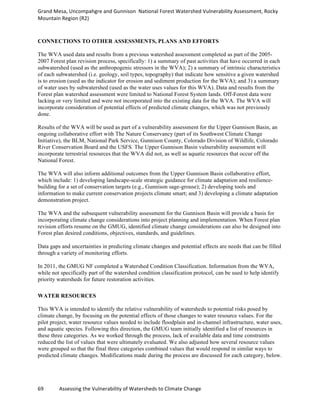
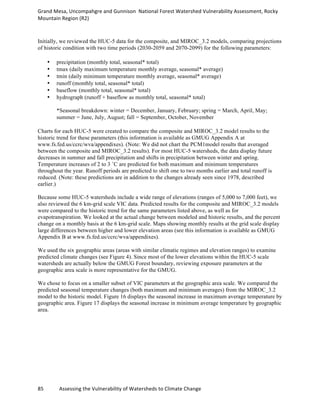
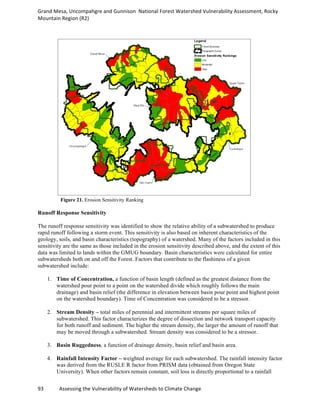
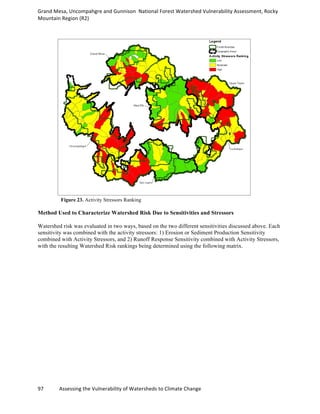
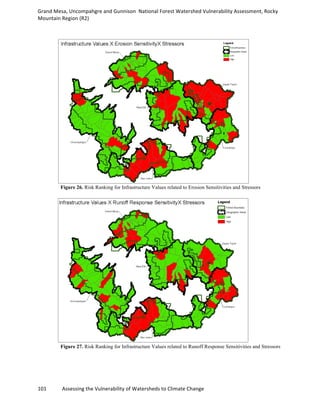
There are a total of 58 “High” risk subwatersheds for Erosion Sensitivity × Activity Stressors. The
majority of these subwatersheds are found in the San Juans, Upper Taylor, and West Elk geographic
areas. Twenty-three of these subwatersheds have a “High” Risk Rating just for Erosion Sensitivity ×
Activity Stressors alone, and 35 also have a “High” risk for Runoff Response Sensitivity × Activity
Stressors (compare with Figure 25).
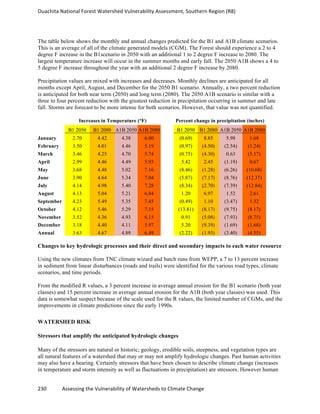
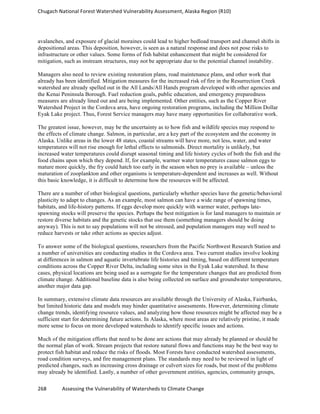
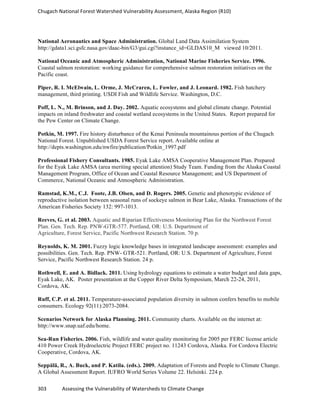
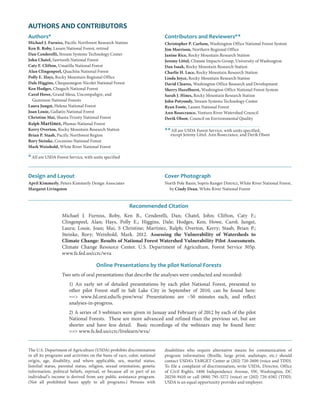
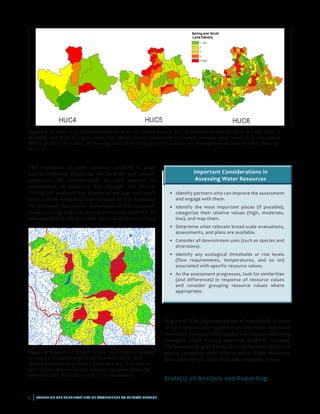
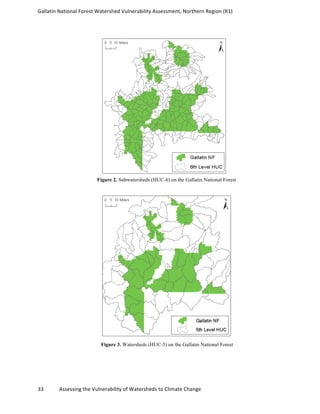
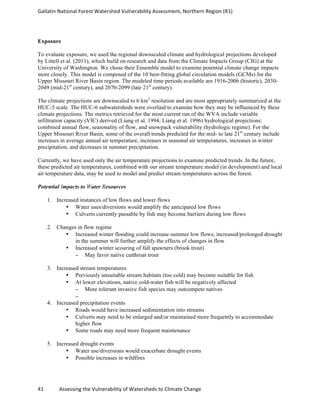
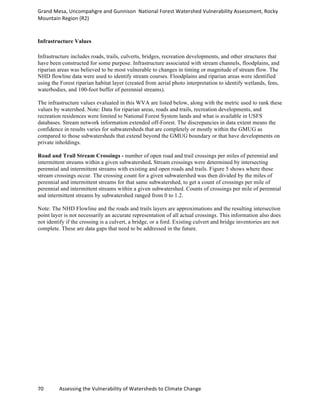
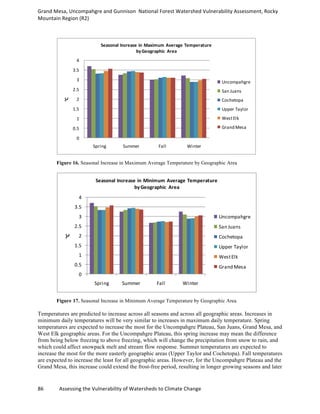
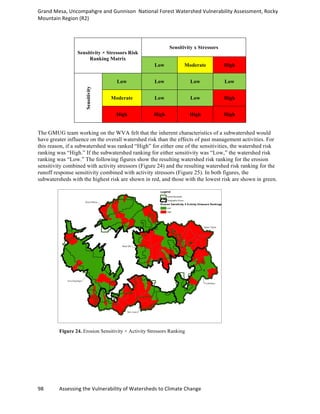
Figure 25. Runoff Response Sensitivity × Activity Stressors Ranking
There are 63 “High” risk subwatersheds for Runoff Response Sensitivity × Activity Stressors. The
majority of these subwatersheds are found in the San Juans and Grand Mesa geographic areas. Of these,
28 subwatersheds have a “High” risk rating for Runoff Response Sensitivity × Activity Stressors, while
the remaining 35 are also “High” risk for Erosion Sensitivity × Activity Stressors (compare with Figure
24).
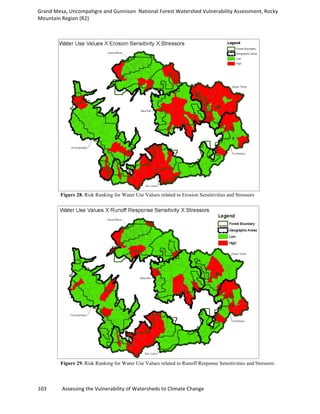
RESULTS (VULNERABILITY)
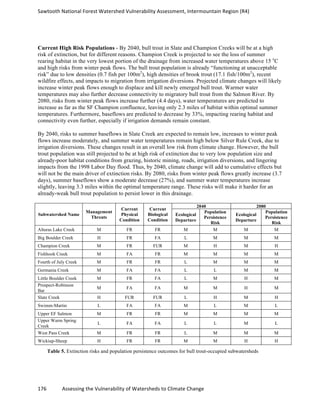
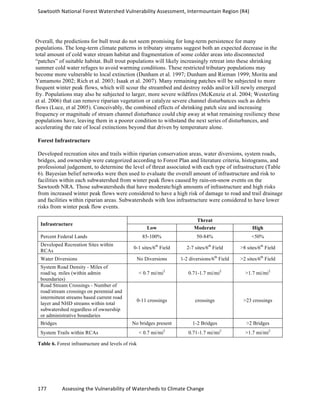
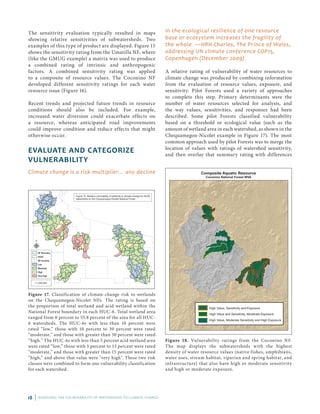
To determine relative vulnerability of identified aquatic resources to predicted climate change, we need to
combine all the pieces described above (resource values, risk [inherent sensitivity of the land and past
management], and exposure) to see where they overlap. Resources of concern are most vulnerable where
they occur in subwatersheds with highest sensitivity. The additional stress from climate change is most
likely to have greatest impact in these areas.
Method Used to Rank Resource Values Relative to Watershed Risk
The different aquatic resource values of concern identified for this WVA can be affected by
erosion/sedimentation and runoff in different ways. For this reason, the results of the two different risk](https://image.slidesharecdn.com/pilotnfwatershedvulnerabilityreport-130610134954-phpapp01/85/Assessing-the-Vulnerability-of-Watersheds-to-Climate-Change-103-320.jpg)
![Grand
Mesa,
Uncompahgre
and
Gunnison
National
Forest
Watershed
Vulnerability
Assessment,
Rocky
Mountain
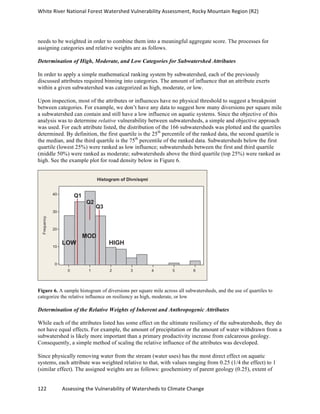
Region
(R2)
111
Assessing
the
Vulnerability
of
Watersheds
to
Climate
Change
Christensen, N.S., and D.P. Lettenmaier. 2007. “A multimodel ensemble approach to assessment of
climate change impacts on the hydrology and water resources of the Colorado River Basin.” Hydrol.
Earth Syst. Sci., 11, 1417–1434 (www.hydrol-‐earth-‐syst-‐sci.net/11/1417/2007/).”
Colorado Water Conservation Board. Draft 2010. Colorado River Water Availability Study; Phase I
Report.
Furniss, M.J., B.P. Staab, S. Hazelhurst, C.F. Clifton, K.B. Roby, B.L. Ilhadrt, E.B. Larry, A.H.
Todd, L.M. Reid, S.J. Hines, K.A. Bennett , C.H. Luce, P.J. Edwards. 2010. Water, climate change
and forests: watershed stewardship for a changing climate. Gen. Tech. Rep. PNW_GTR-812. USDA
Forest Service, Pacific Northwest Research Station. Portland OR.
Hirsch, C.L., S. E. Albeke, and T. P. Nessler. 2006. Range-wide status of Colorado River cutthroat
trout (Oncorhynchus clarkii pleuriticus): 2005. Colorado Division of Wildlife, Denver, CO.
IPCC. 2008. Technical Paper of the Intergovernmental Panel on Climate Change on Climate Change and
Water. [Bates, B.C., Z.W. Kundzewicz, S.Wu, and J.P. Palutikof, (eds.)] IPCC Secretariate, Geneva.
(Available at: http://ipcc.ch/pdf/technical-‐papers/climate-‐change-‐water-‐en.pdf).
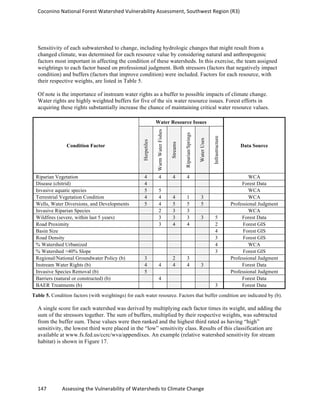
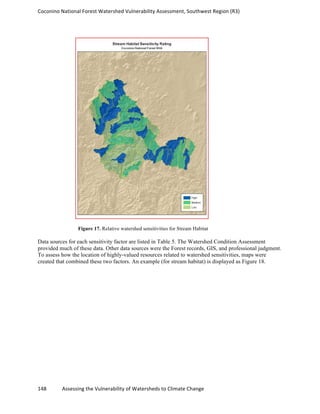
Painter, T.H., J. Deems, J. Belnap, A. Hamlet, C.C. Landry, and B. Udall. 2010. Response of
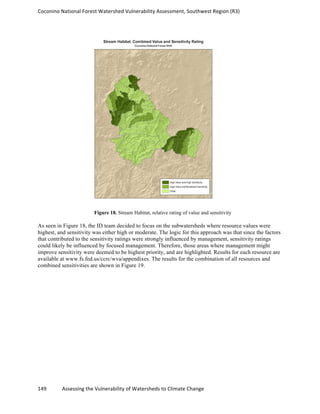
Colorado river runoff to dust radiative forcing in snow. Proceedings of the North Academy of Sciences.
(accessed at www.pnas.org/content/early/2010/09/14/0913139107.full.pdf+html)
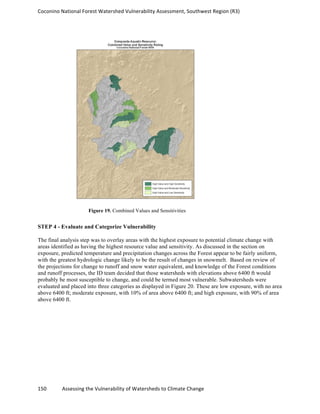
Ray, A.J., J.J. Barsugli, K.B. Averyt, K. Wolter, M. Hoerling, N. Doesken, B. Udall, R.S. Webb.
2008. Climate Change in Colorado: a Synthesis to Support Water Resources Management and
Adaptation. Western Water Assessment. Boulder, CO.
Rieman, B.E. and D.J. Isaak. 2010. Climate Change, Aquatic Ecosystems, and Fishes in the Rocky
Mountain West: implications and alternatives for management. Gen. Tech. Rep. RMRS-GTR-250. USDA
Forest Service, Rocky Mountain Research Station. Fort Collins, CO.
Spears, M., L. Brekke, A. Harrison, and J Lyons. 2009. Literature Synthesis on Climate Change
Implications for Reclamation’s Water Resources. Technical memorandum 86-68210-091. U.S.
Department of the Interior, Bureau of Reclamation, Research and Development Office. Denver, CO.](https://image.slidesharecdn.com/pilotnfwatershedvulnerabilityreport-130610134954-phpapp01/85/Assessing-the-Vulnerability-of-Watersheds-to-Climate-Change-115-320.jpg)