This evaluation summarizes WFP's PRRO 200453 operation in Zimbabwe from September 2012 to March 2014. The operation aimed to assist 2.4 million vulnerable people through three components: Productive Asset Creation (PAC) to build resilience; Health and Nutrition Programming (H&N) to address malnutrition; and Seasonal Targeted Assistance (STA) to cover food needs during lean seasons. Fieldwork involved interviews and focus groups from which the evaluation assessed the appropriateness, results, and factors affecting the operation. It found that while the operation was appropriate for needs, only 65% of the food target was reached due to funding shortfalls. The evaluation provides recommendations to strengthen early warning systems, diversify assistance modalities,


![22
actually benefited from the intervention; ii) outputs – basically the quantity of cash /
vouchers / food distributed and the numbers of people who benefited; iii) Outcomes
cover the intended and unintended changes in certain indicators recorded over the
period of the intervention (though it should be noted that these cannot always be
attributed to the intervention, but only contribution of PRRO action can be claimed);
and iv) efficiency, which is an analysis of whether activities were cost efficient and
delivered on time and whether outcomes could have been achieved in a different way.
These issues are explored in relation to the three components of the PRRO below.
2.2.1 Productive Asset Creation
2.2.1.1 PAC Household Targeting
99. Households to participate in the PAC initiative were selected at Ward level.
Once Wards had been selected for a PAC intervention (section 2.1.2), communities
themselves were responsible for selecting households who would receive STA or
participate in PAC by constructing their own vulnerability criteria and listing
households who qualify – a process which is most thorough and accurate when the
village register66 is used to verify names and ensure that no-one has been overlooked.
100. While there were general complaints from beneficiaries that there were more
people in need of food support than there were spaces on the programme, the
evaluation team found little evidence that the targeting procedure had been
manipulated or hijacked by any one person or group of individuals (although in a
number of cases PAC workers were from villages not benefiting from the asset being
created, and they also were in need of food support).
101. WFP attempts to maintain oversight of the selection process through the use
of a ‘Registration Monitoring’ questionnaire, applied to a minimum of 10% of sites.
Experience from other humanitarian response programmes though (notably the cash
response to the Somalia famine in 2011 [ODI 2013]) shows that it is unrealistic to
expect quality information about biased selection processes. More often than not, if
rigging does occur it is controlled by powerful elites or factions who quash all dissent
through threats and intimidation. Informal networks or anonymous phone lines take
more time and effort to set up, but work better than interviews where there is the
prospect of being seen as a ‘whistle-blower’. Nevertheless, putting in place systems to
prevent political meddling is justified and a particular concern of the larger donors in
Zimbabwe.
2.2.1.2 PAC Outputs
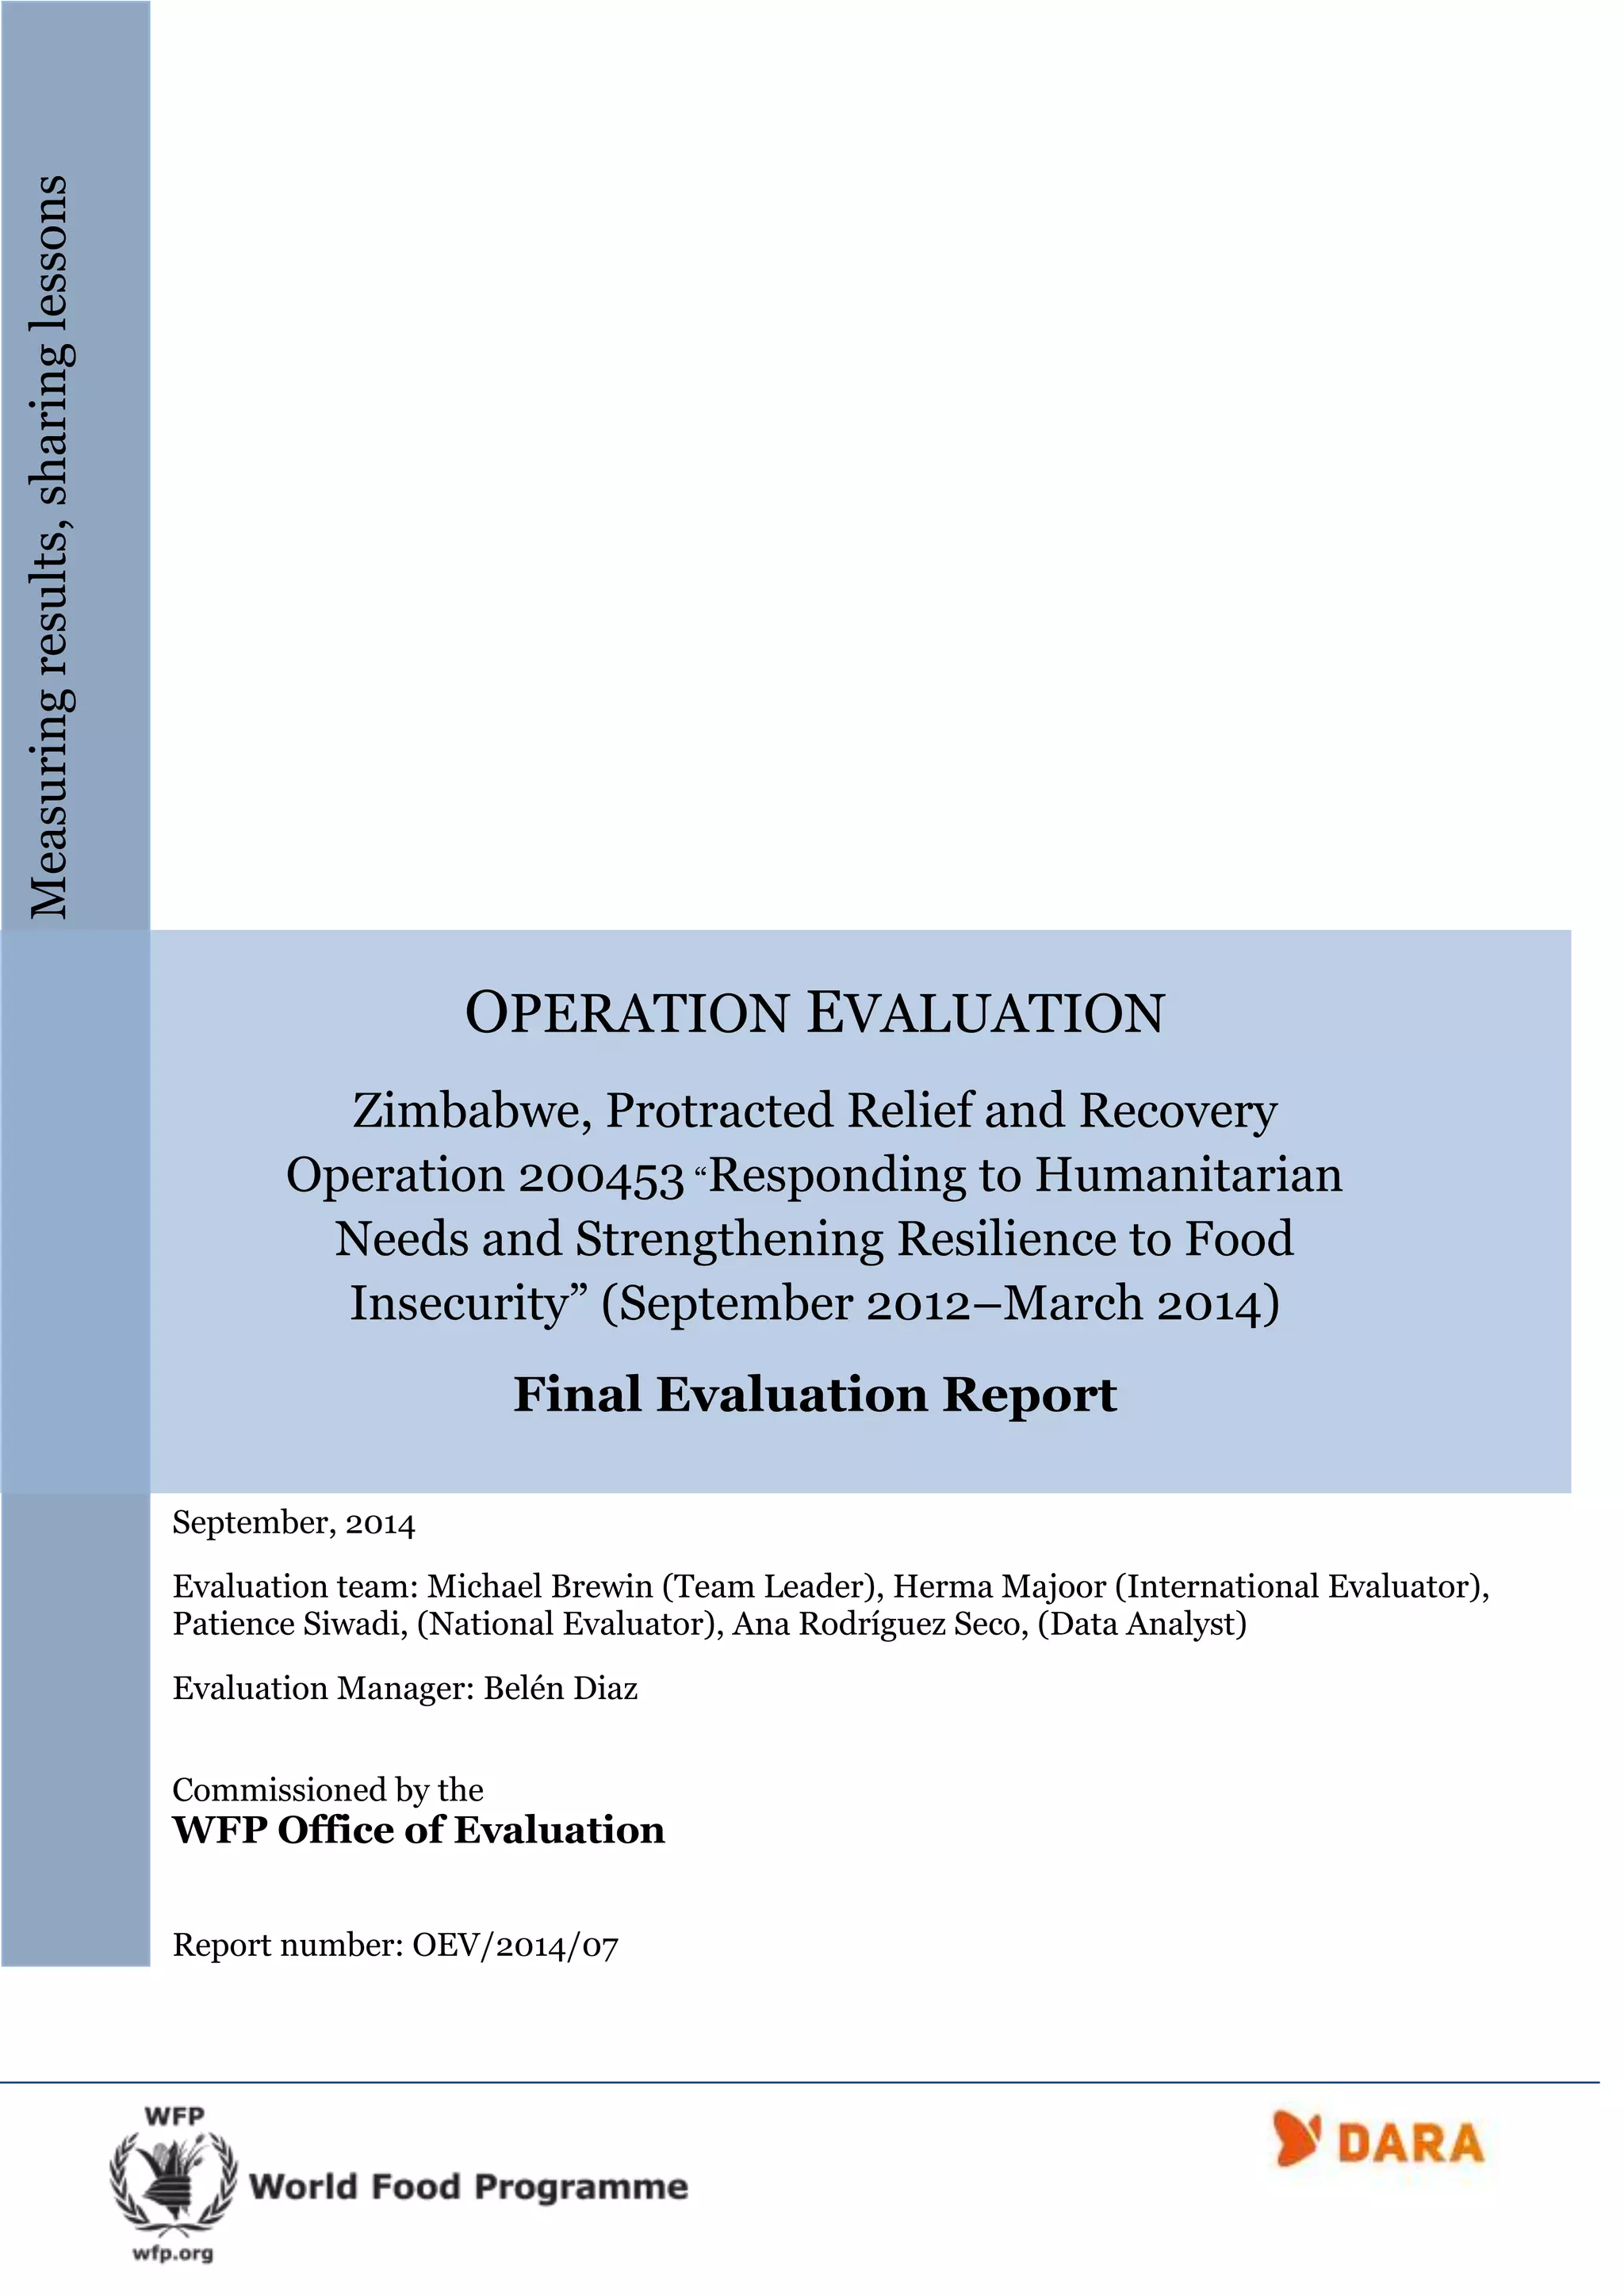
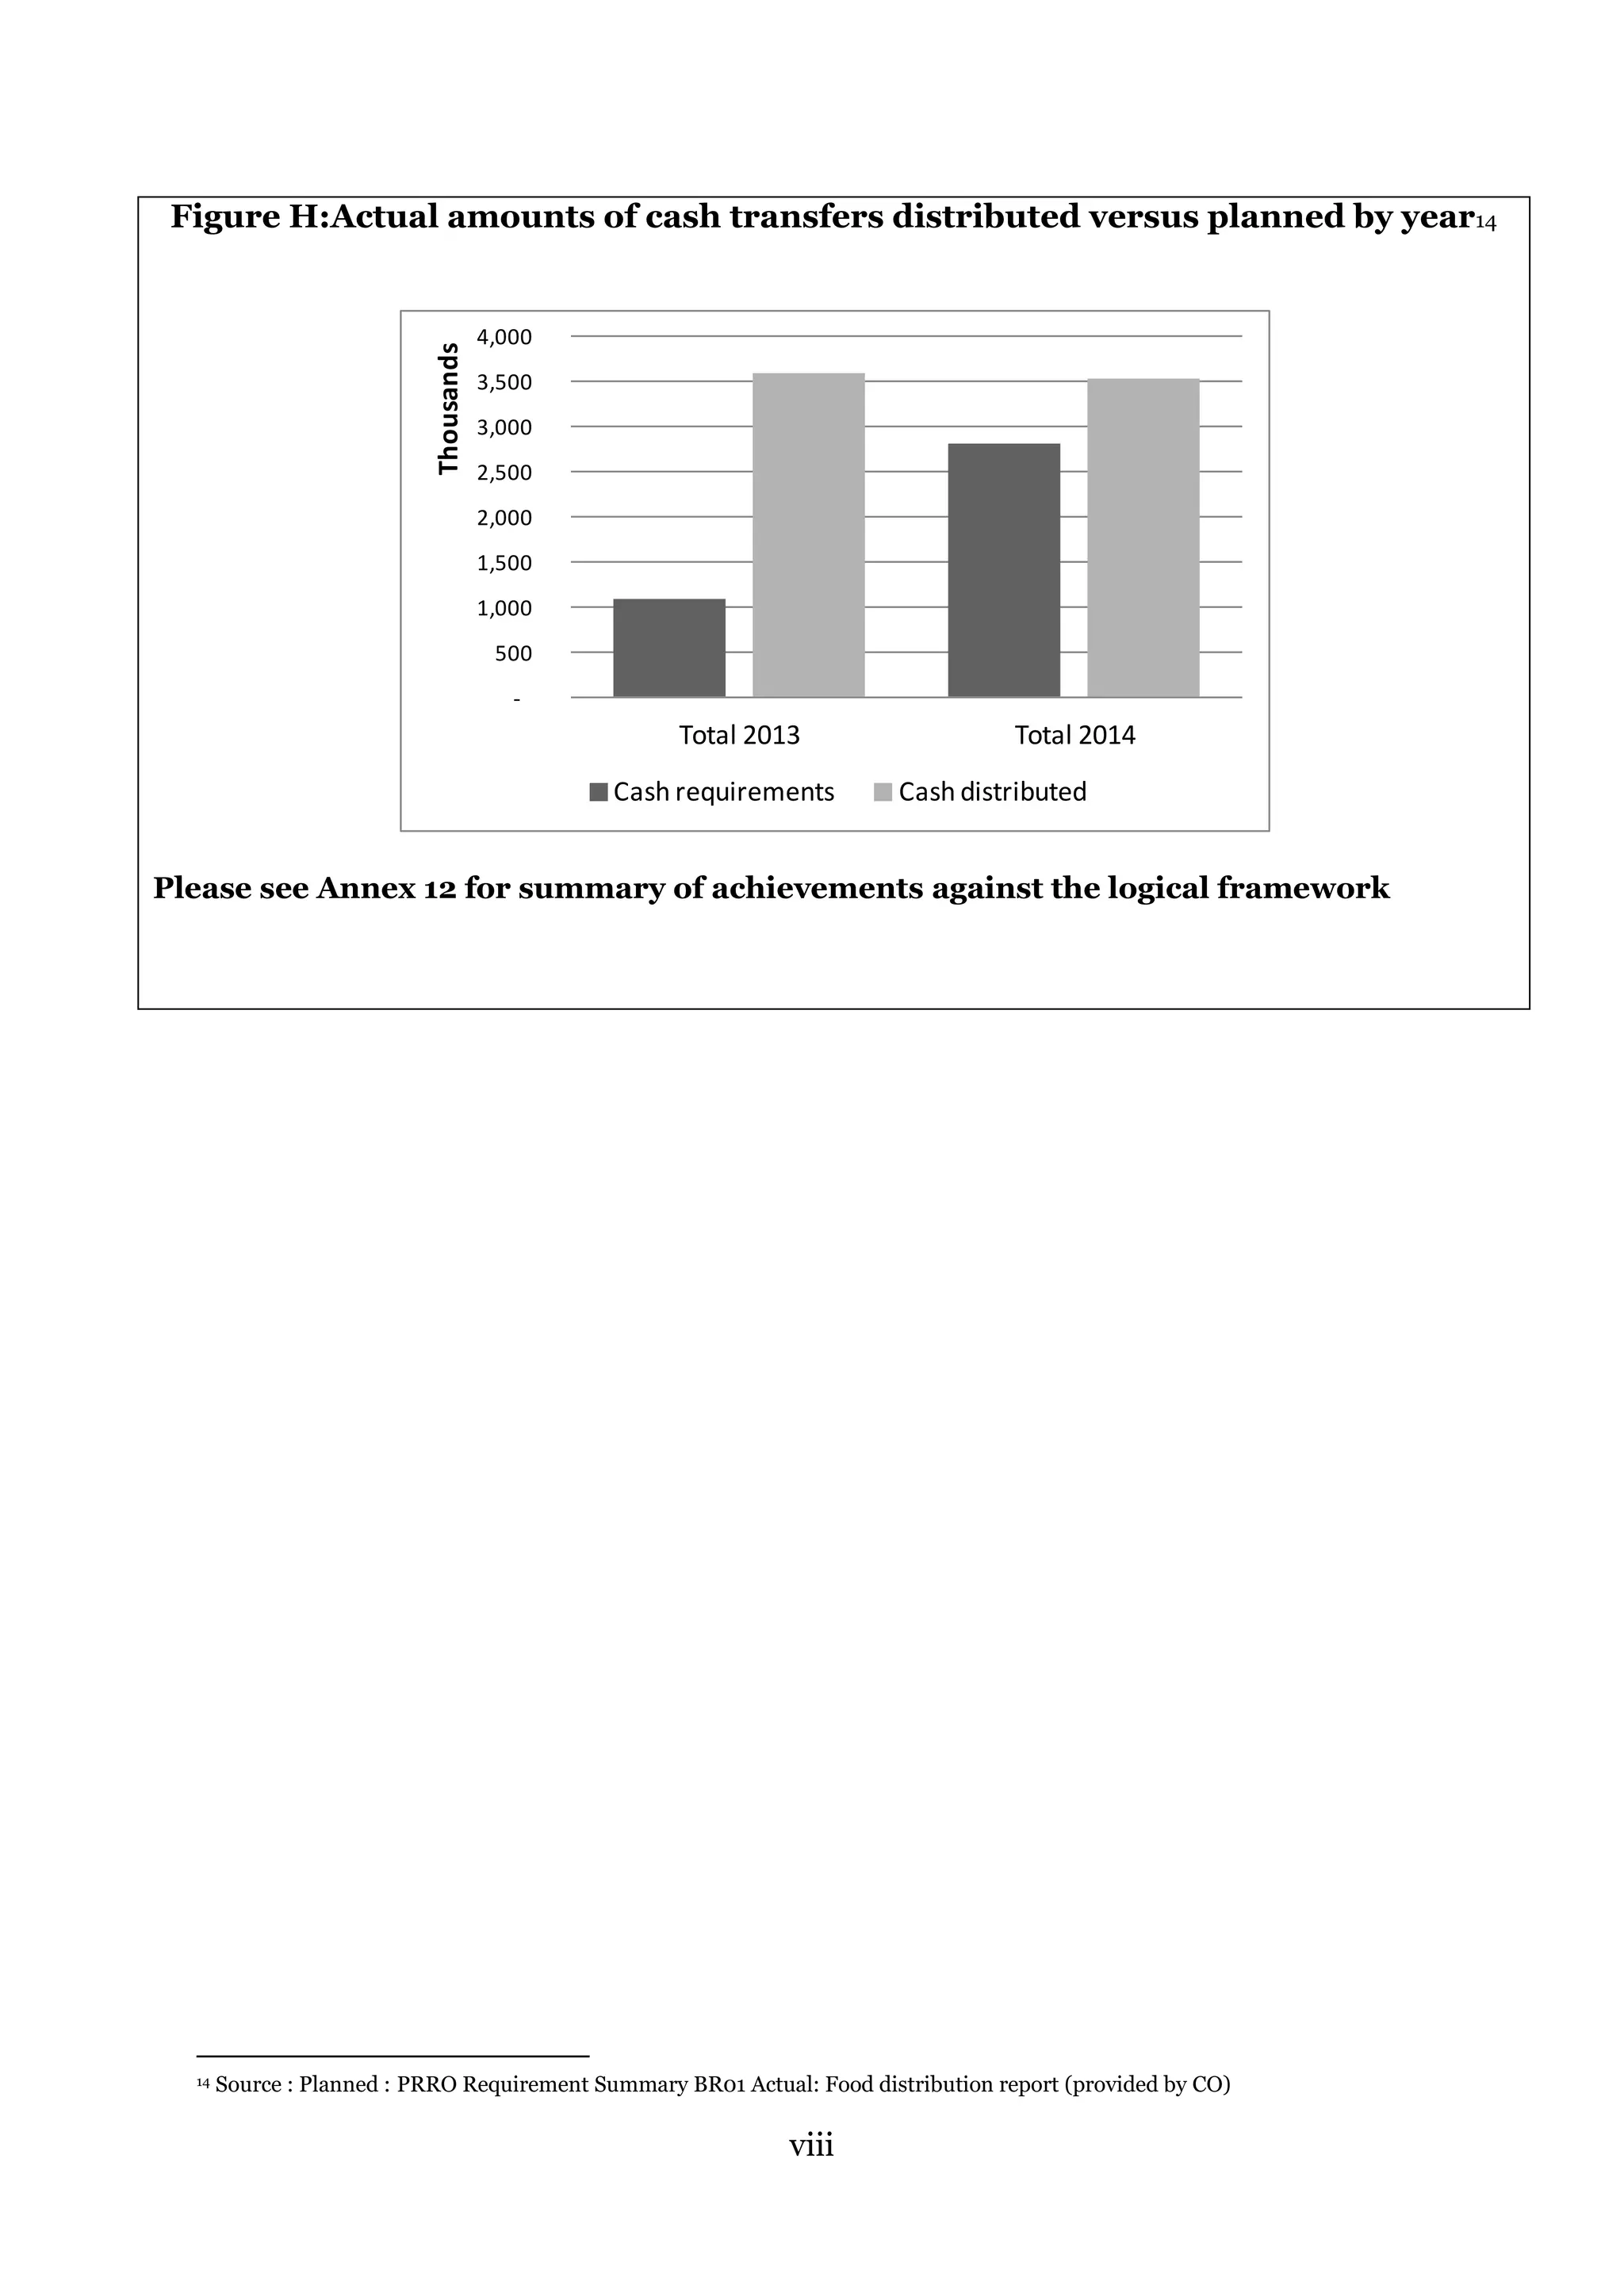
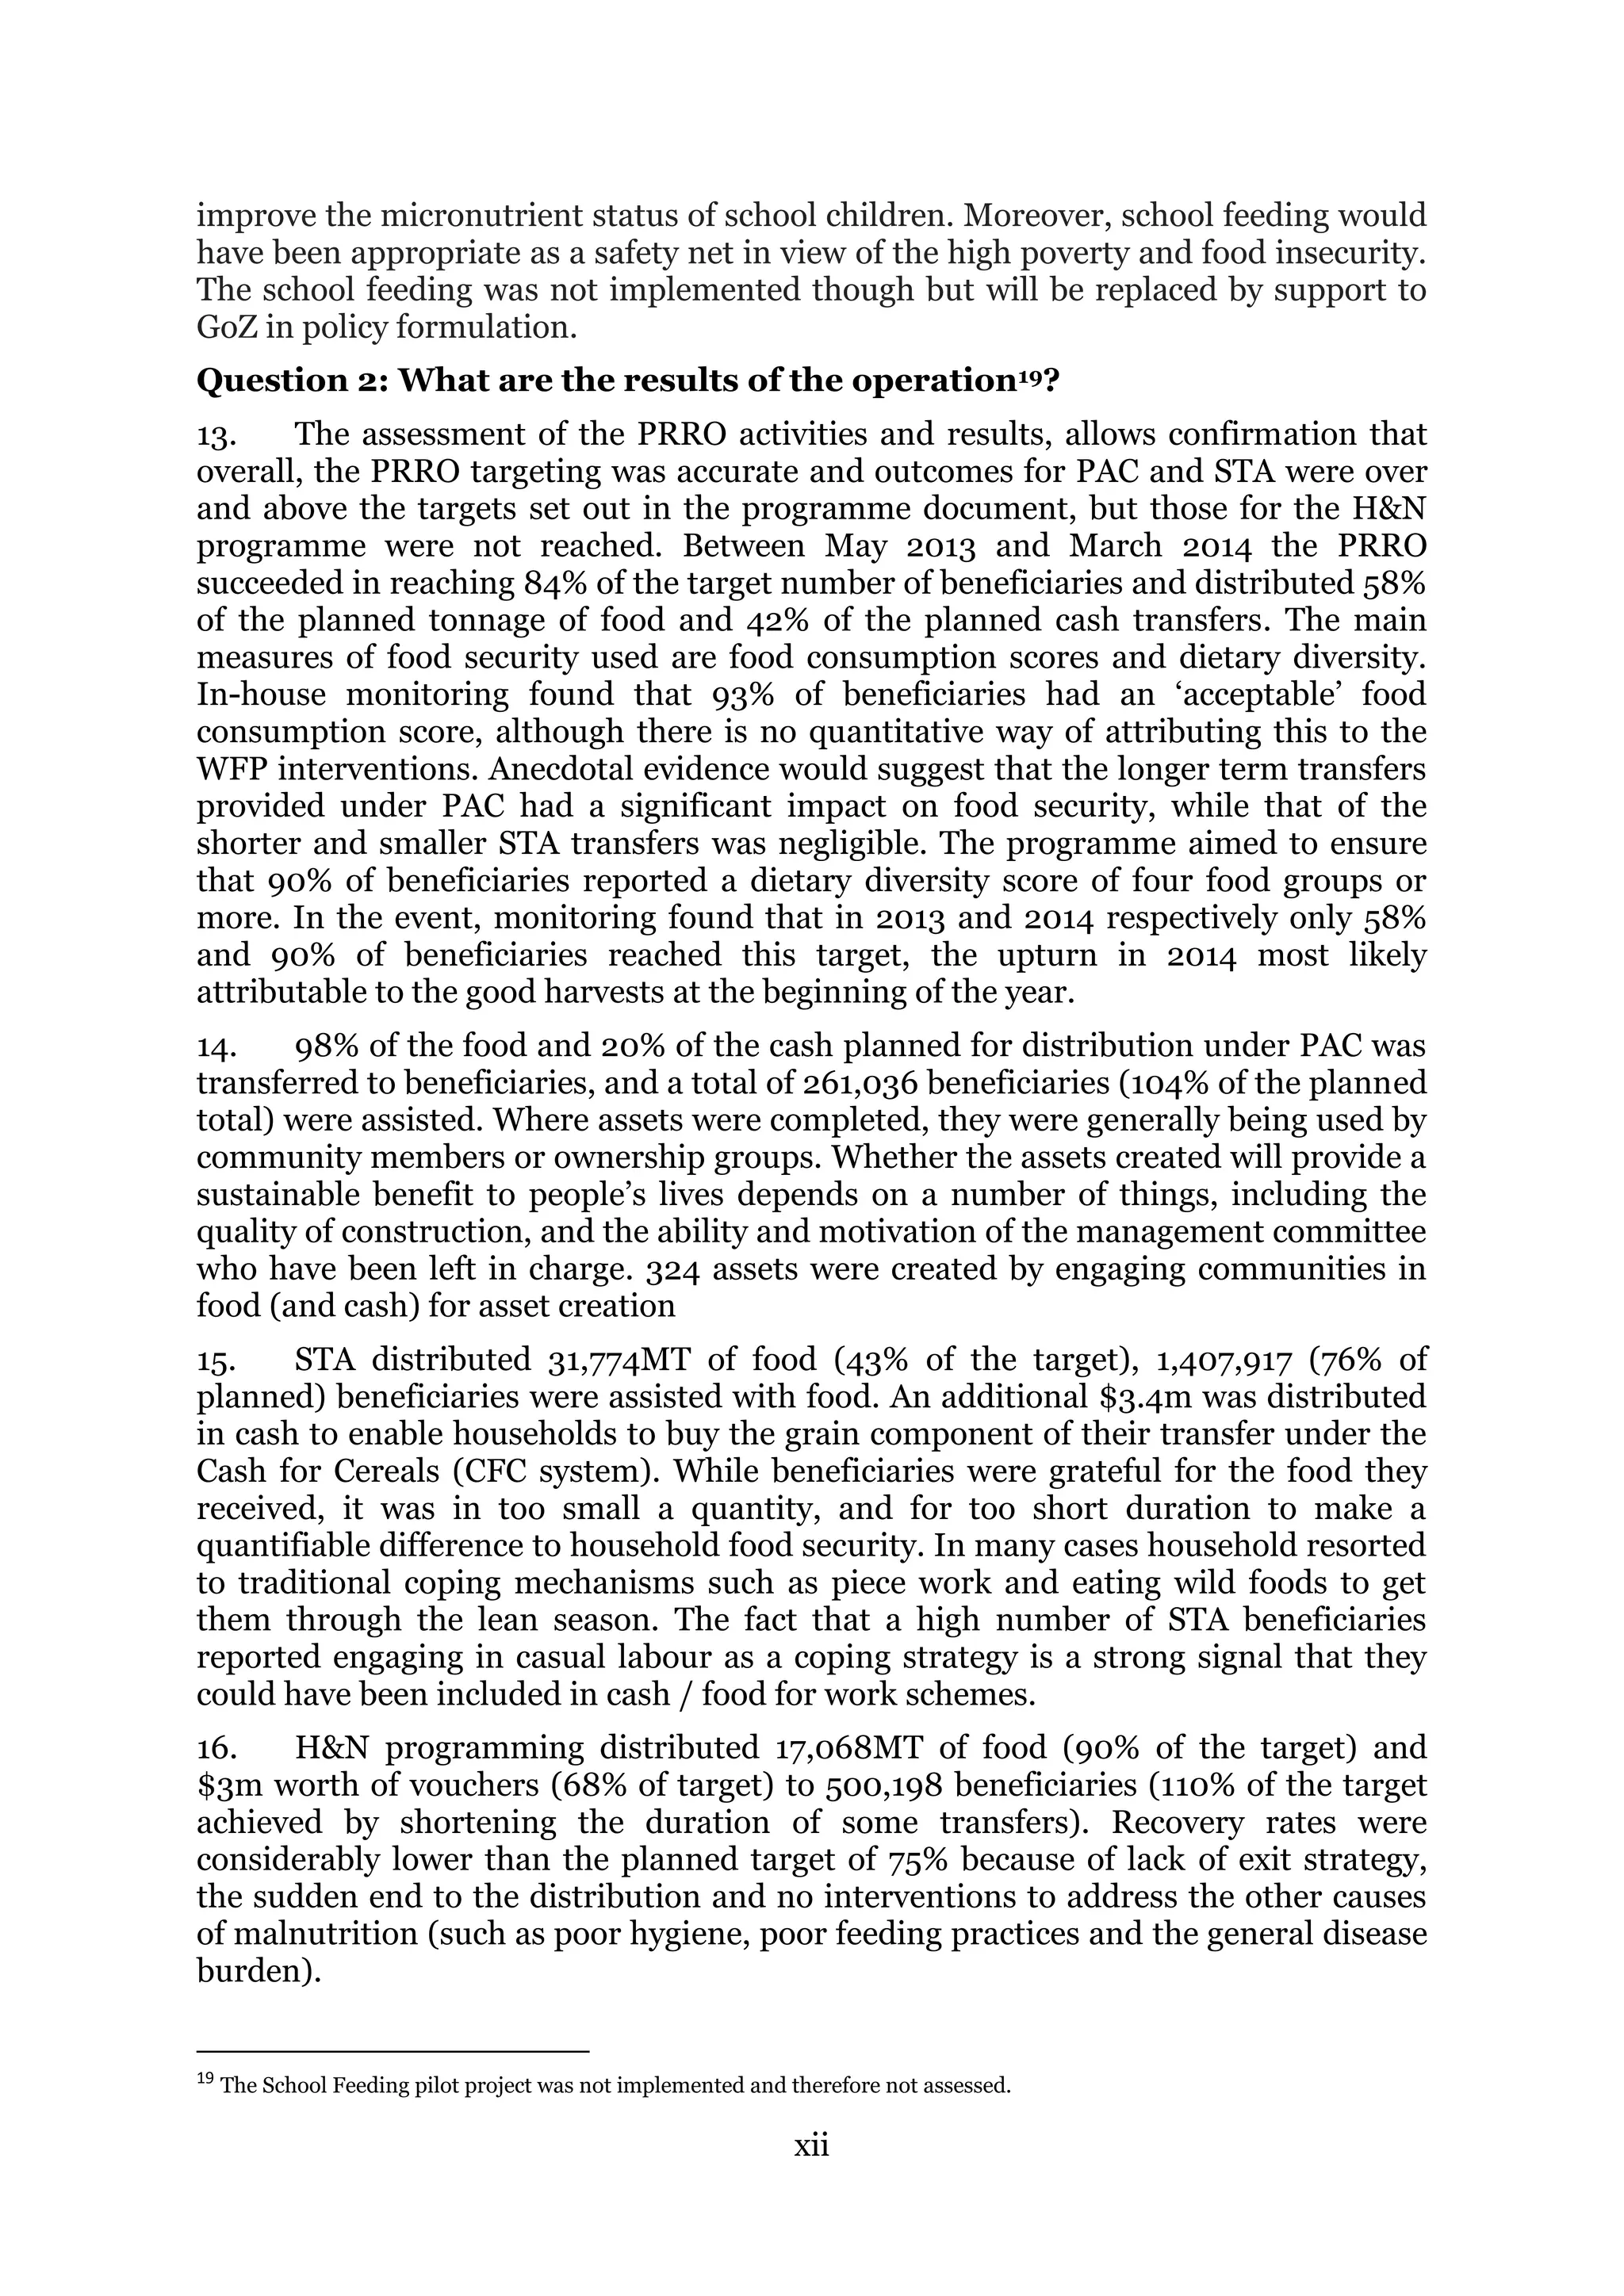
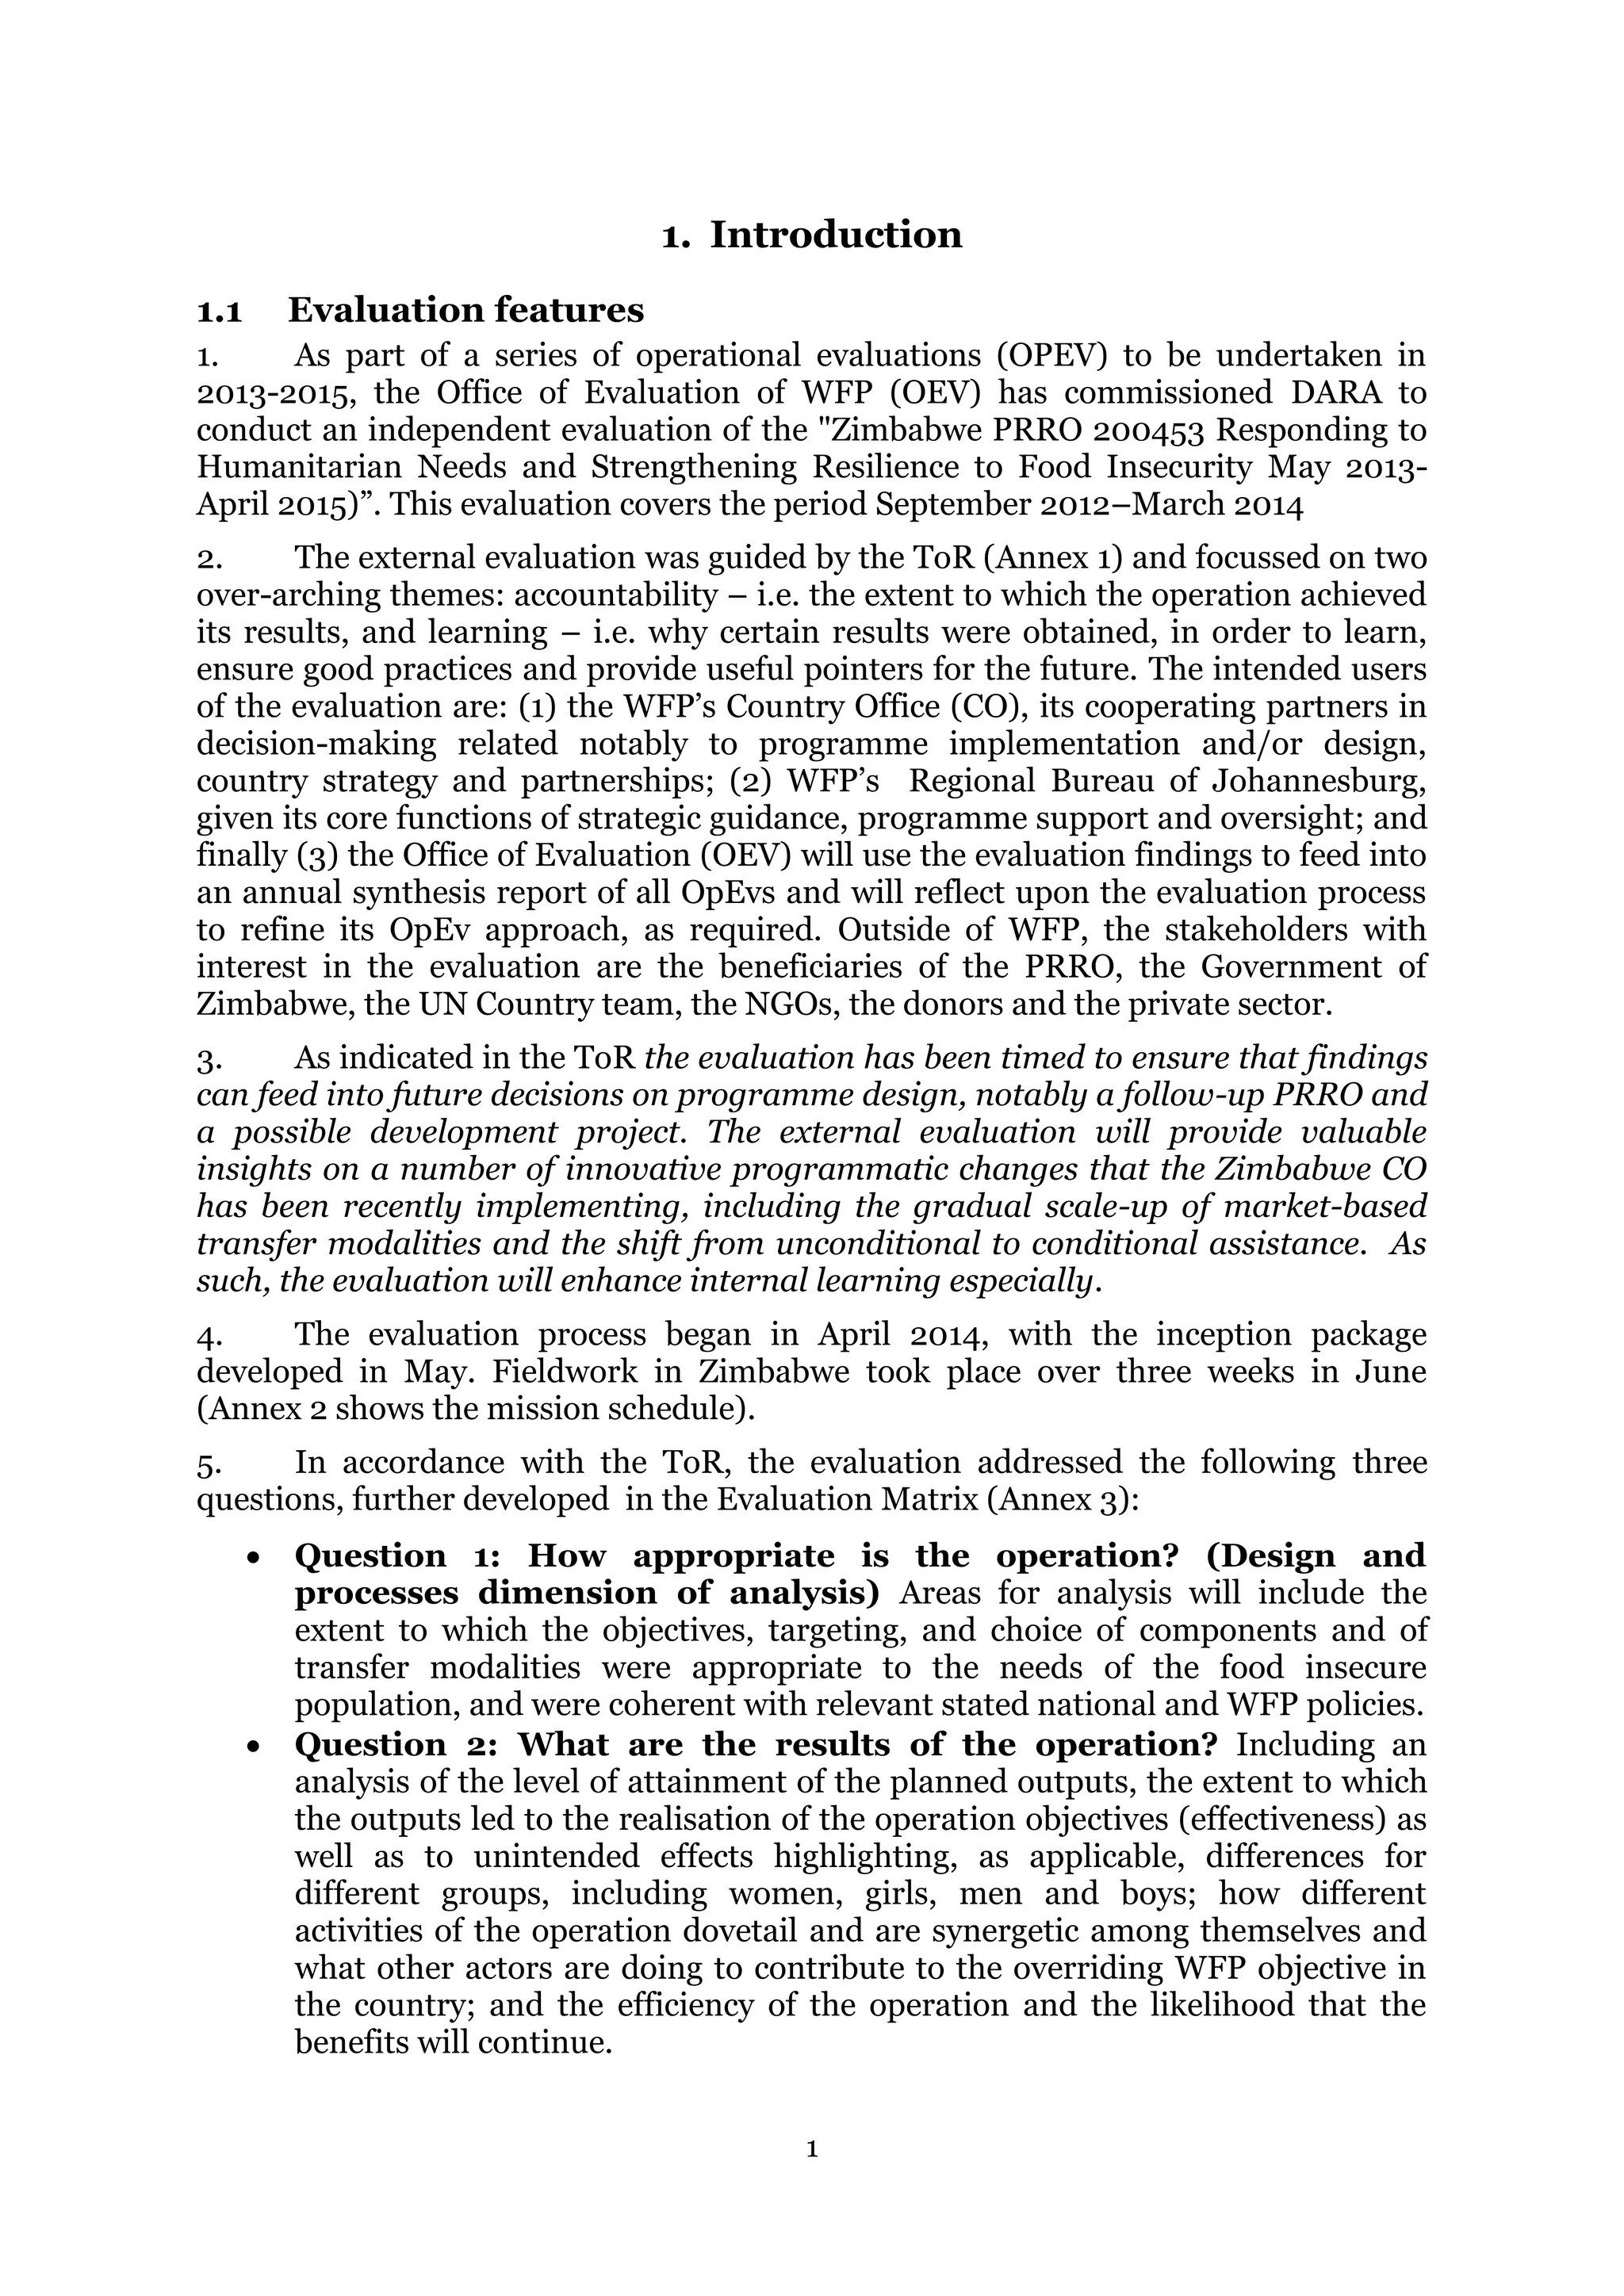
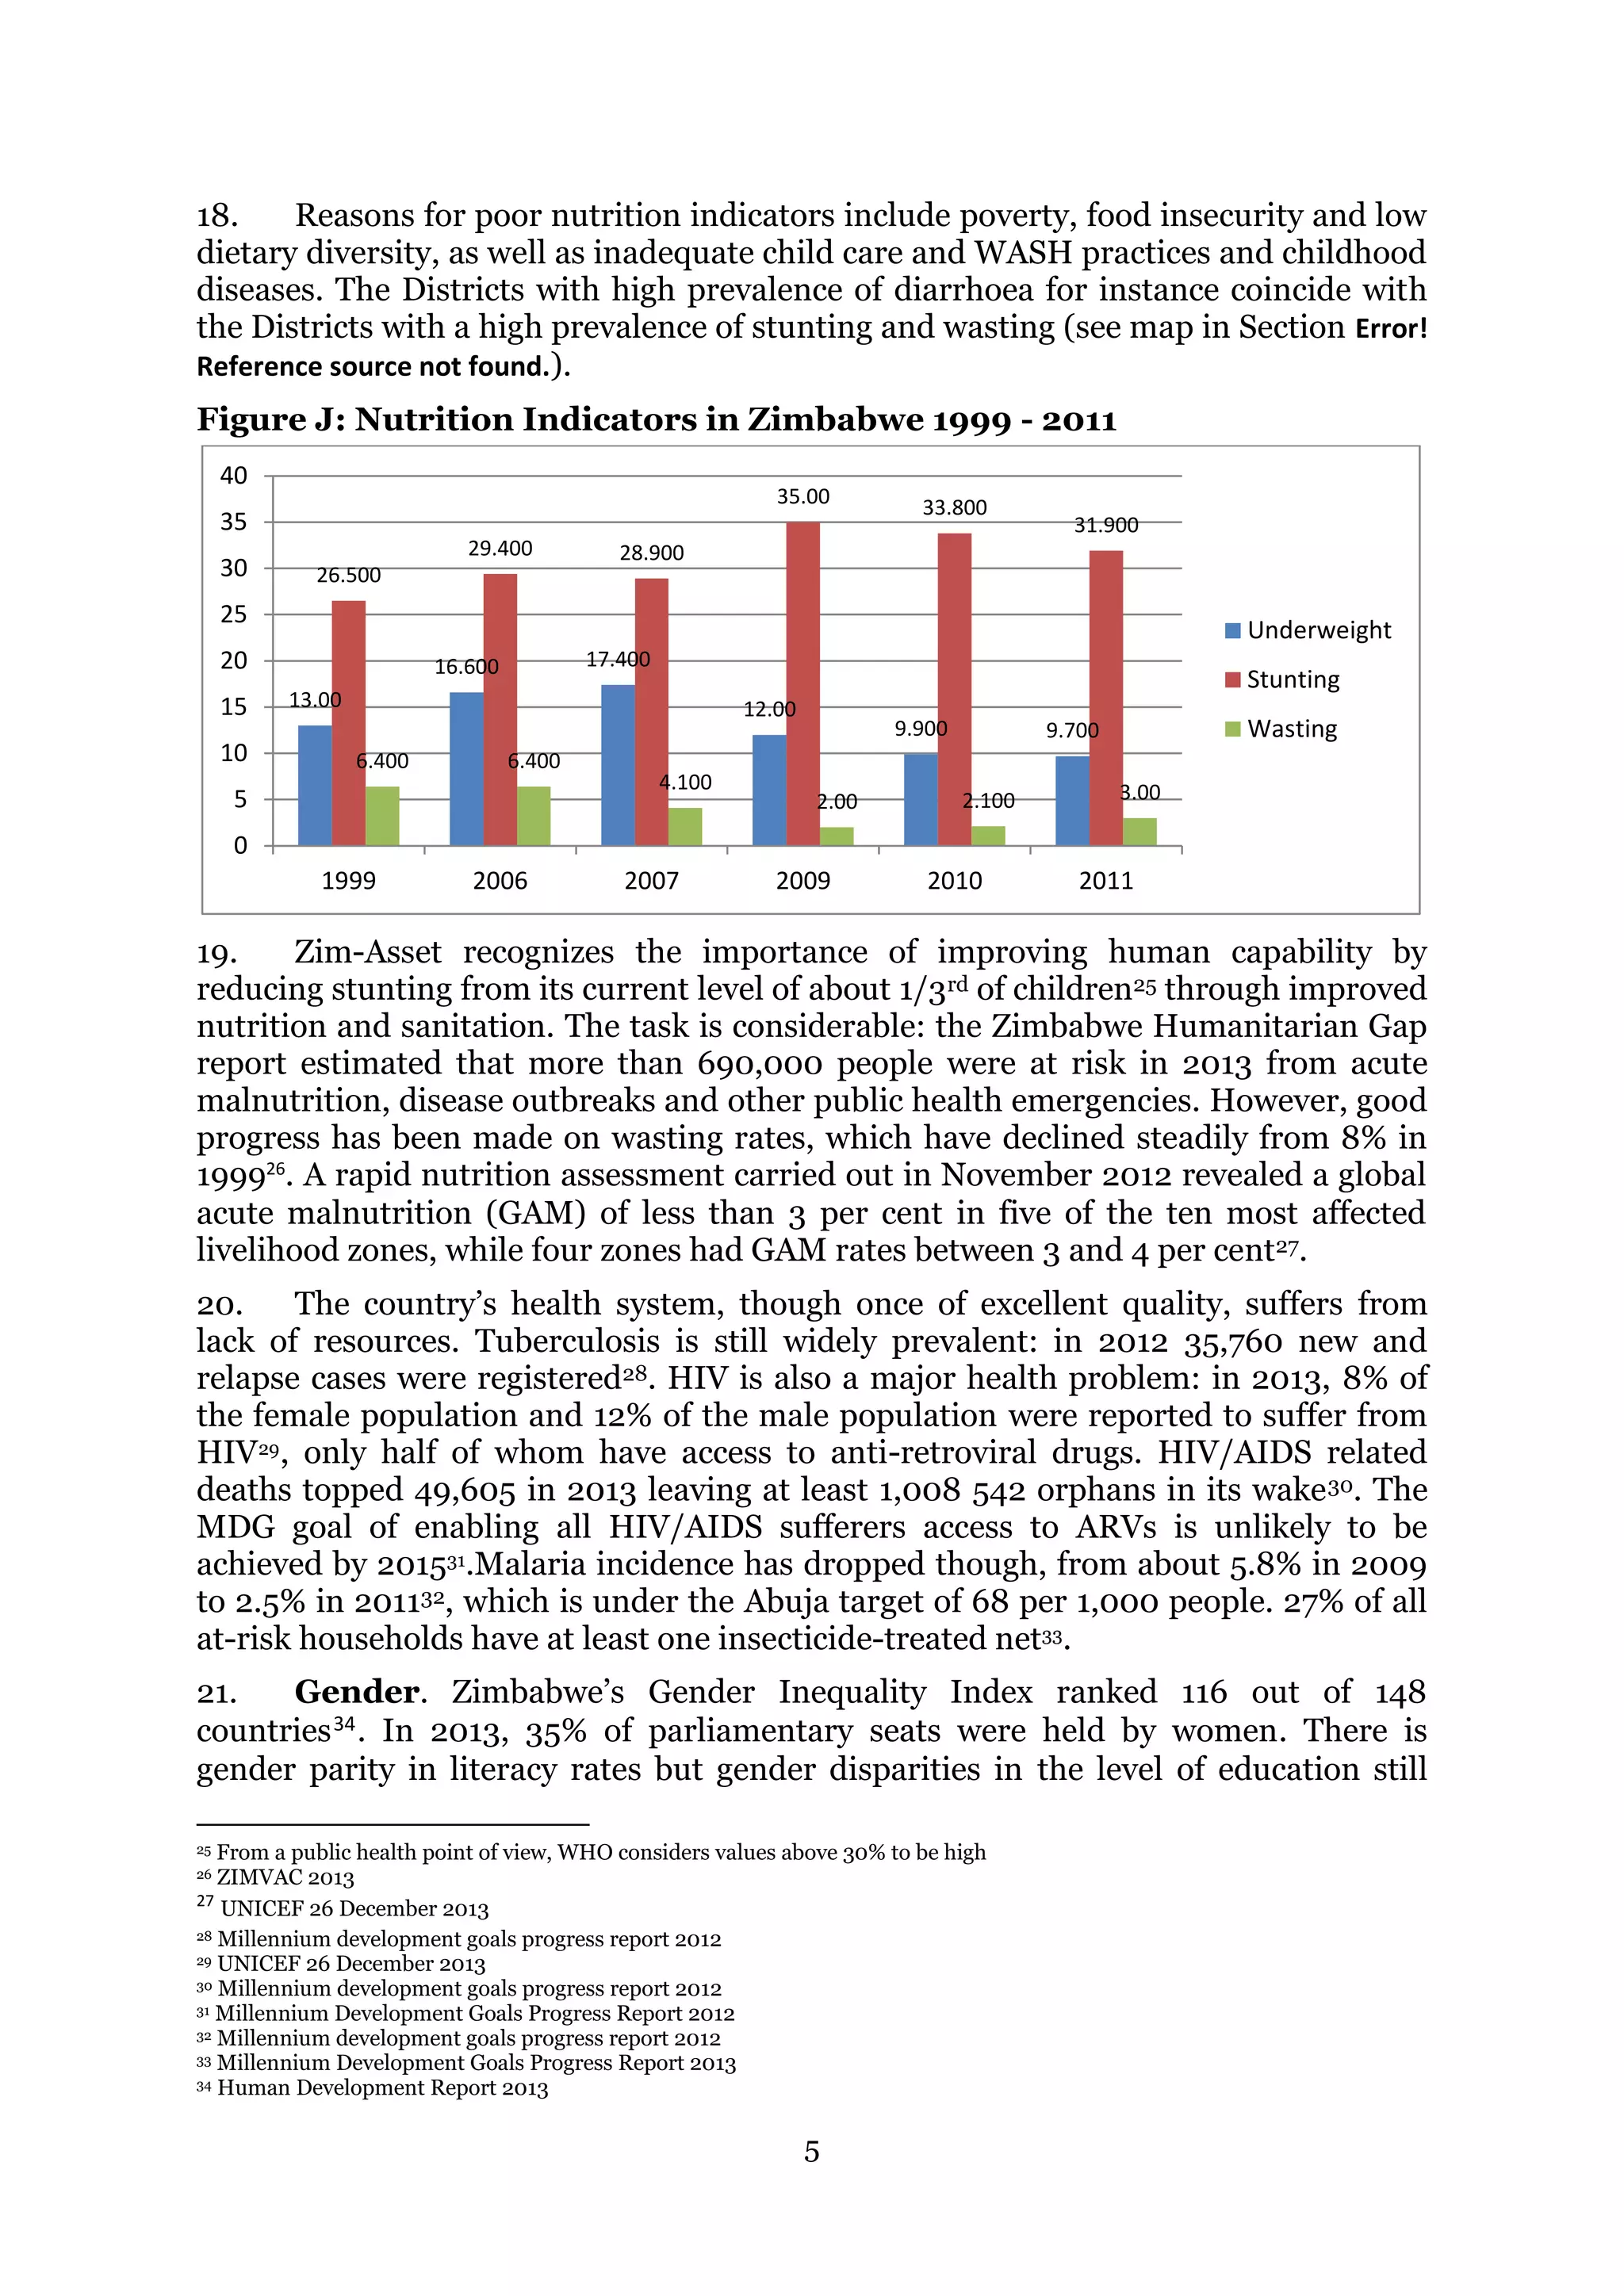
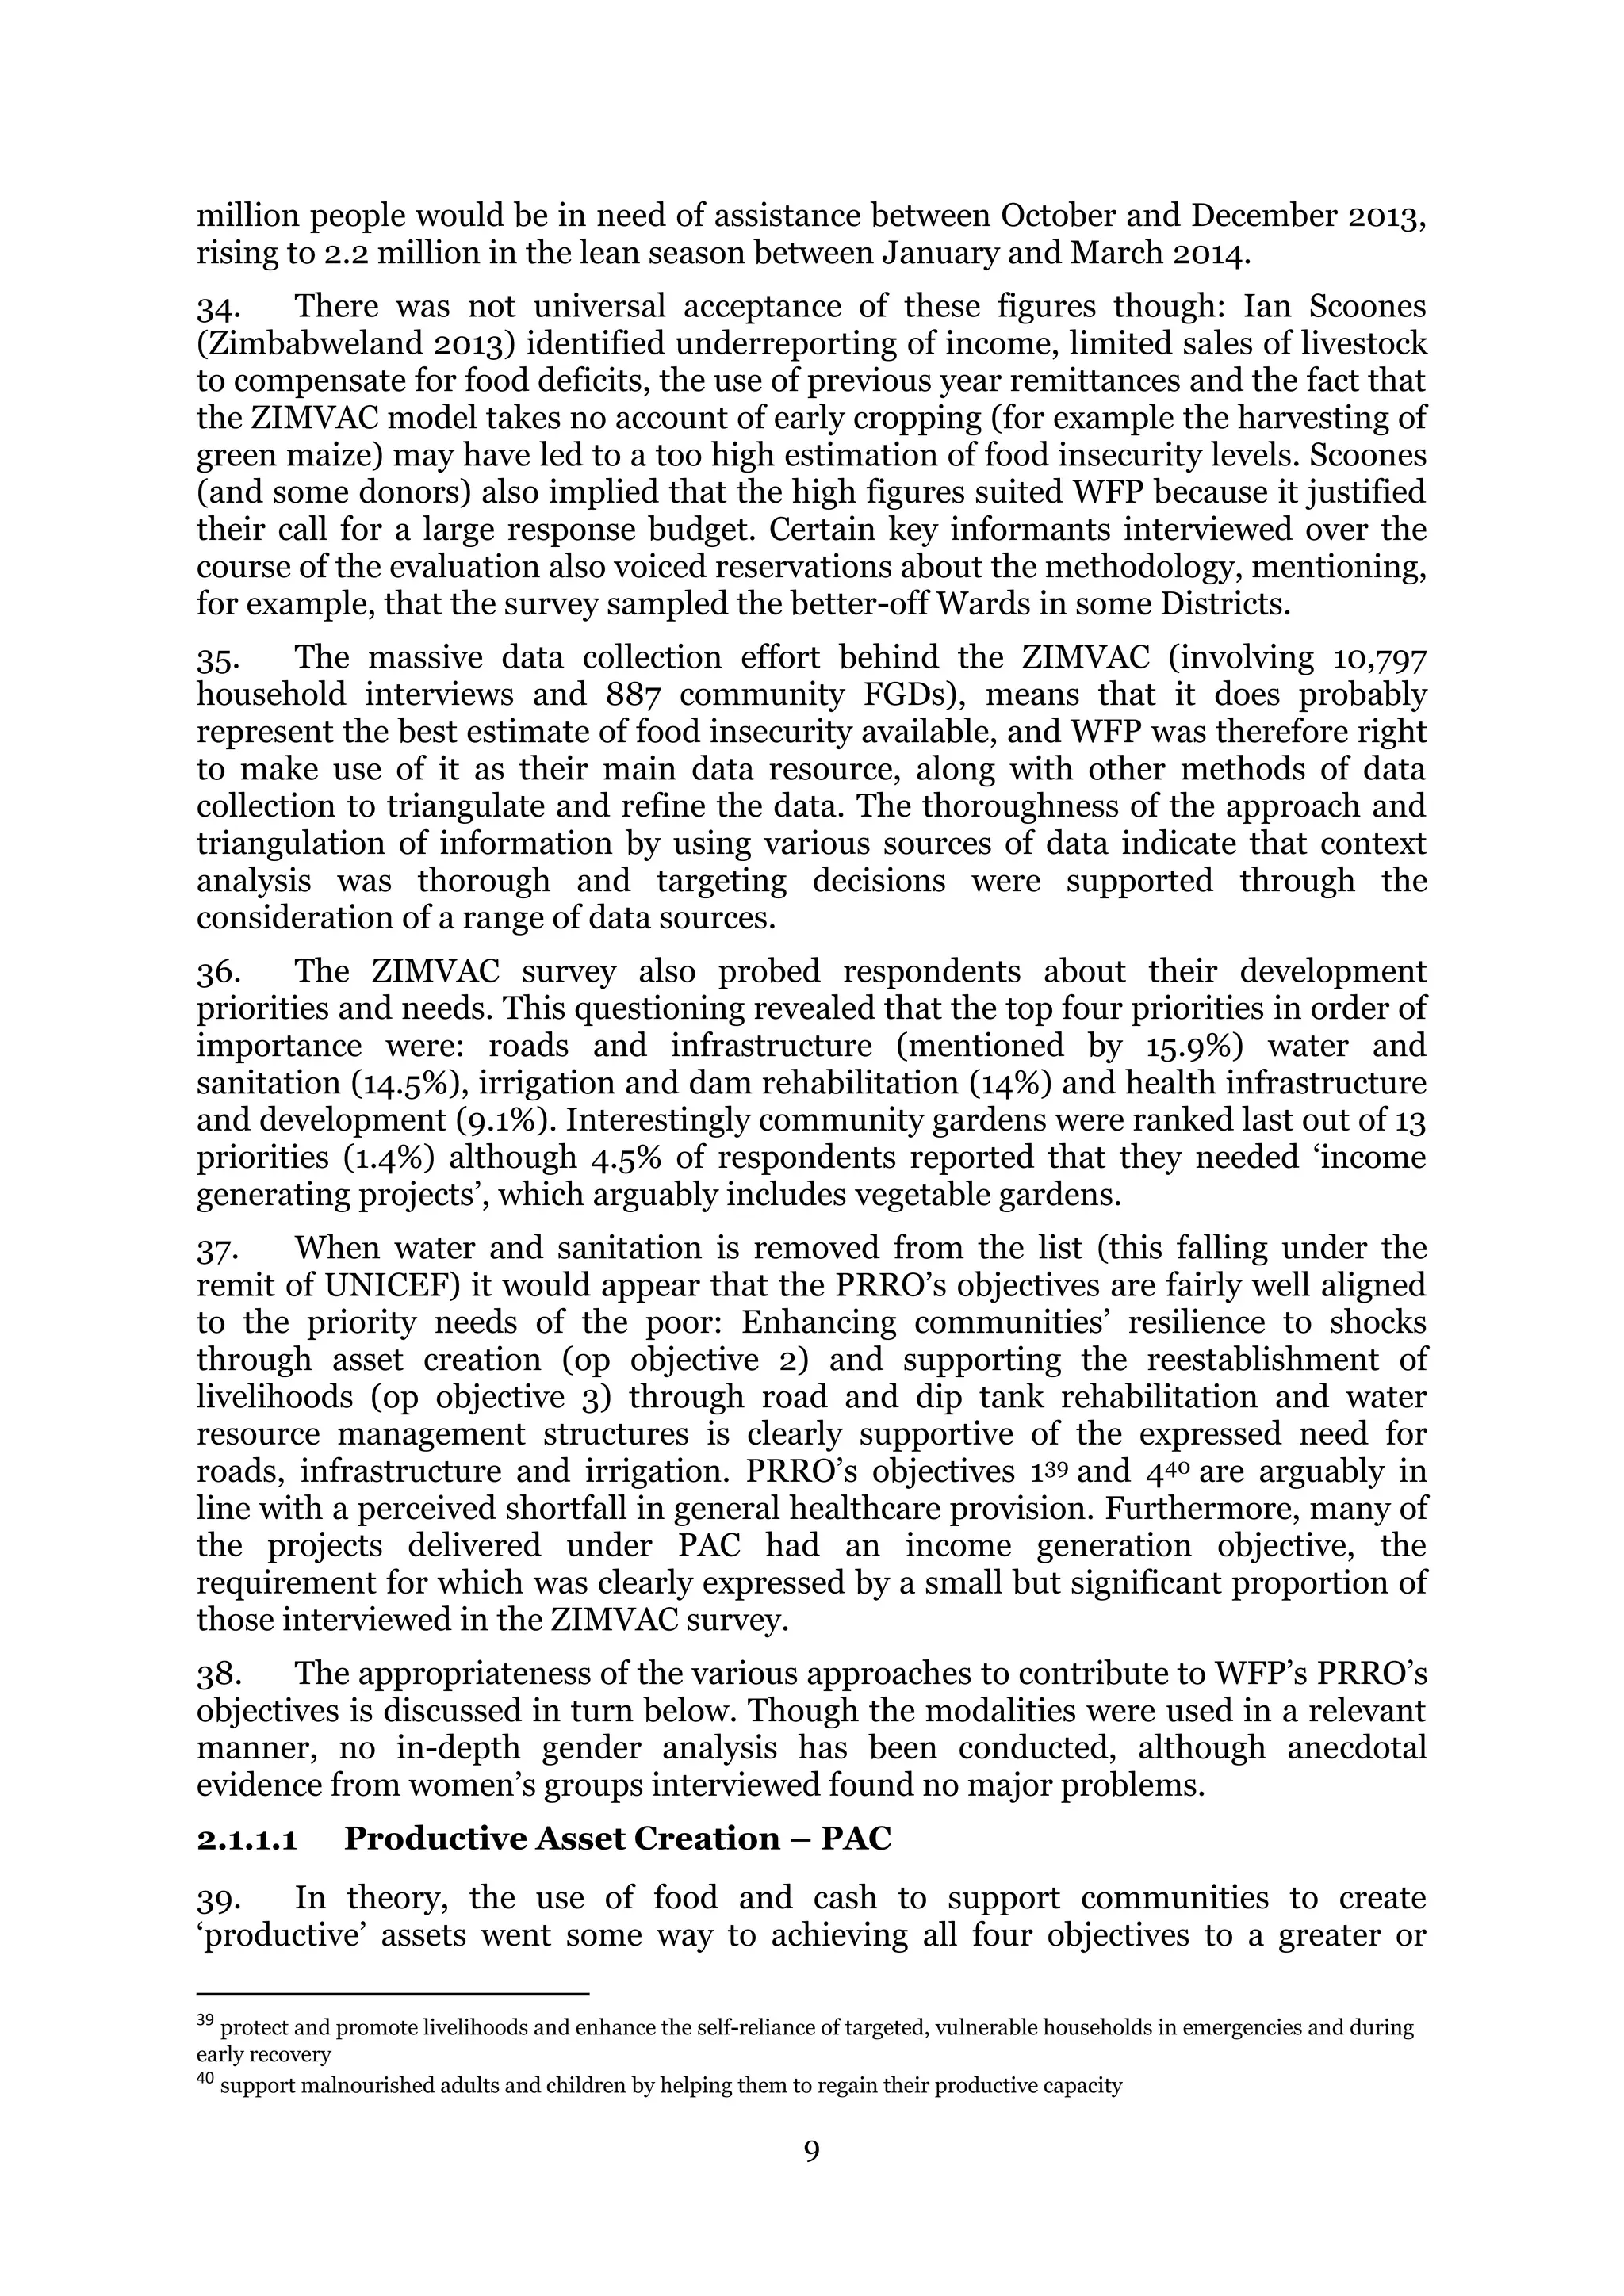
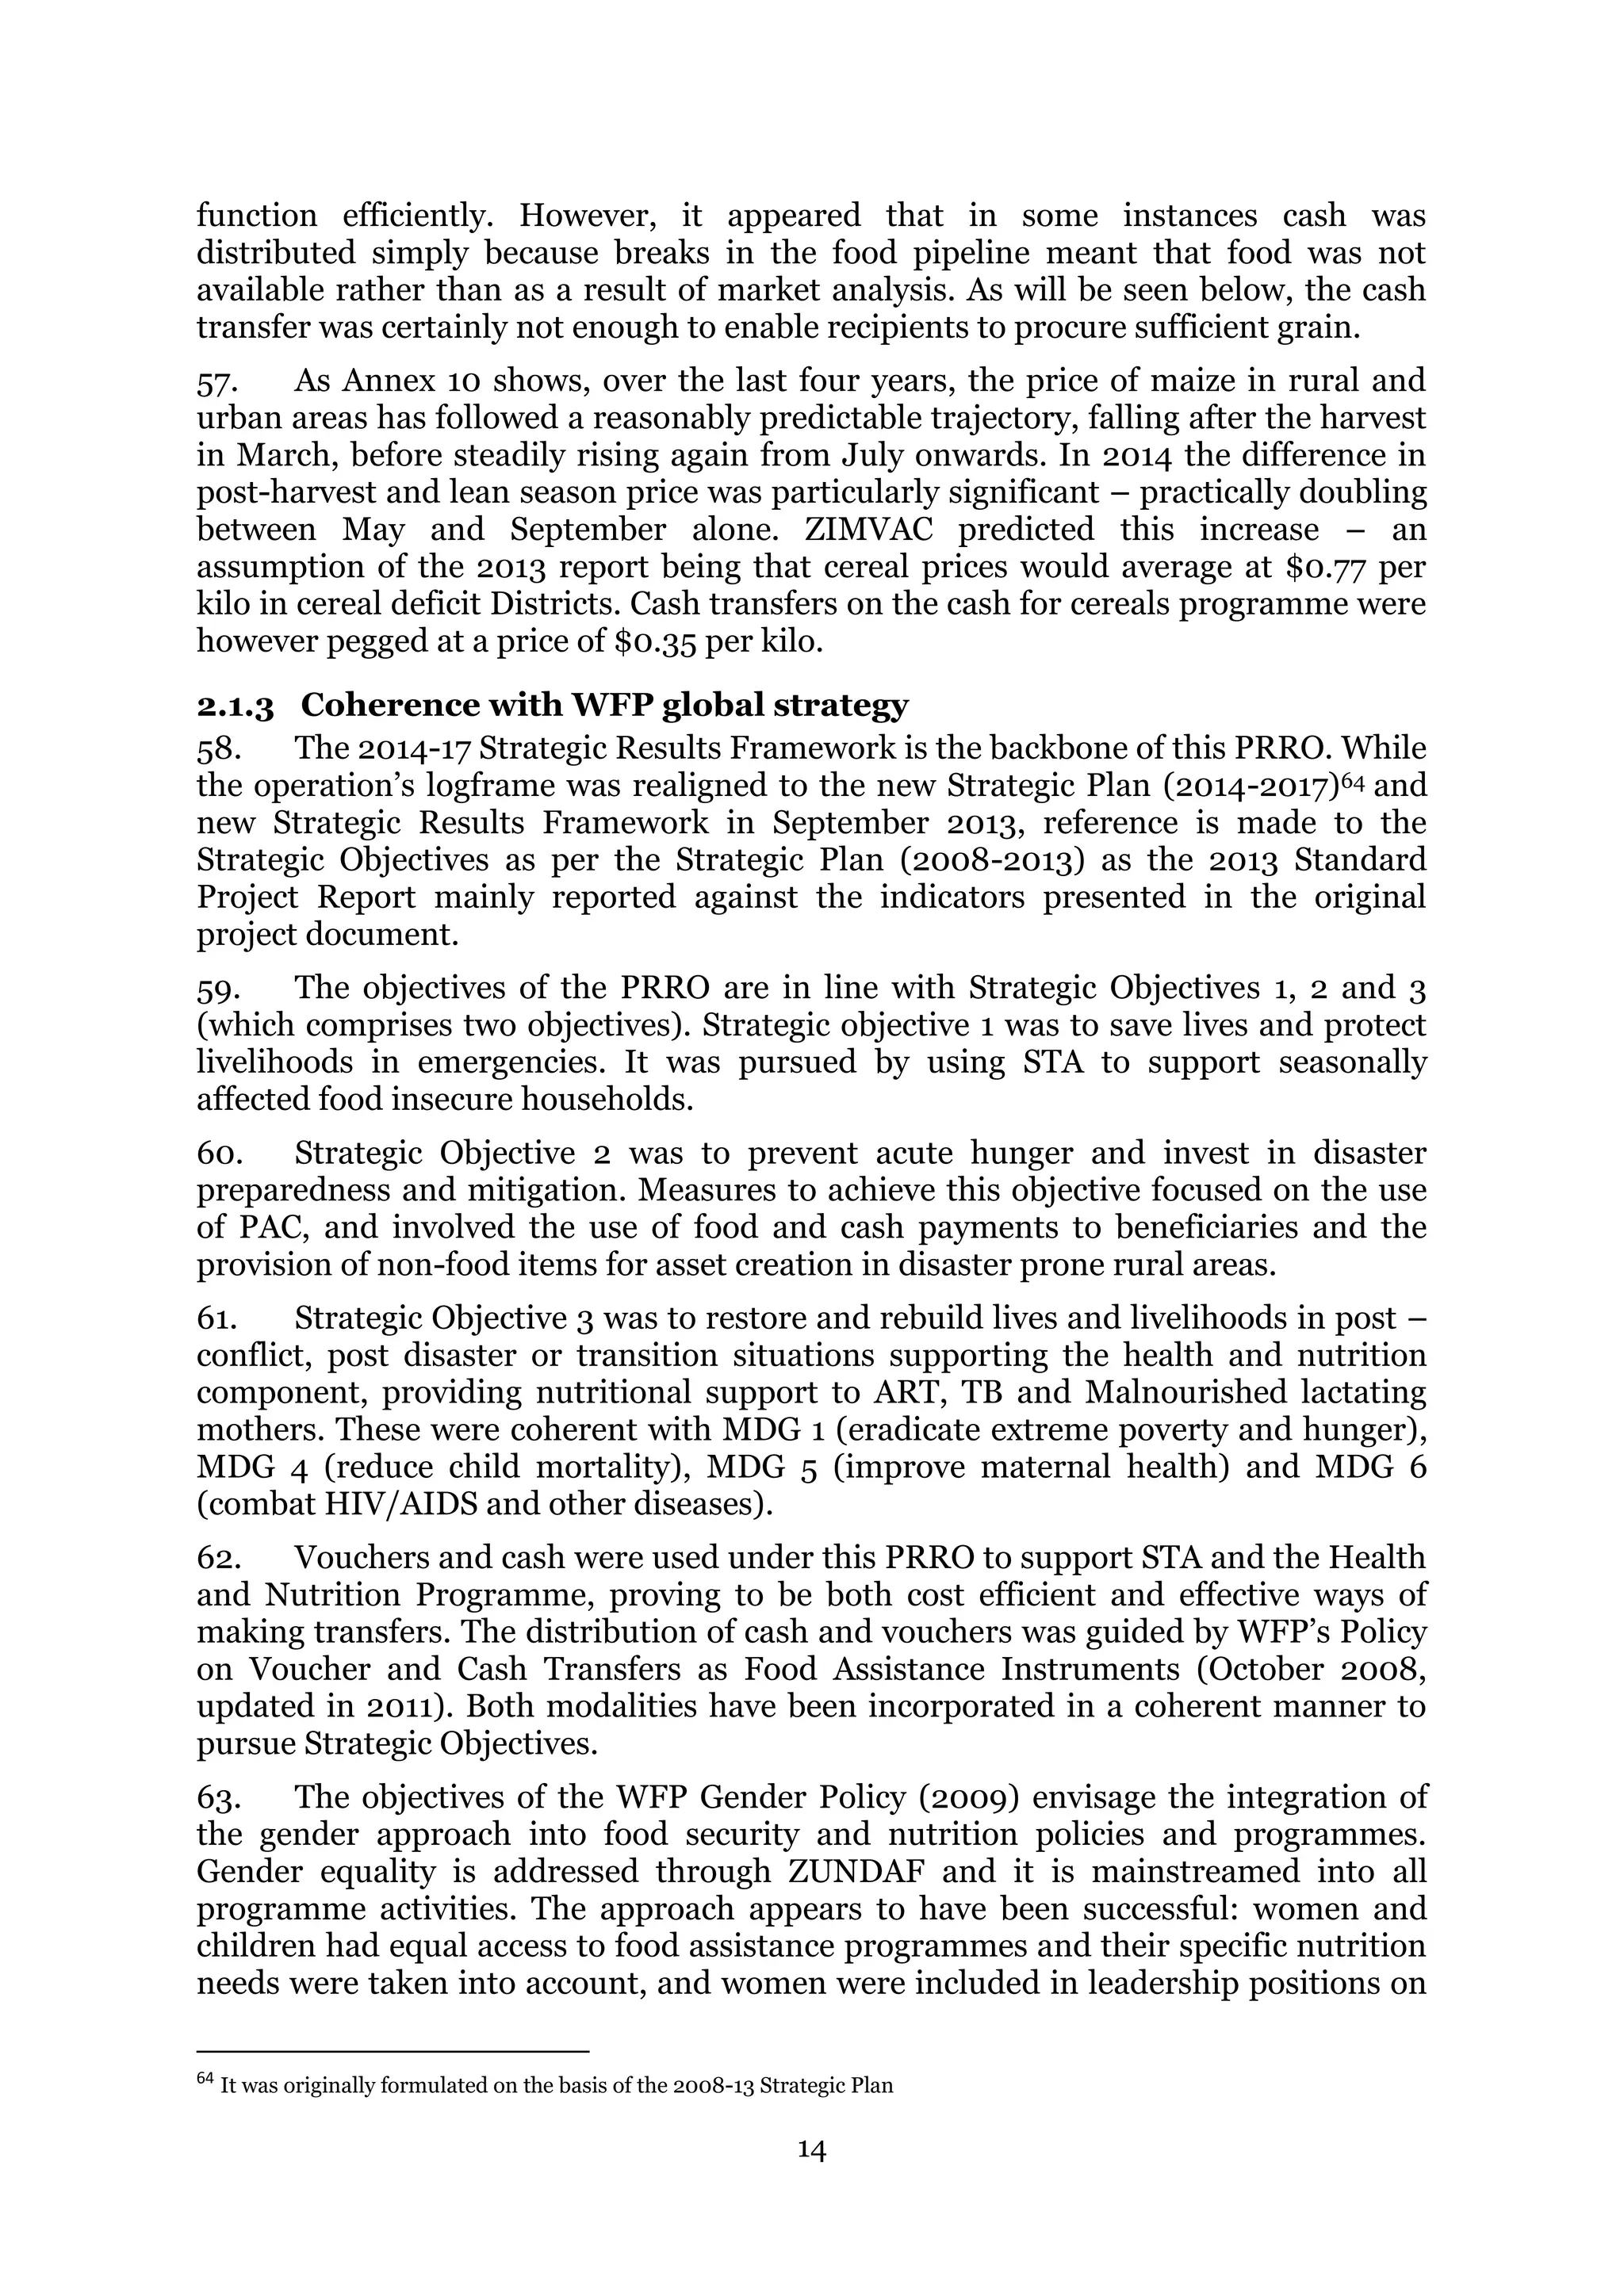
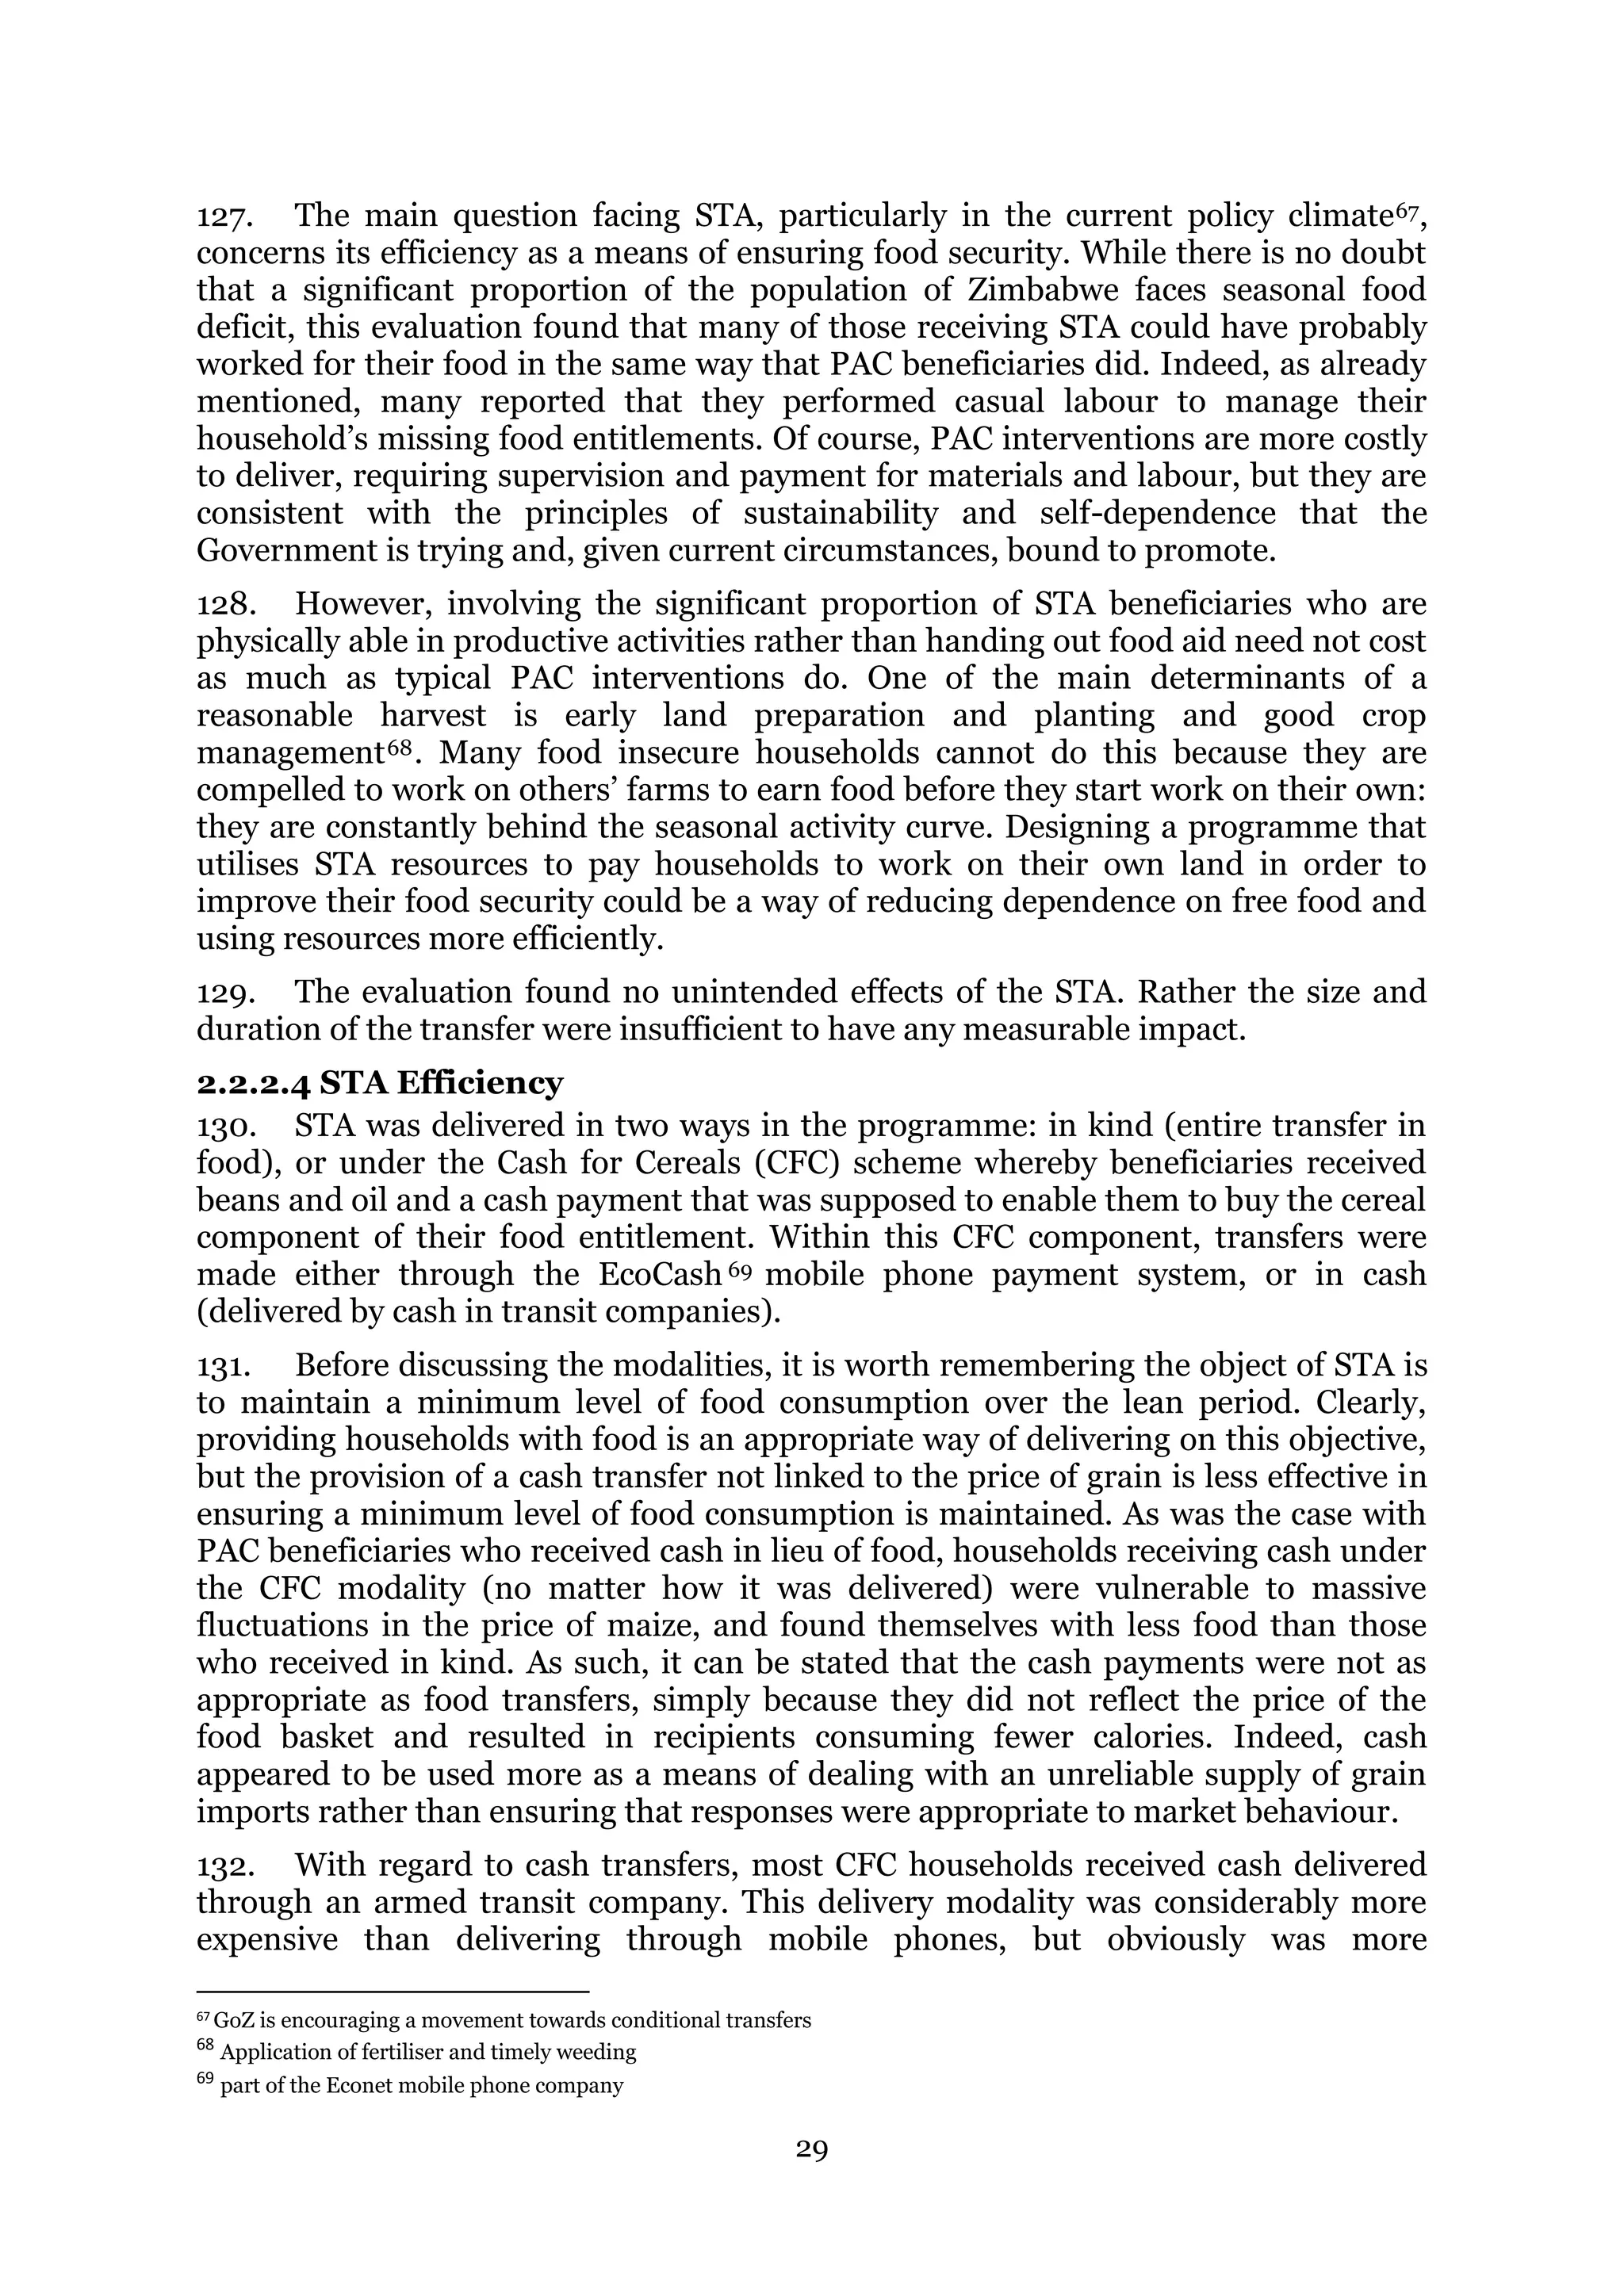
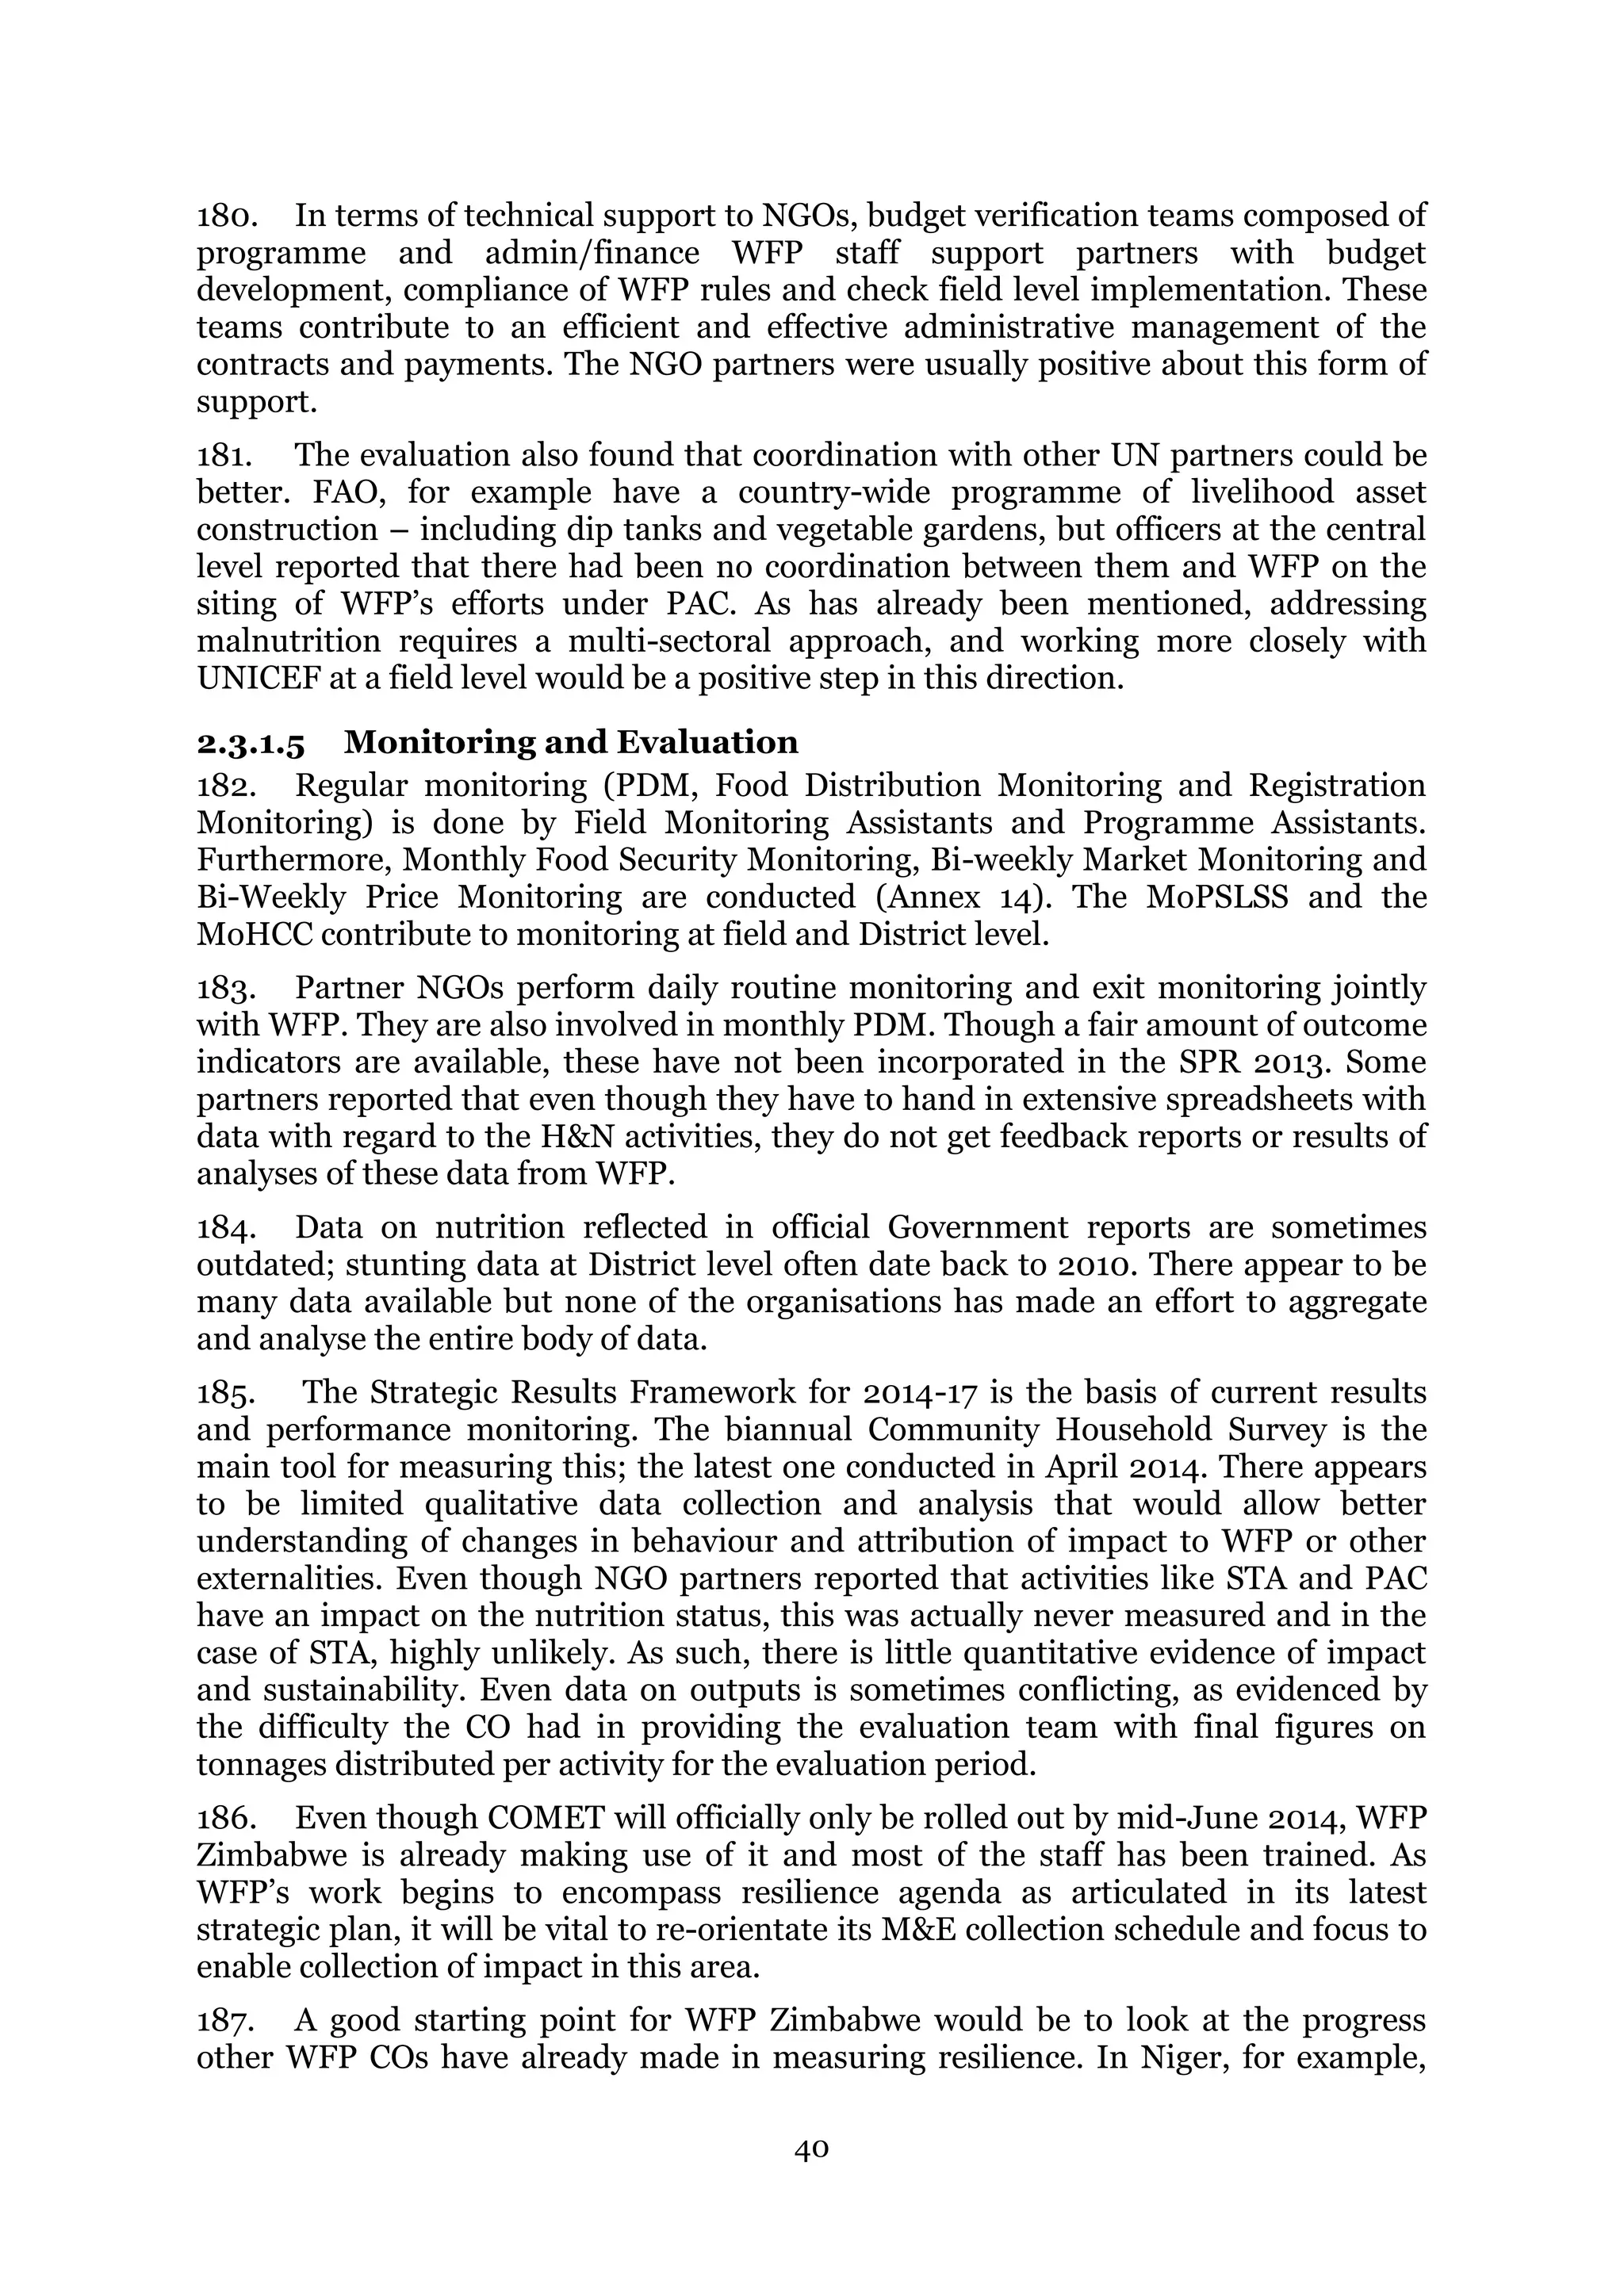
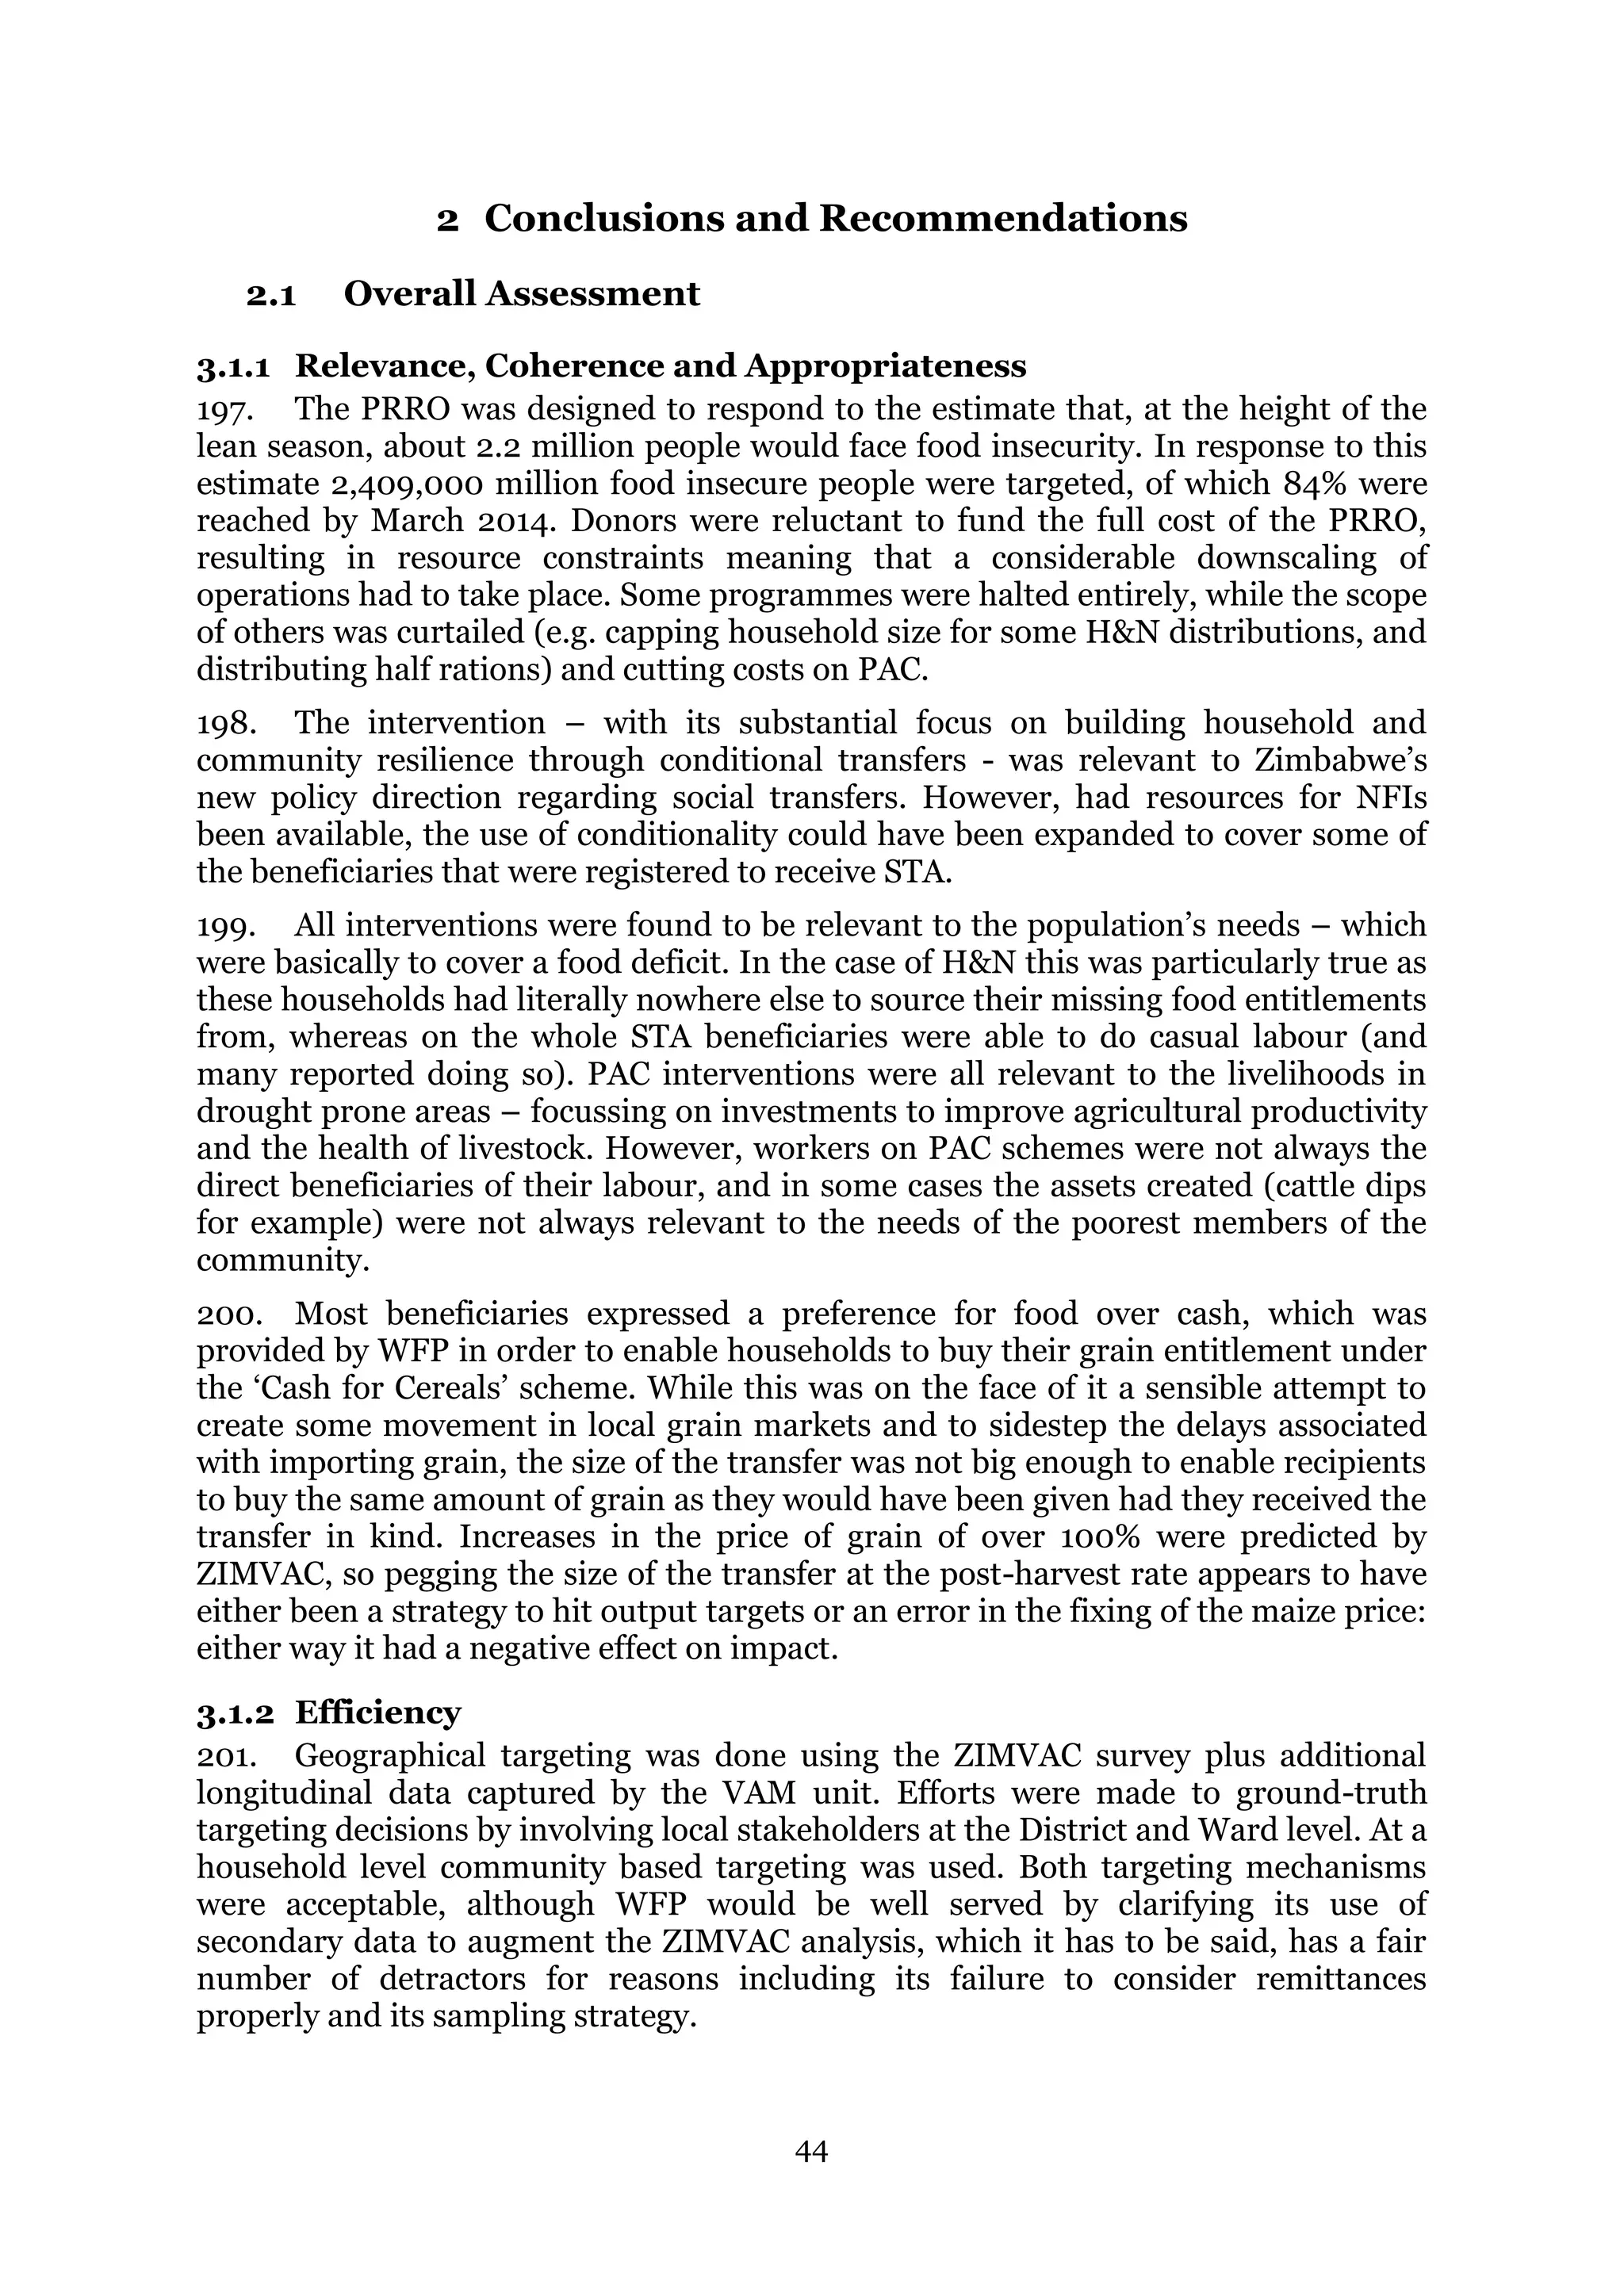
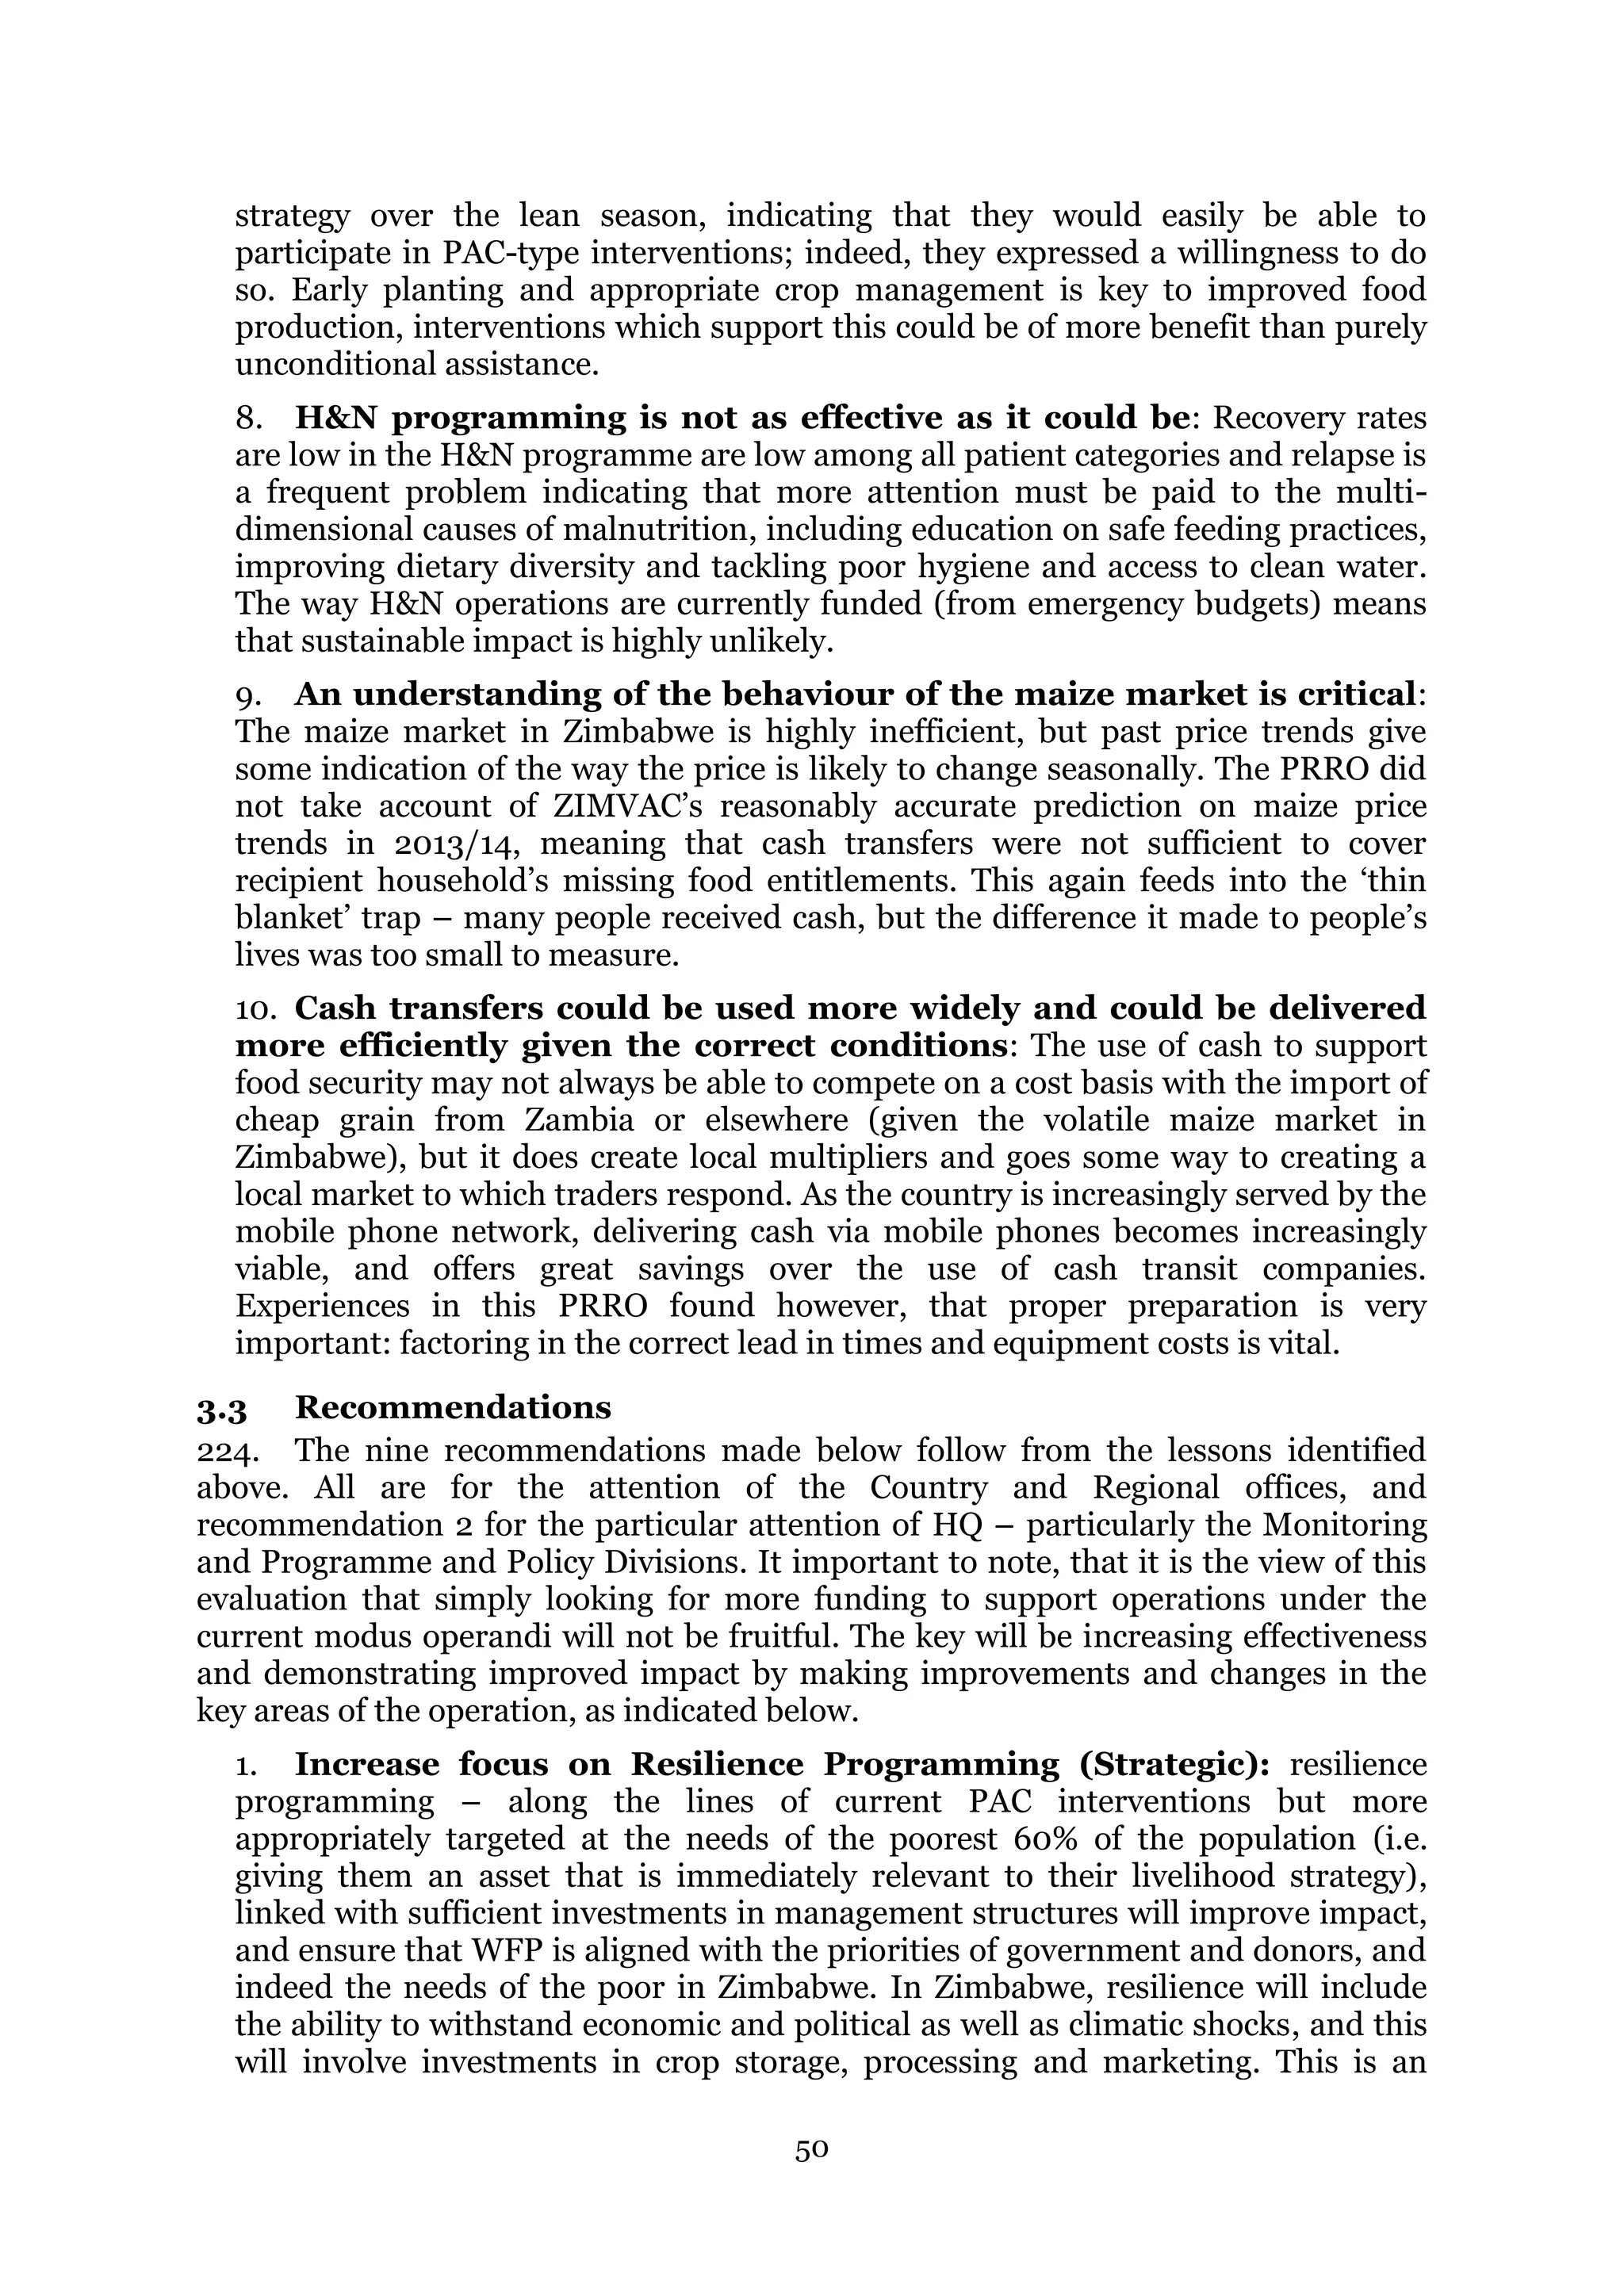
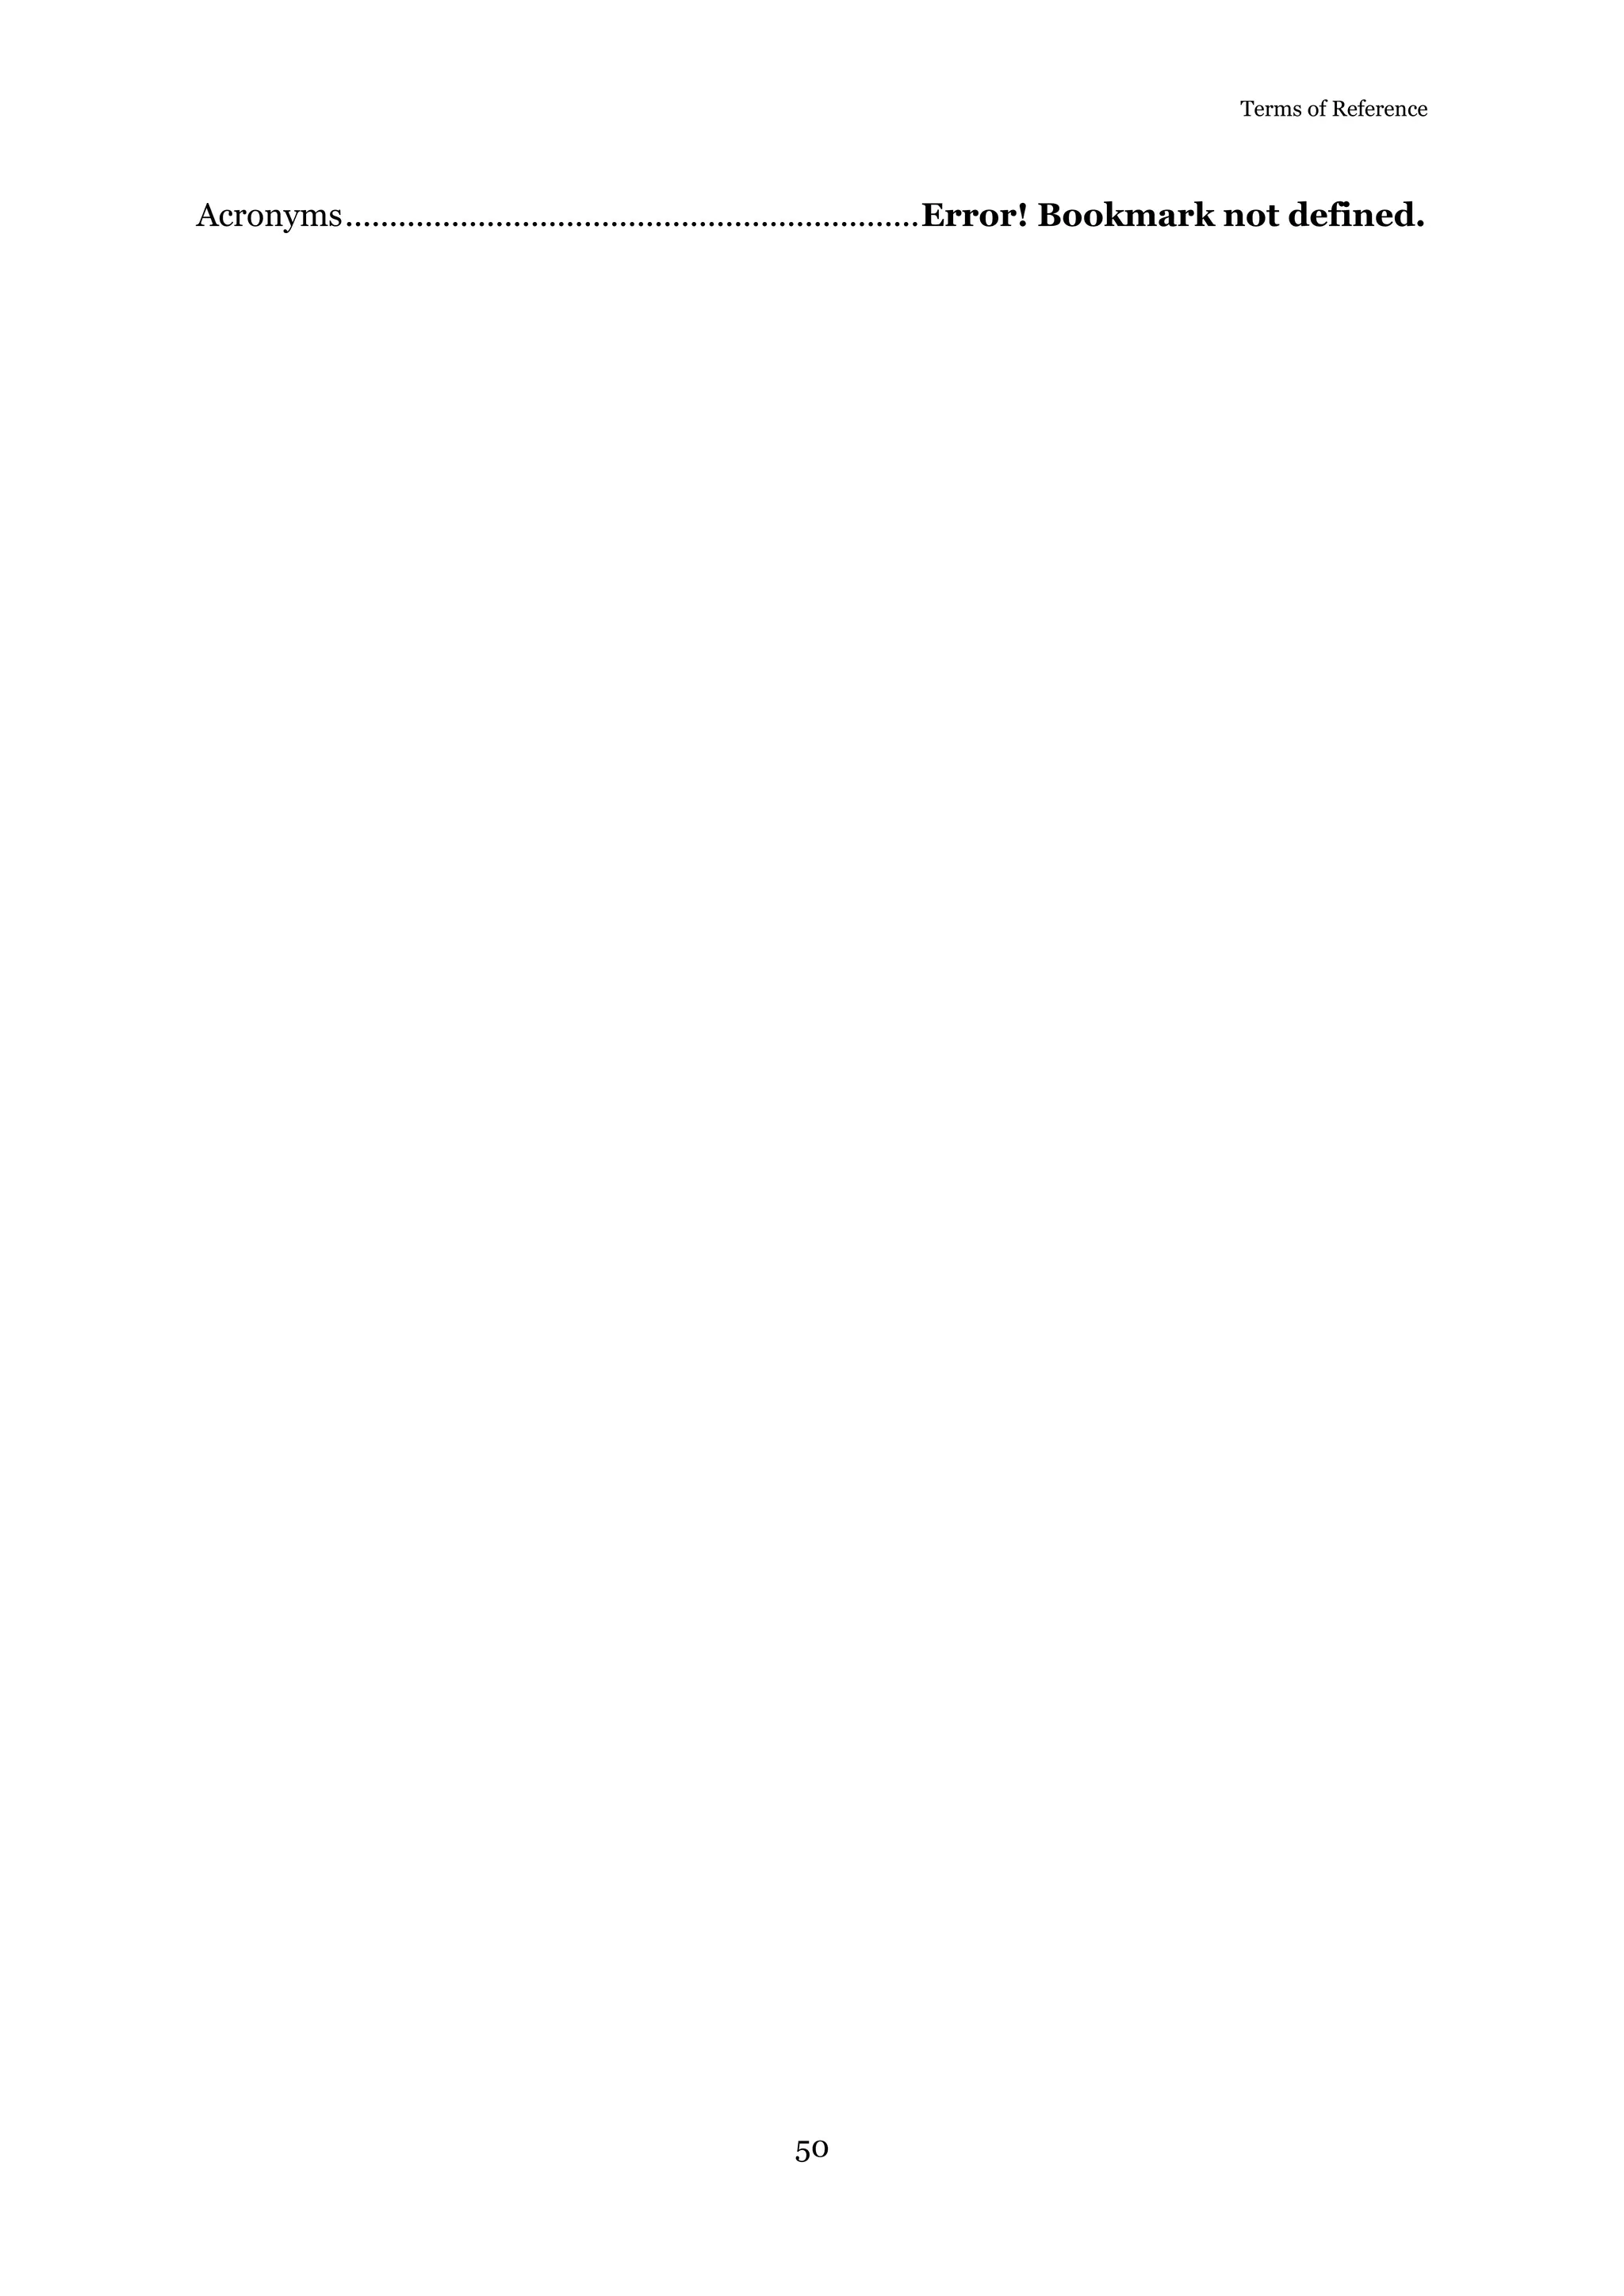
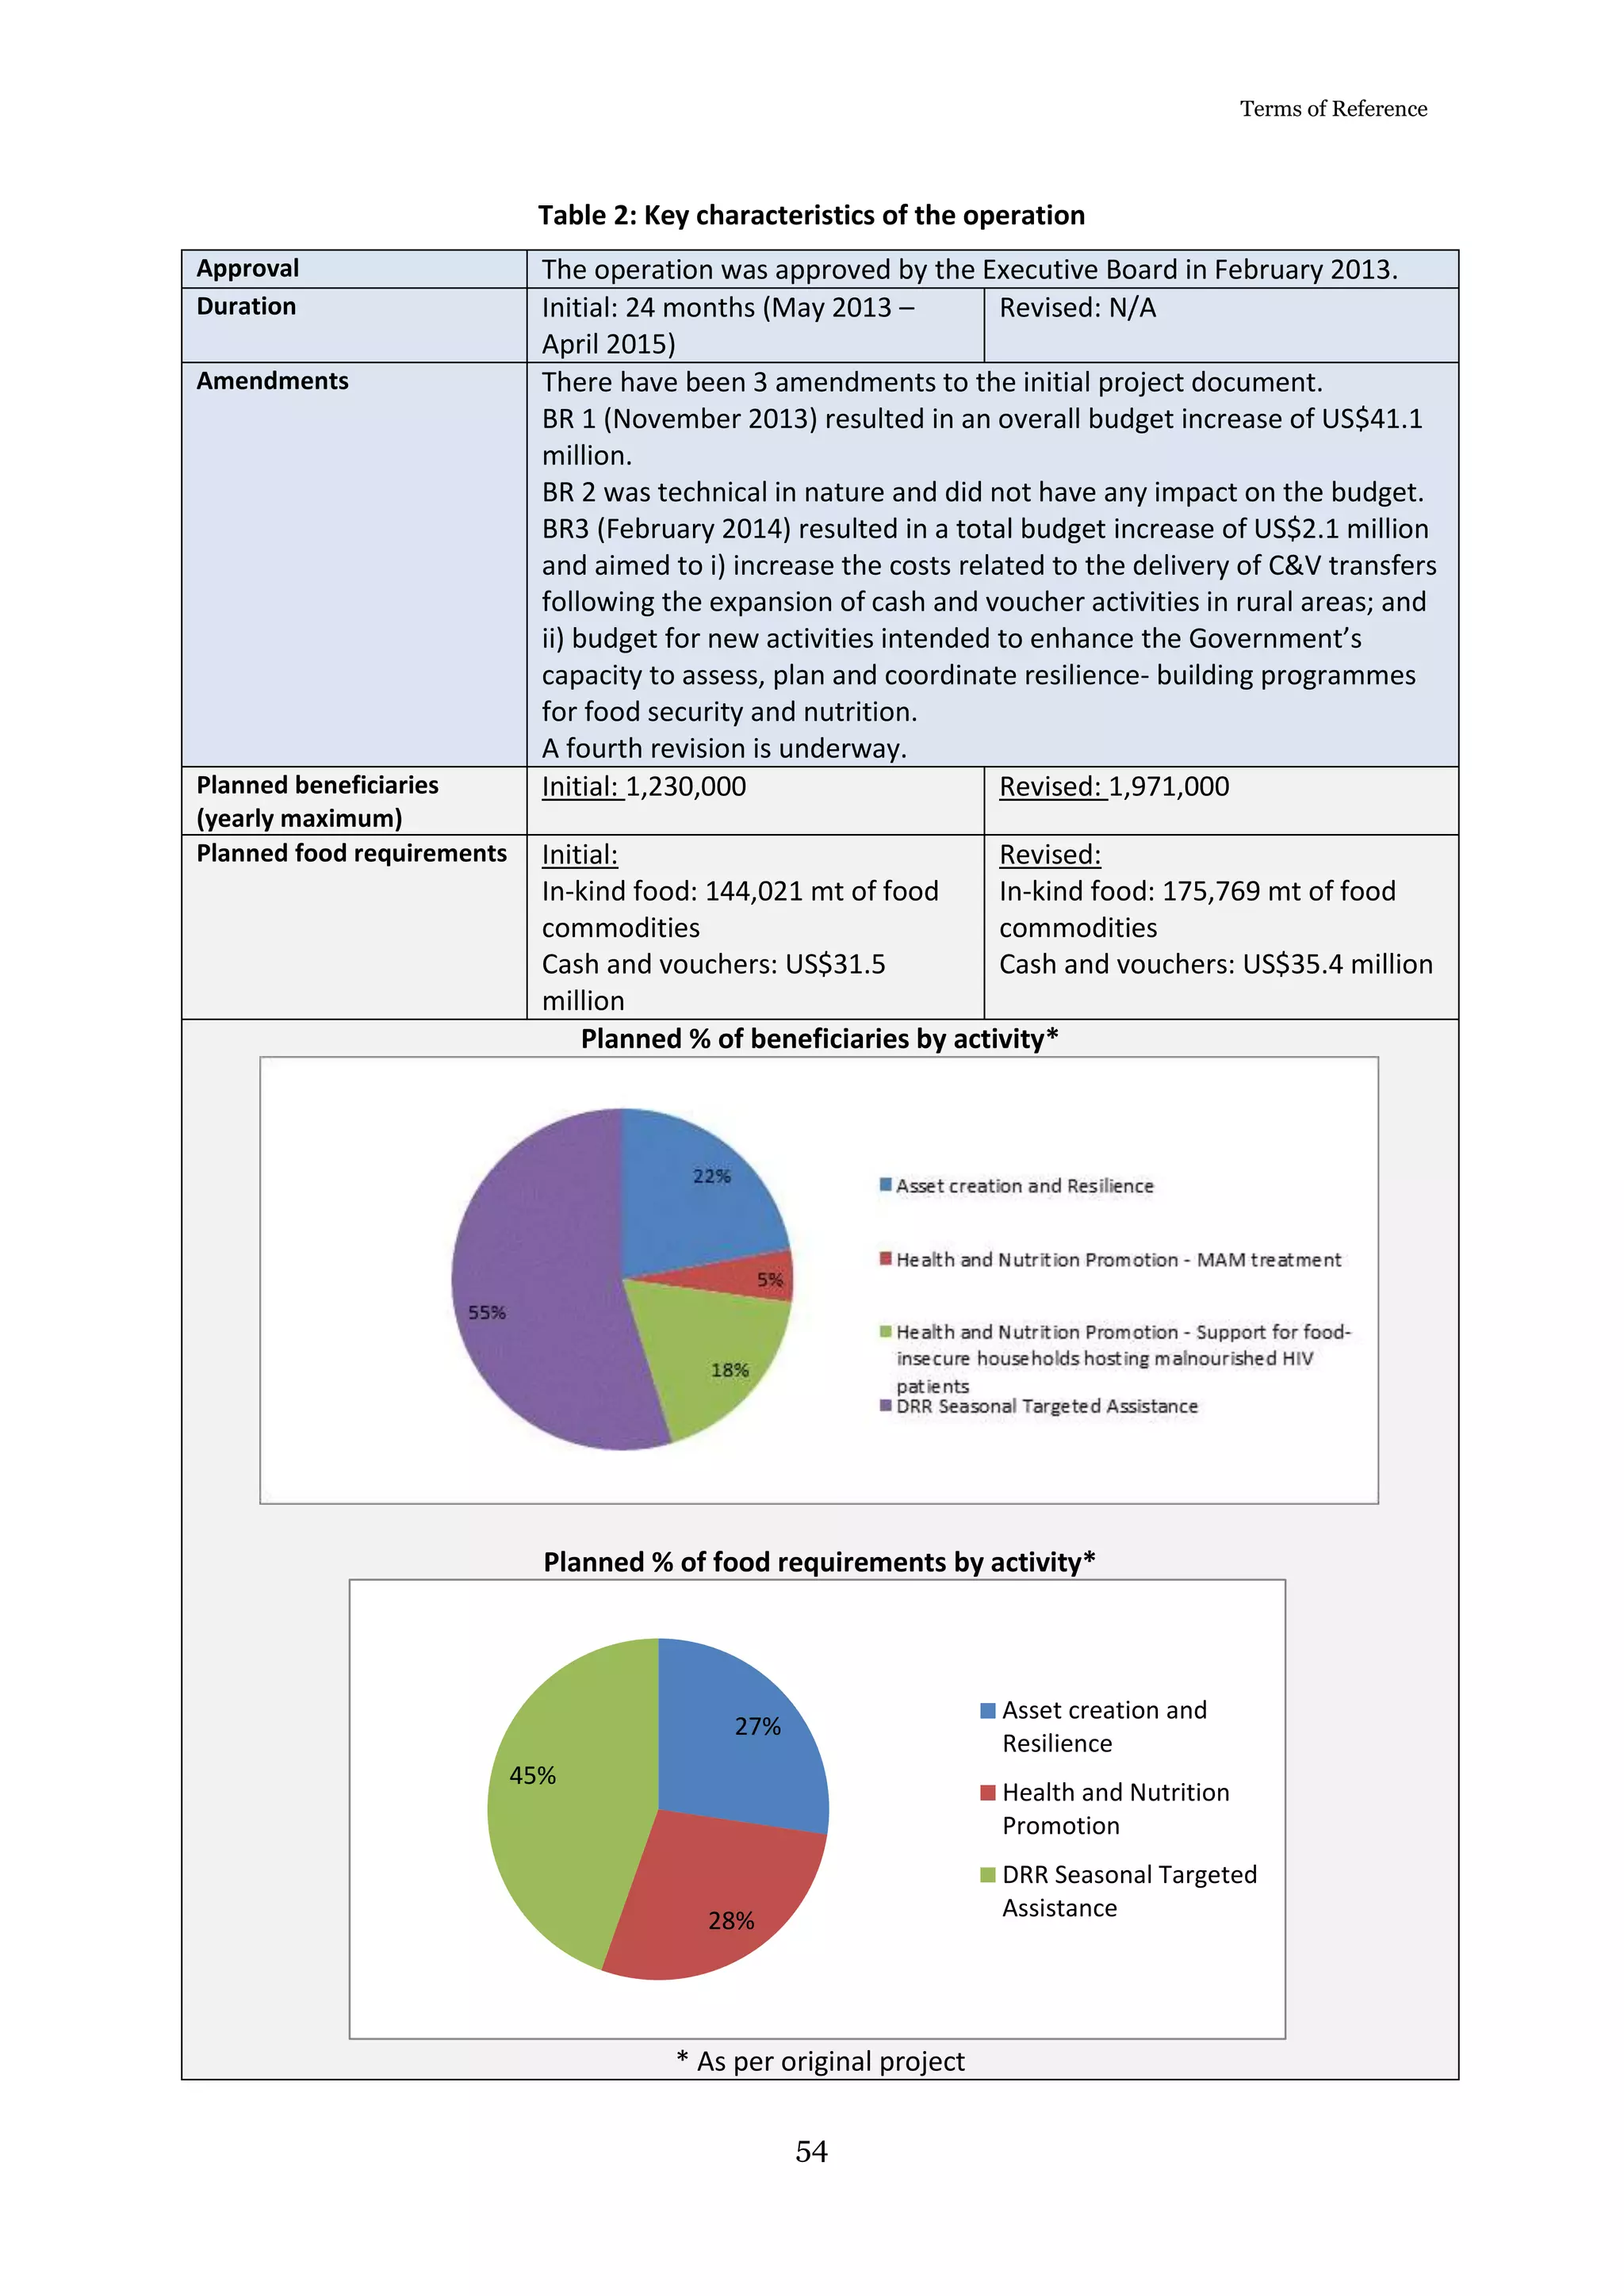
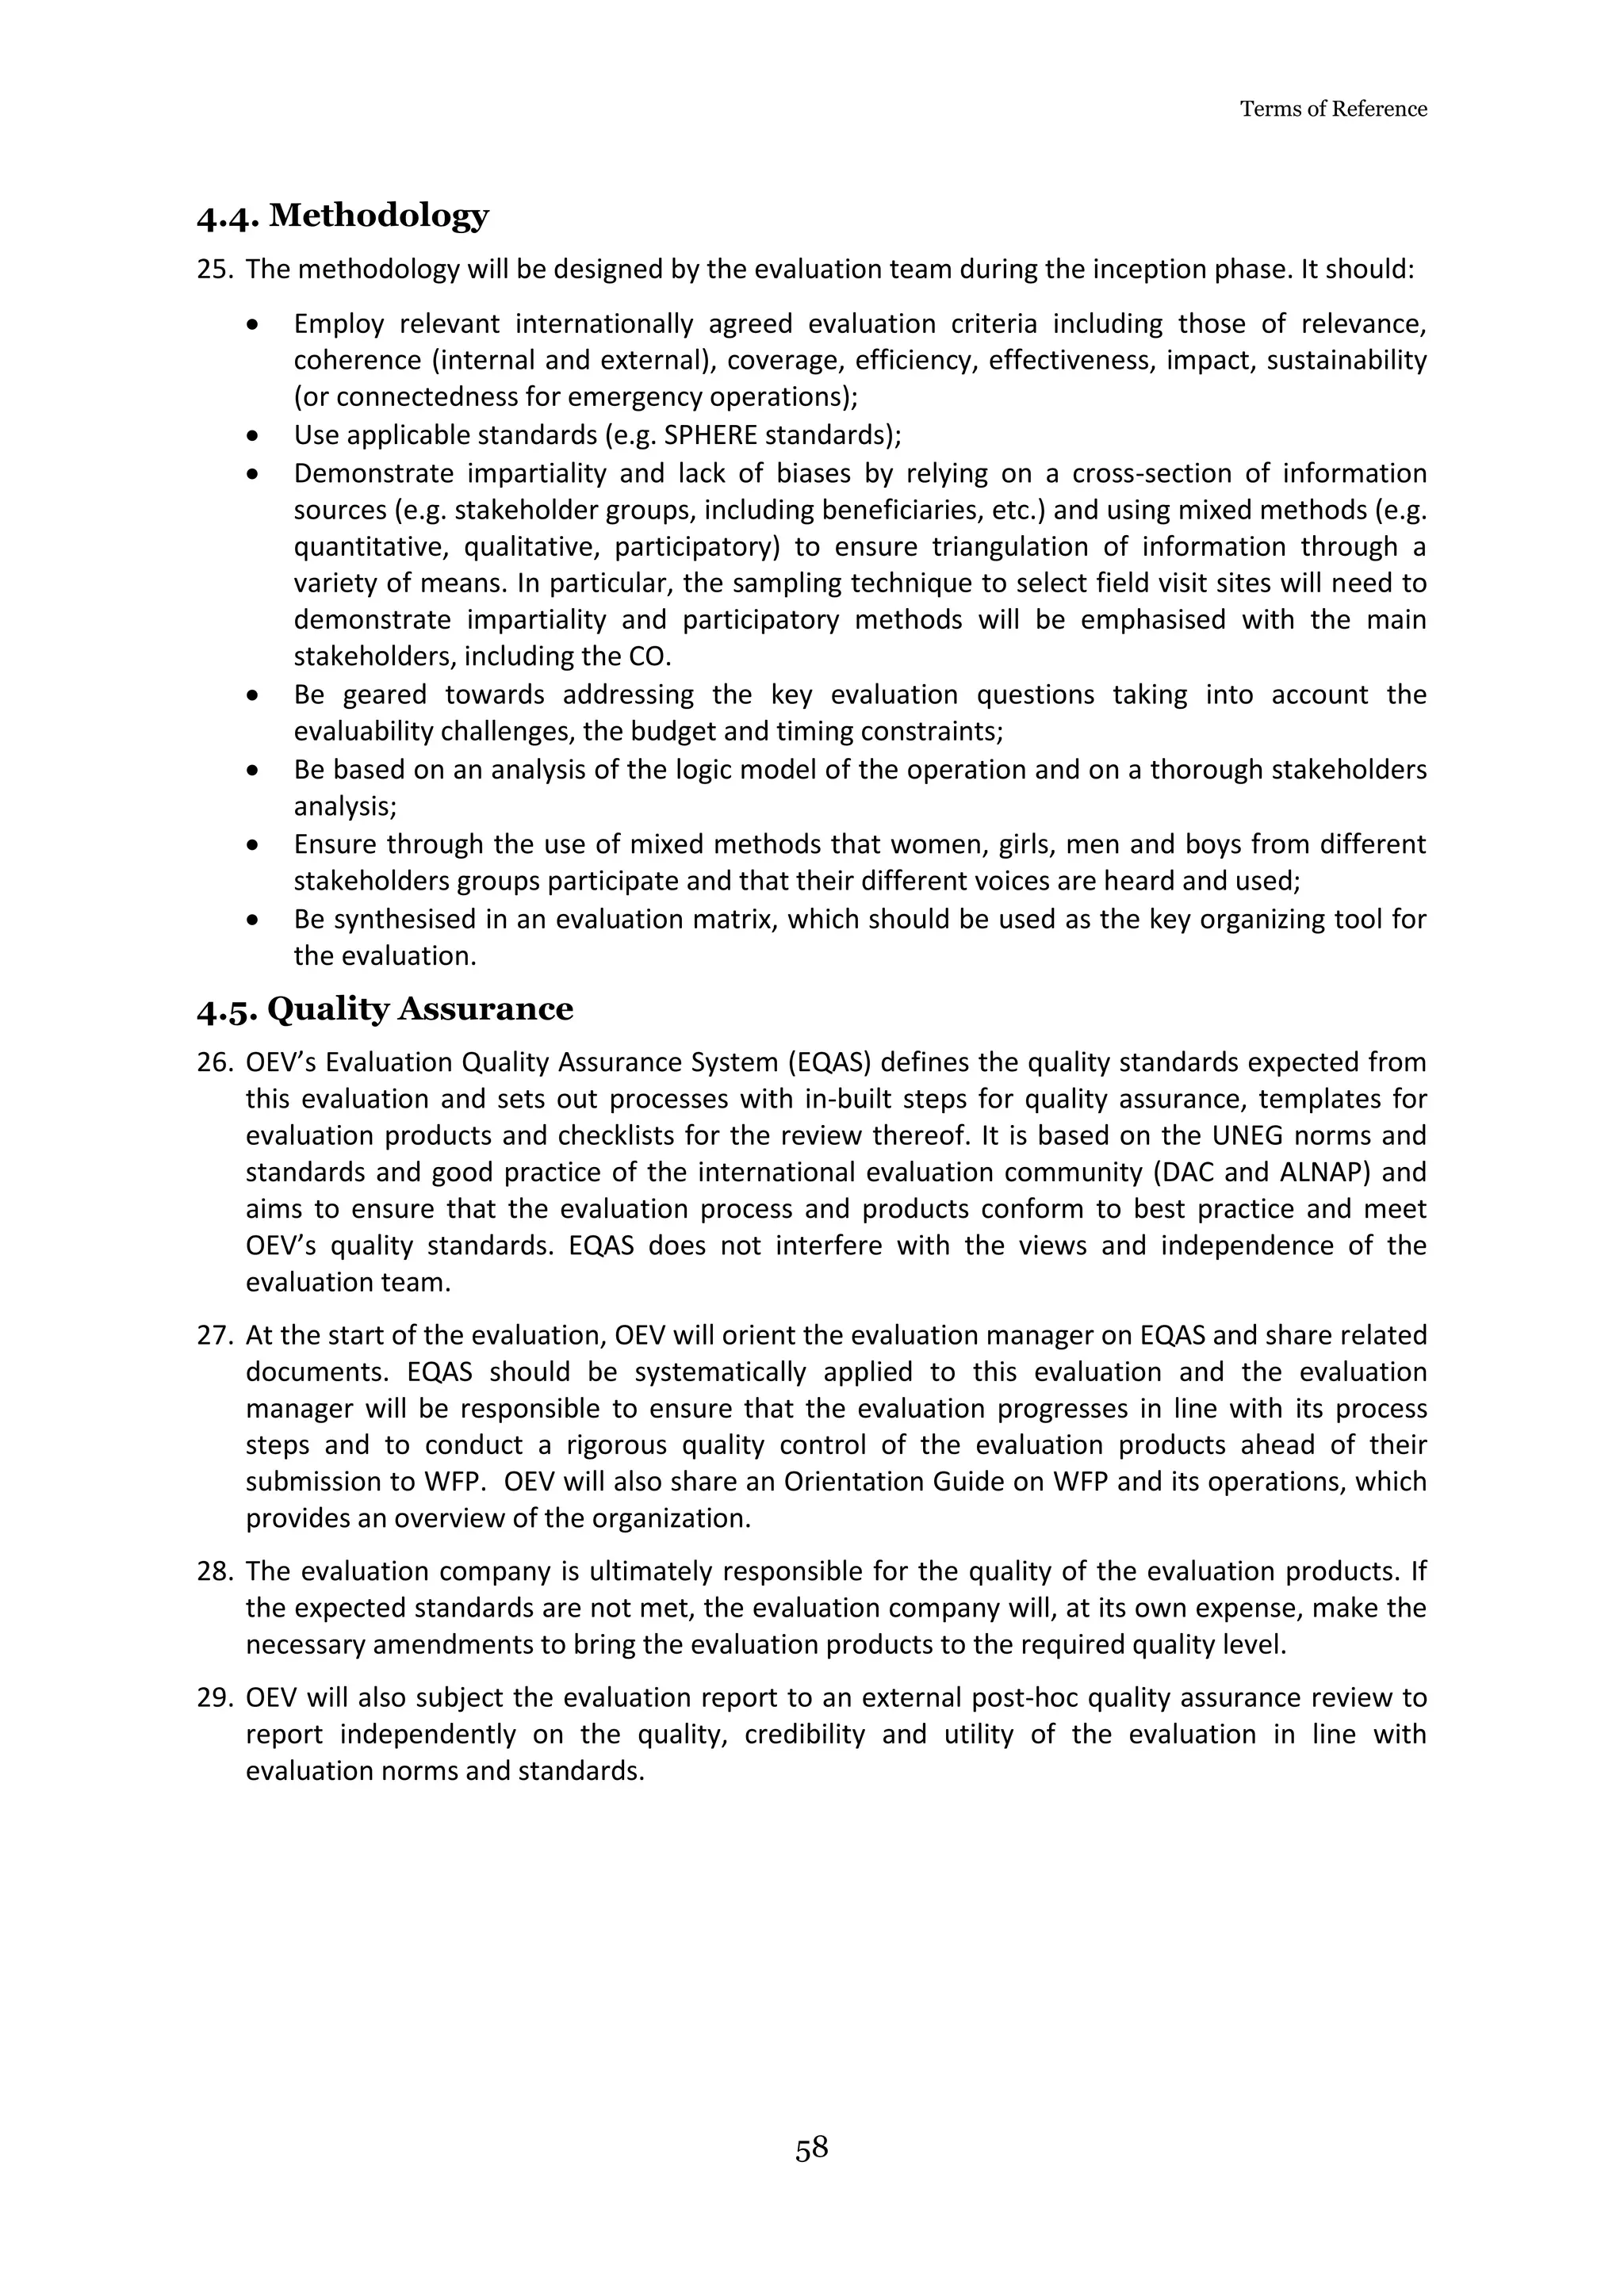
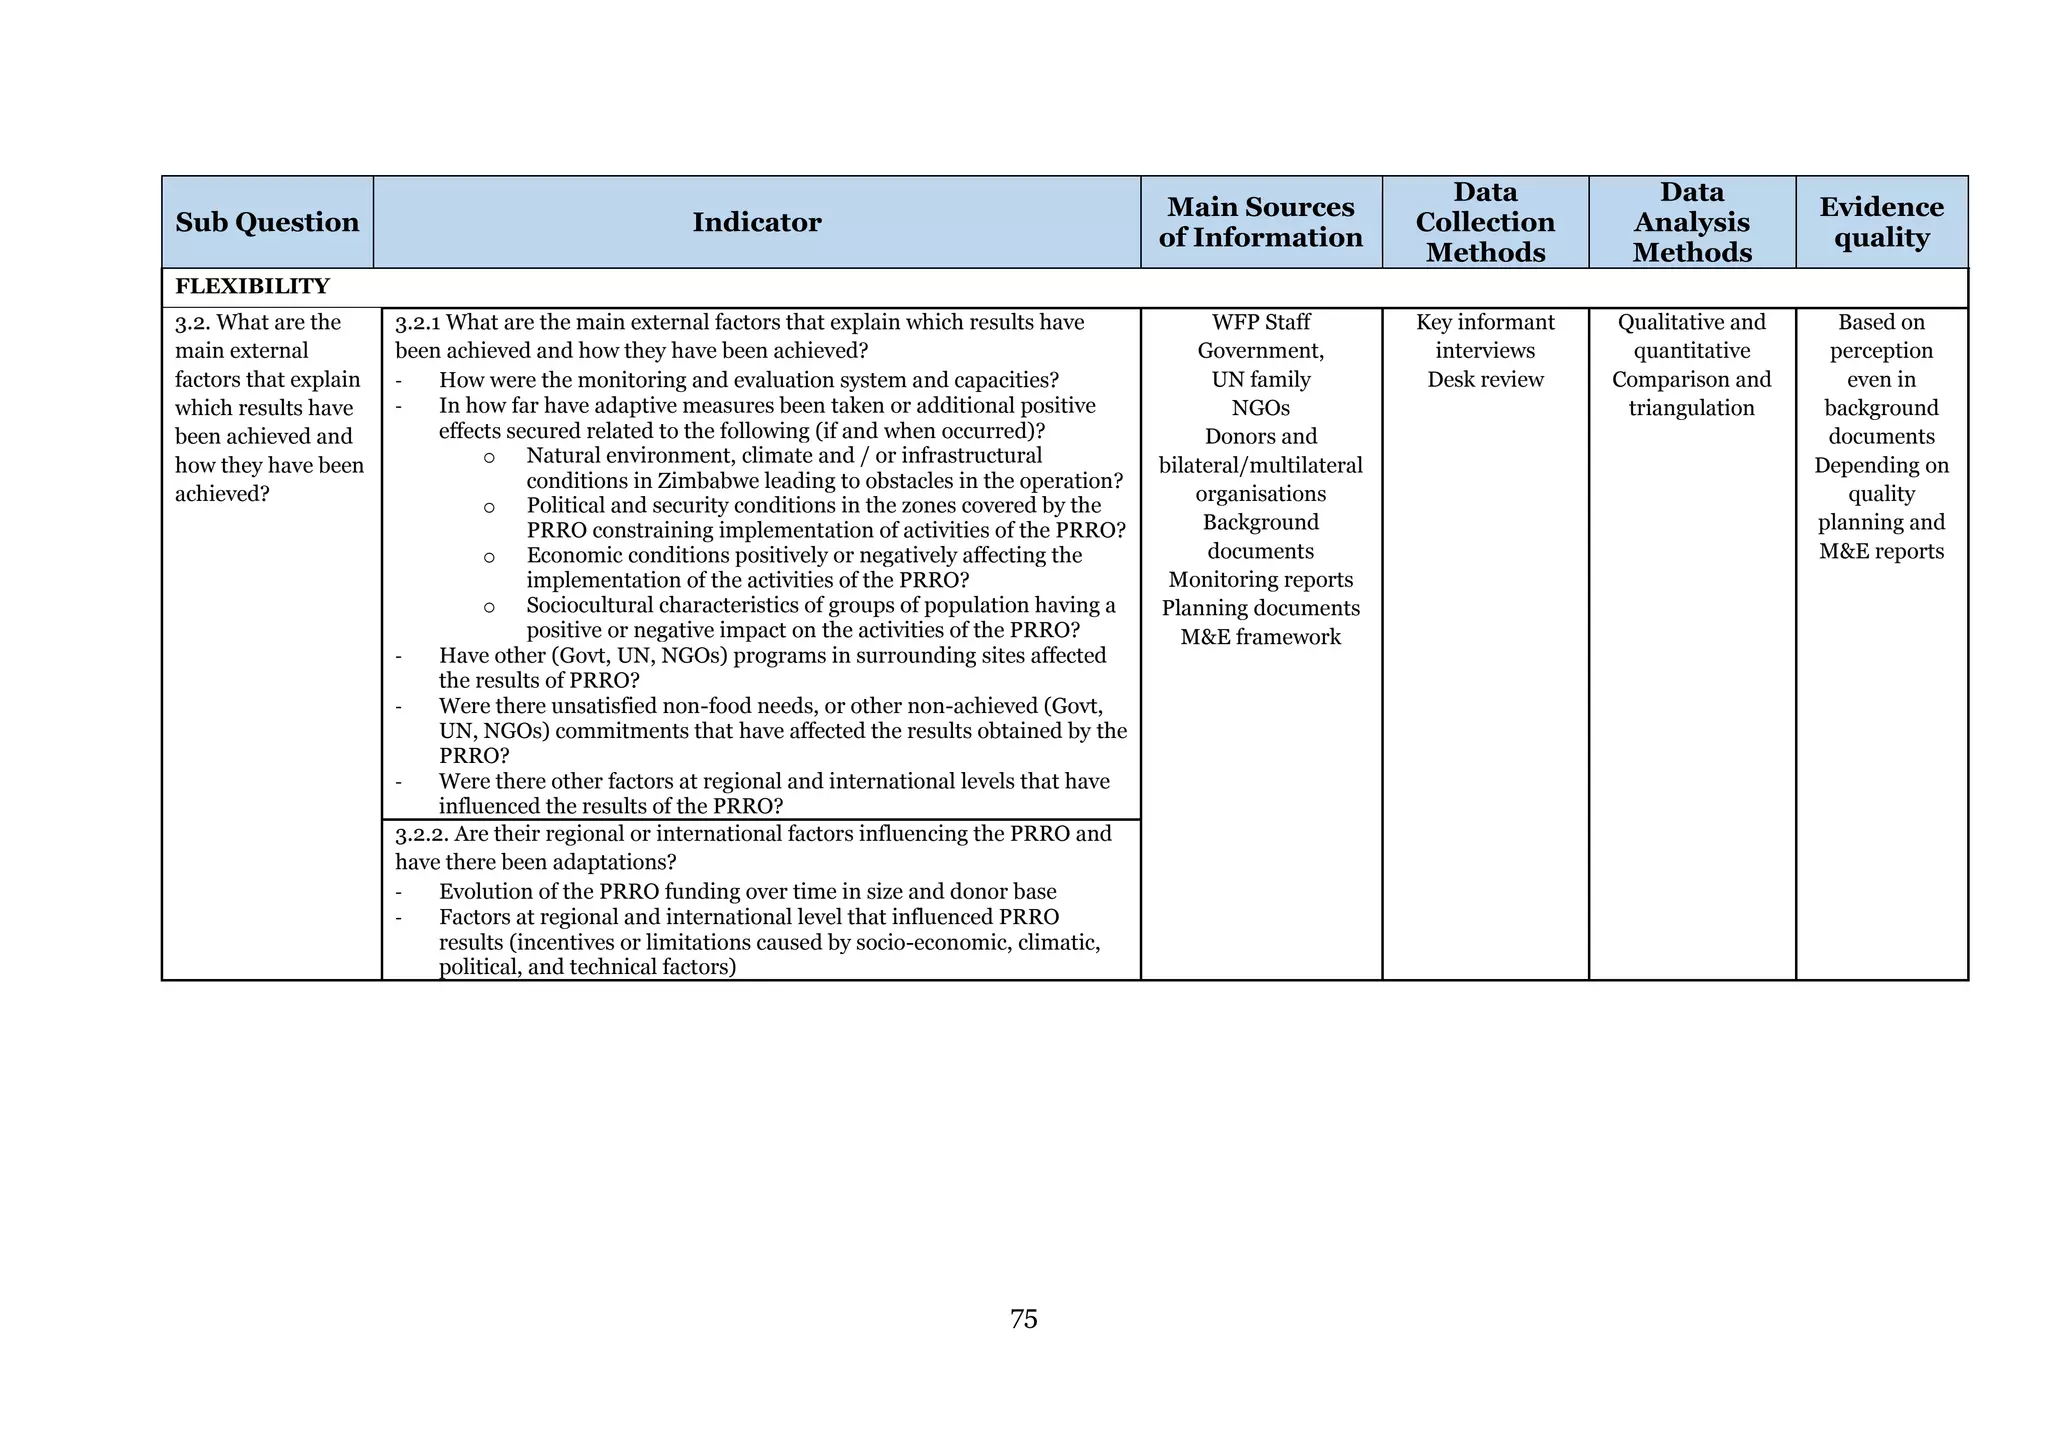
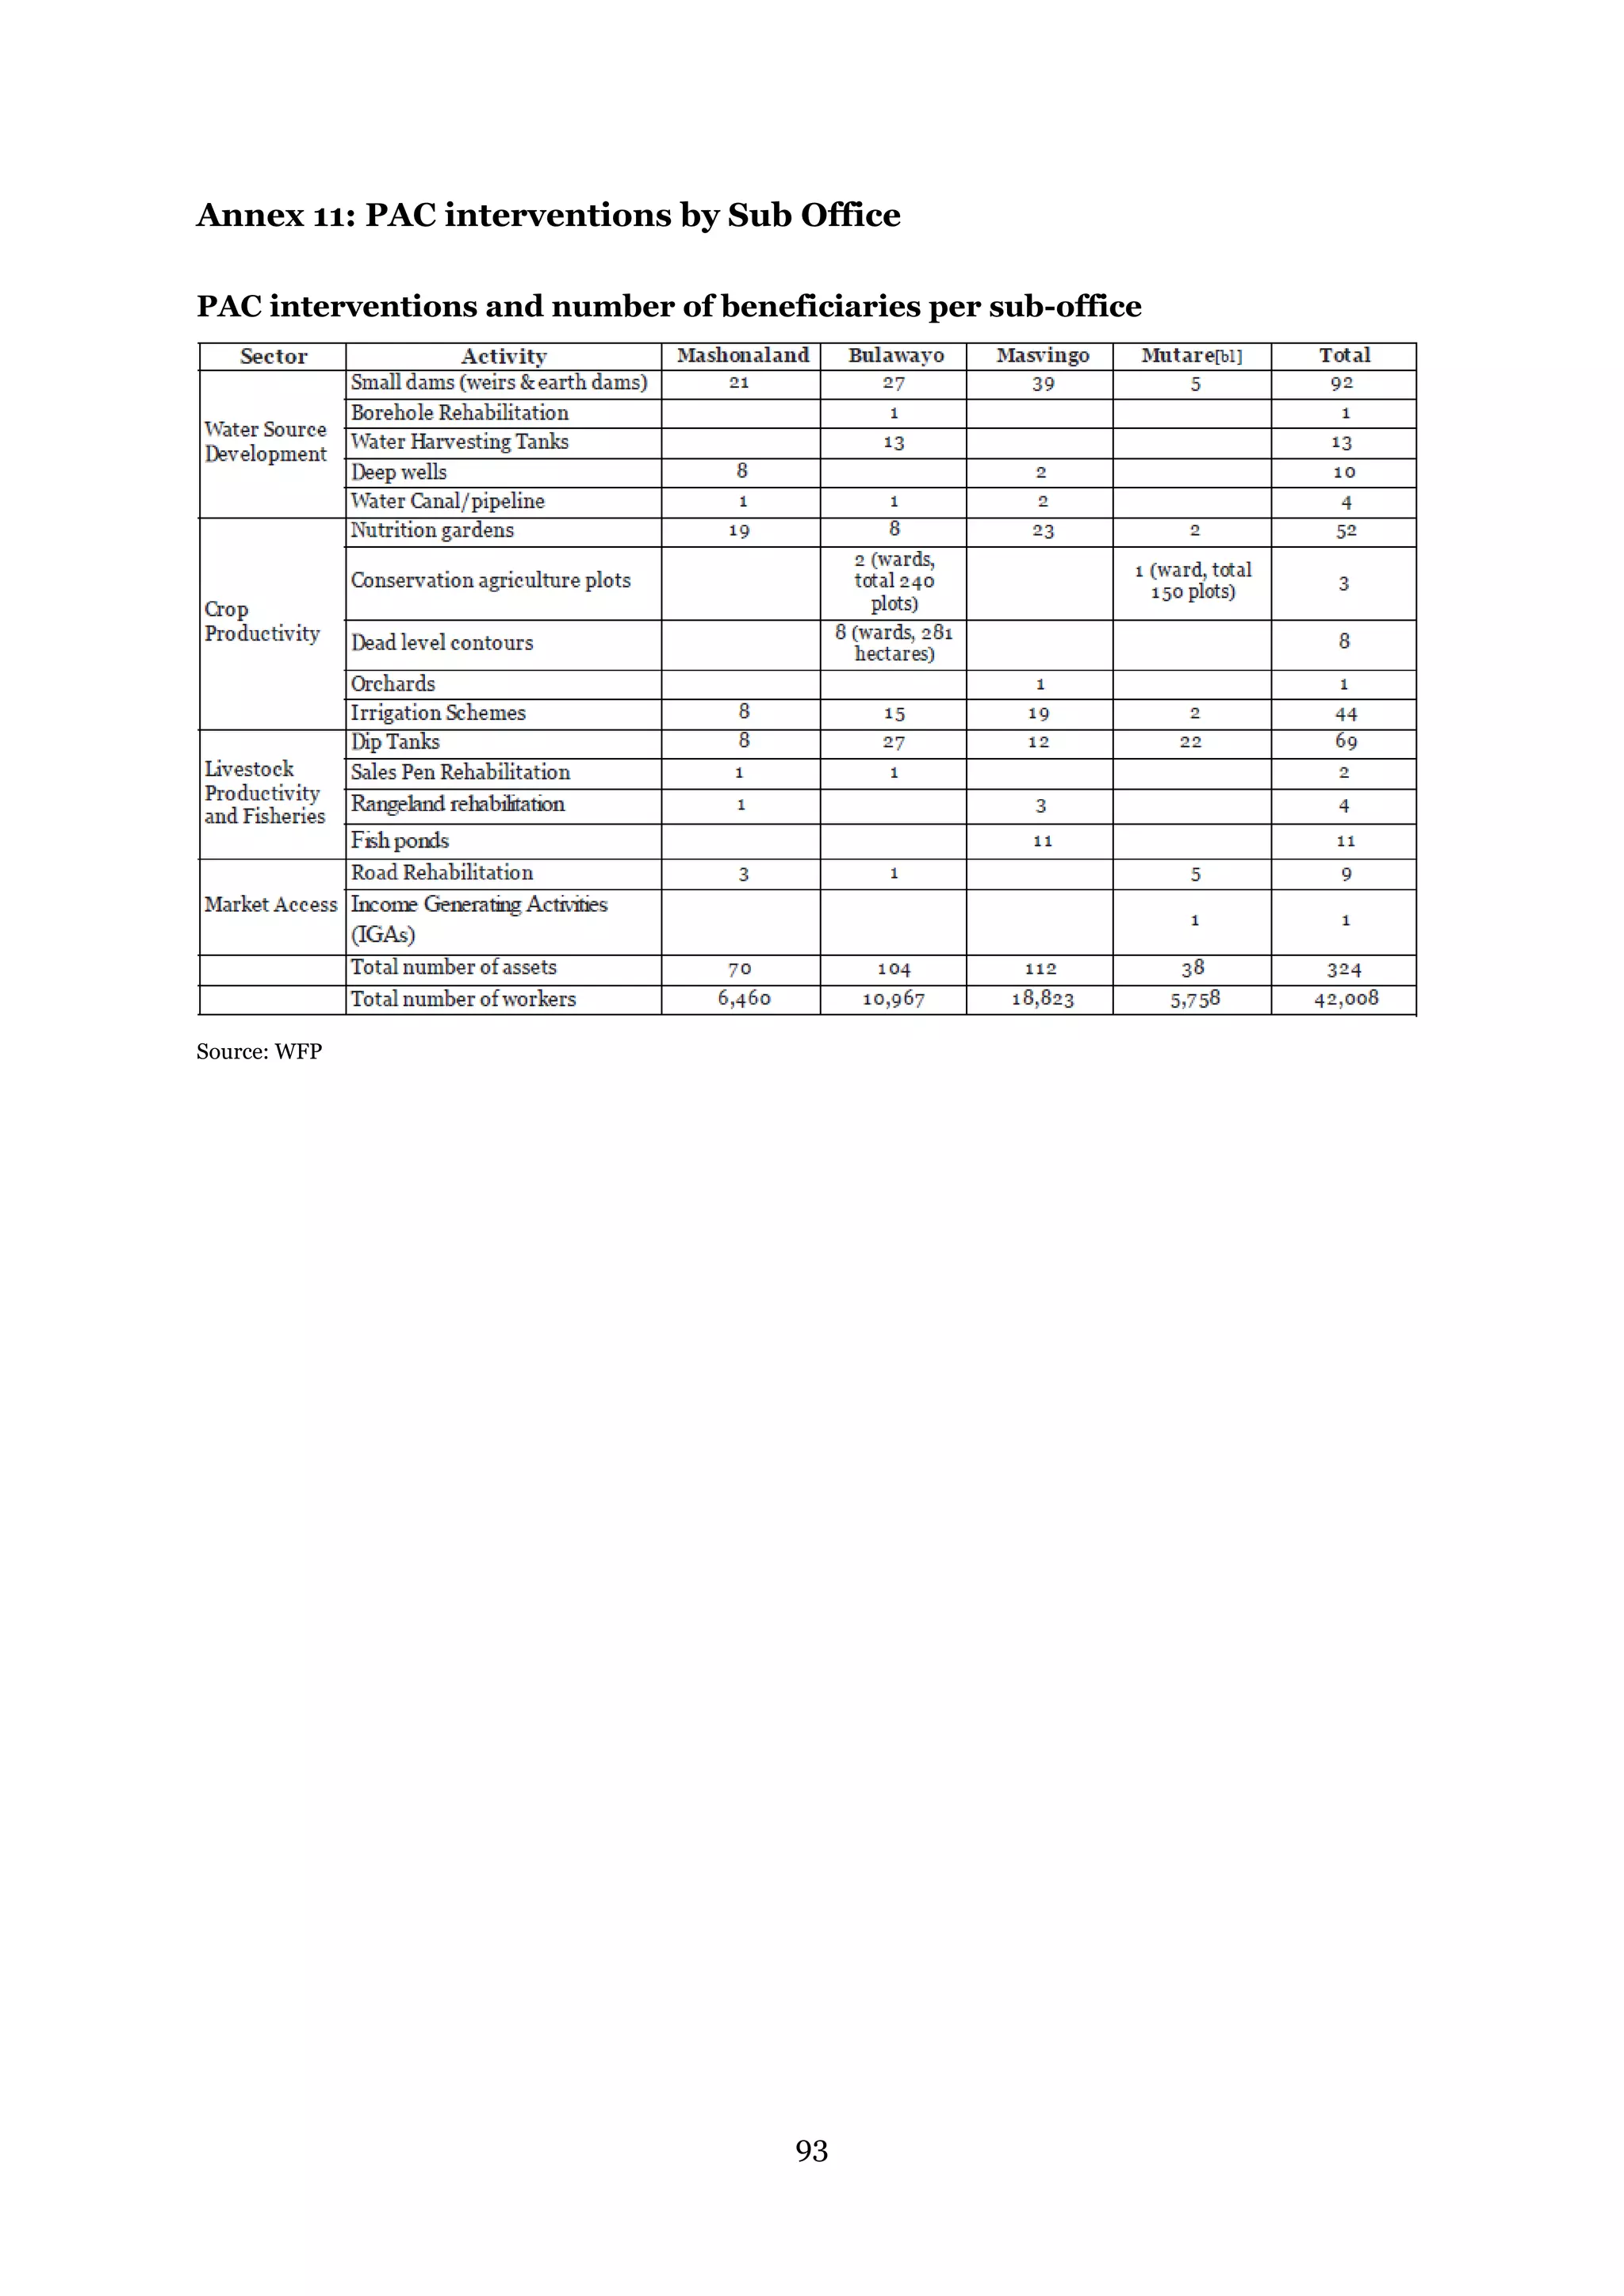
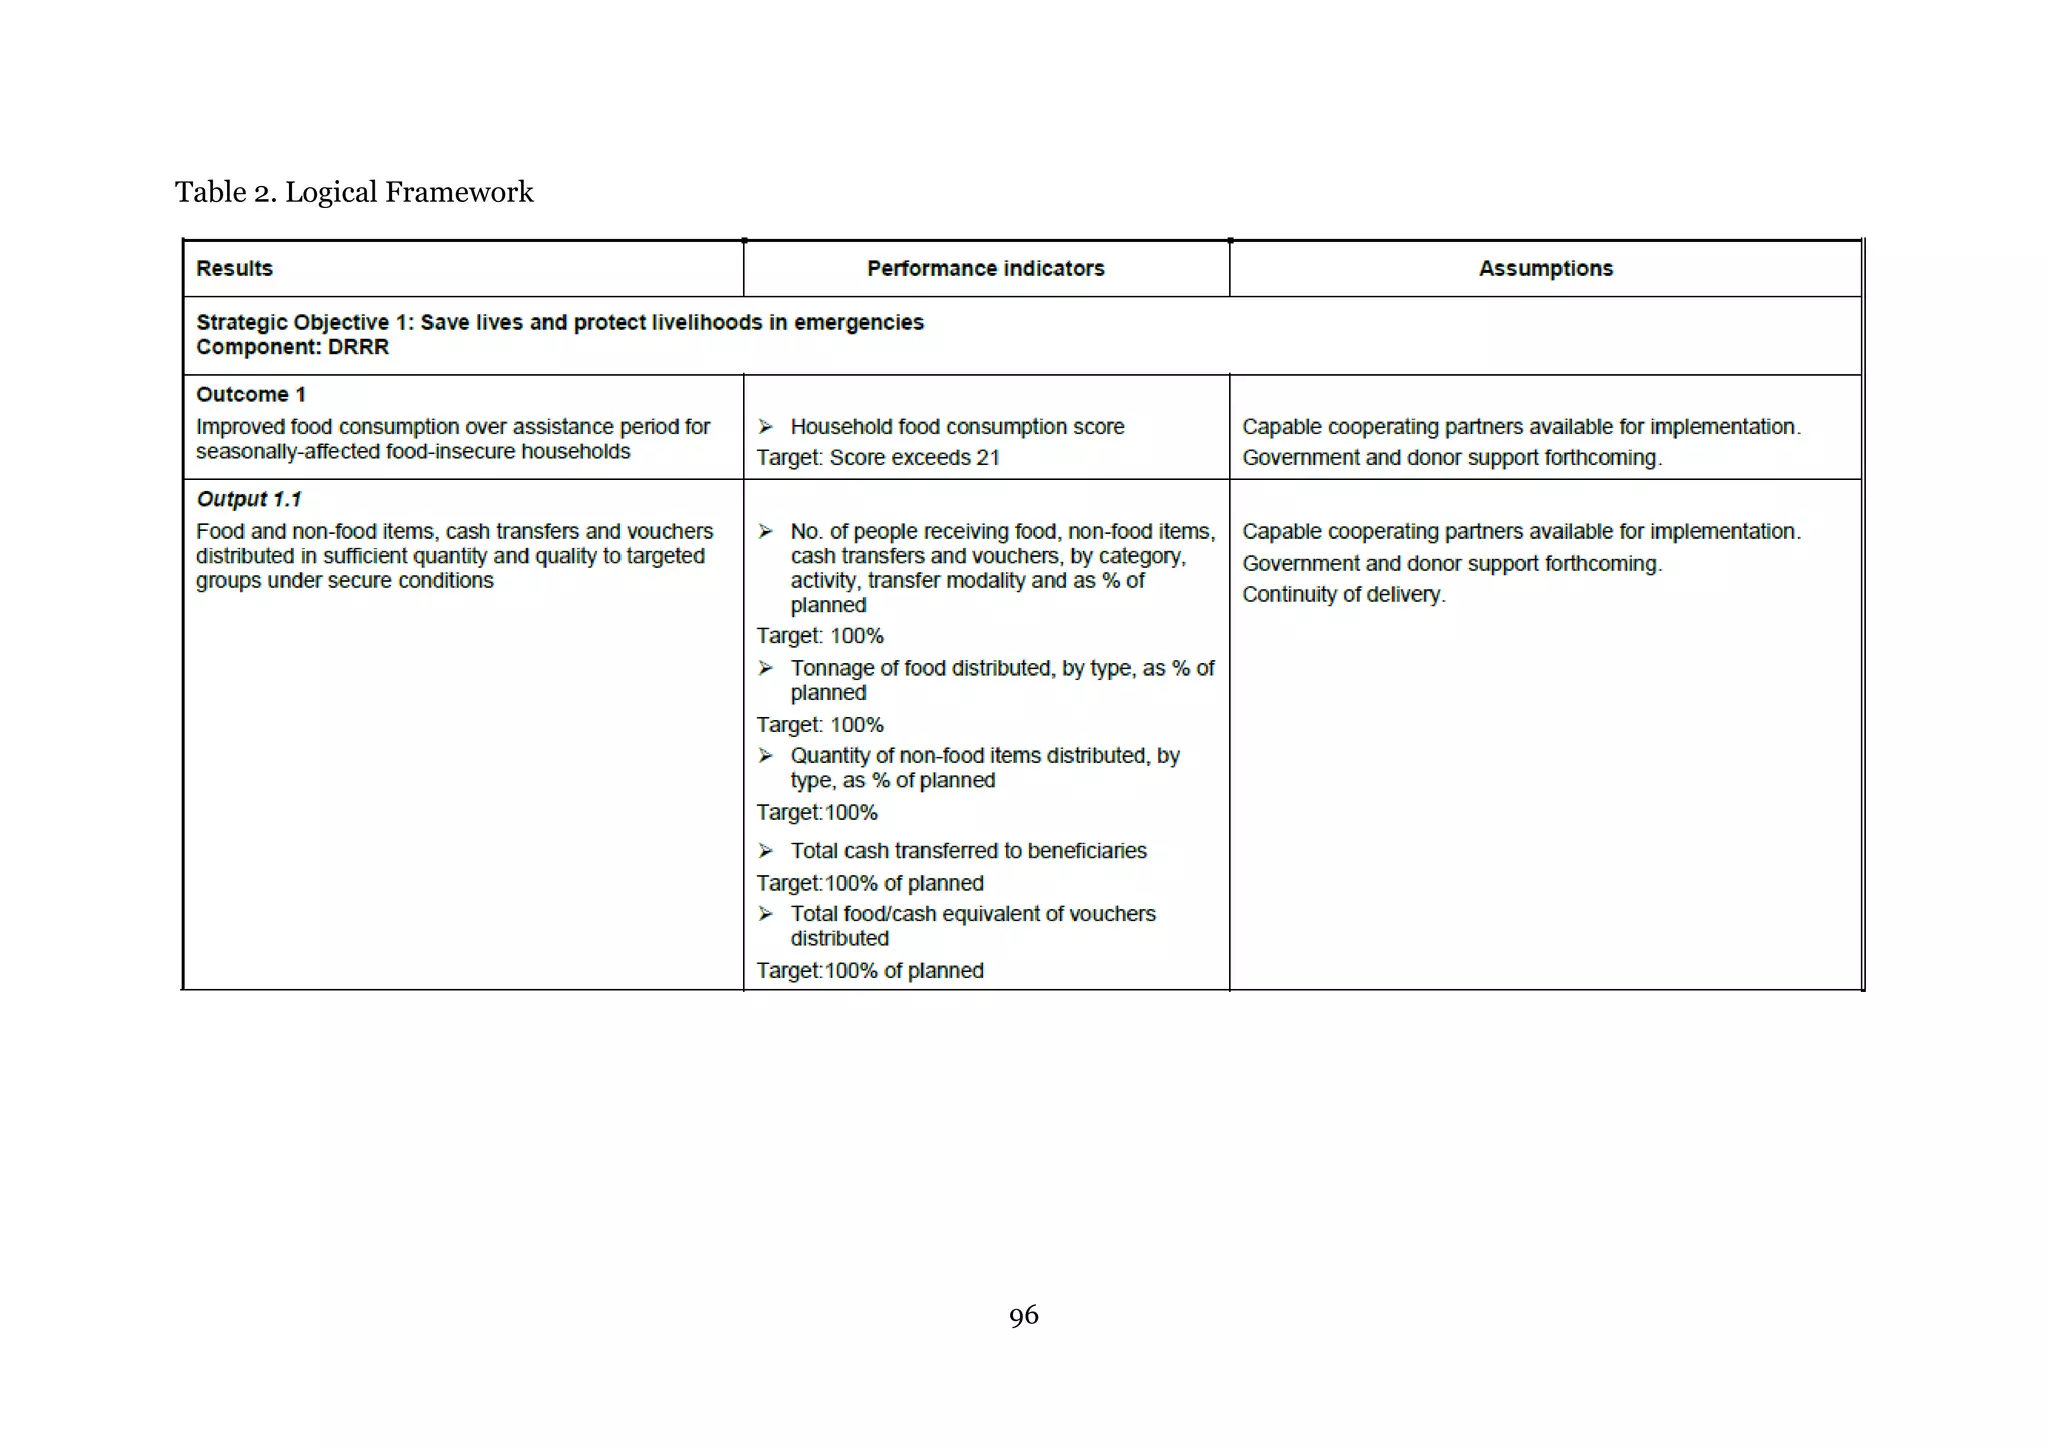
102. Under PAC WFP planned to work with 25 international and Zimbabwean
NGO partners in 30 Districts, but due to funding constraints ended up working with
nine partners in 15 Districts (Annex 7). The partners are responsible for distributing
the food and guiding the asset creation and the activities such as beneficiary
selection, the Community Level Participatory Planning (CLLP) process and the setup
of asset management committees. Between May 2013 and March 2014 WFP
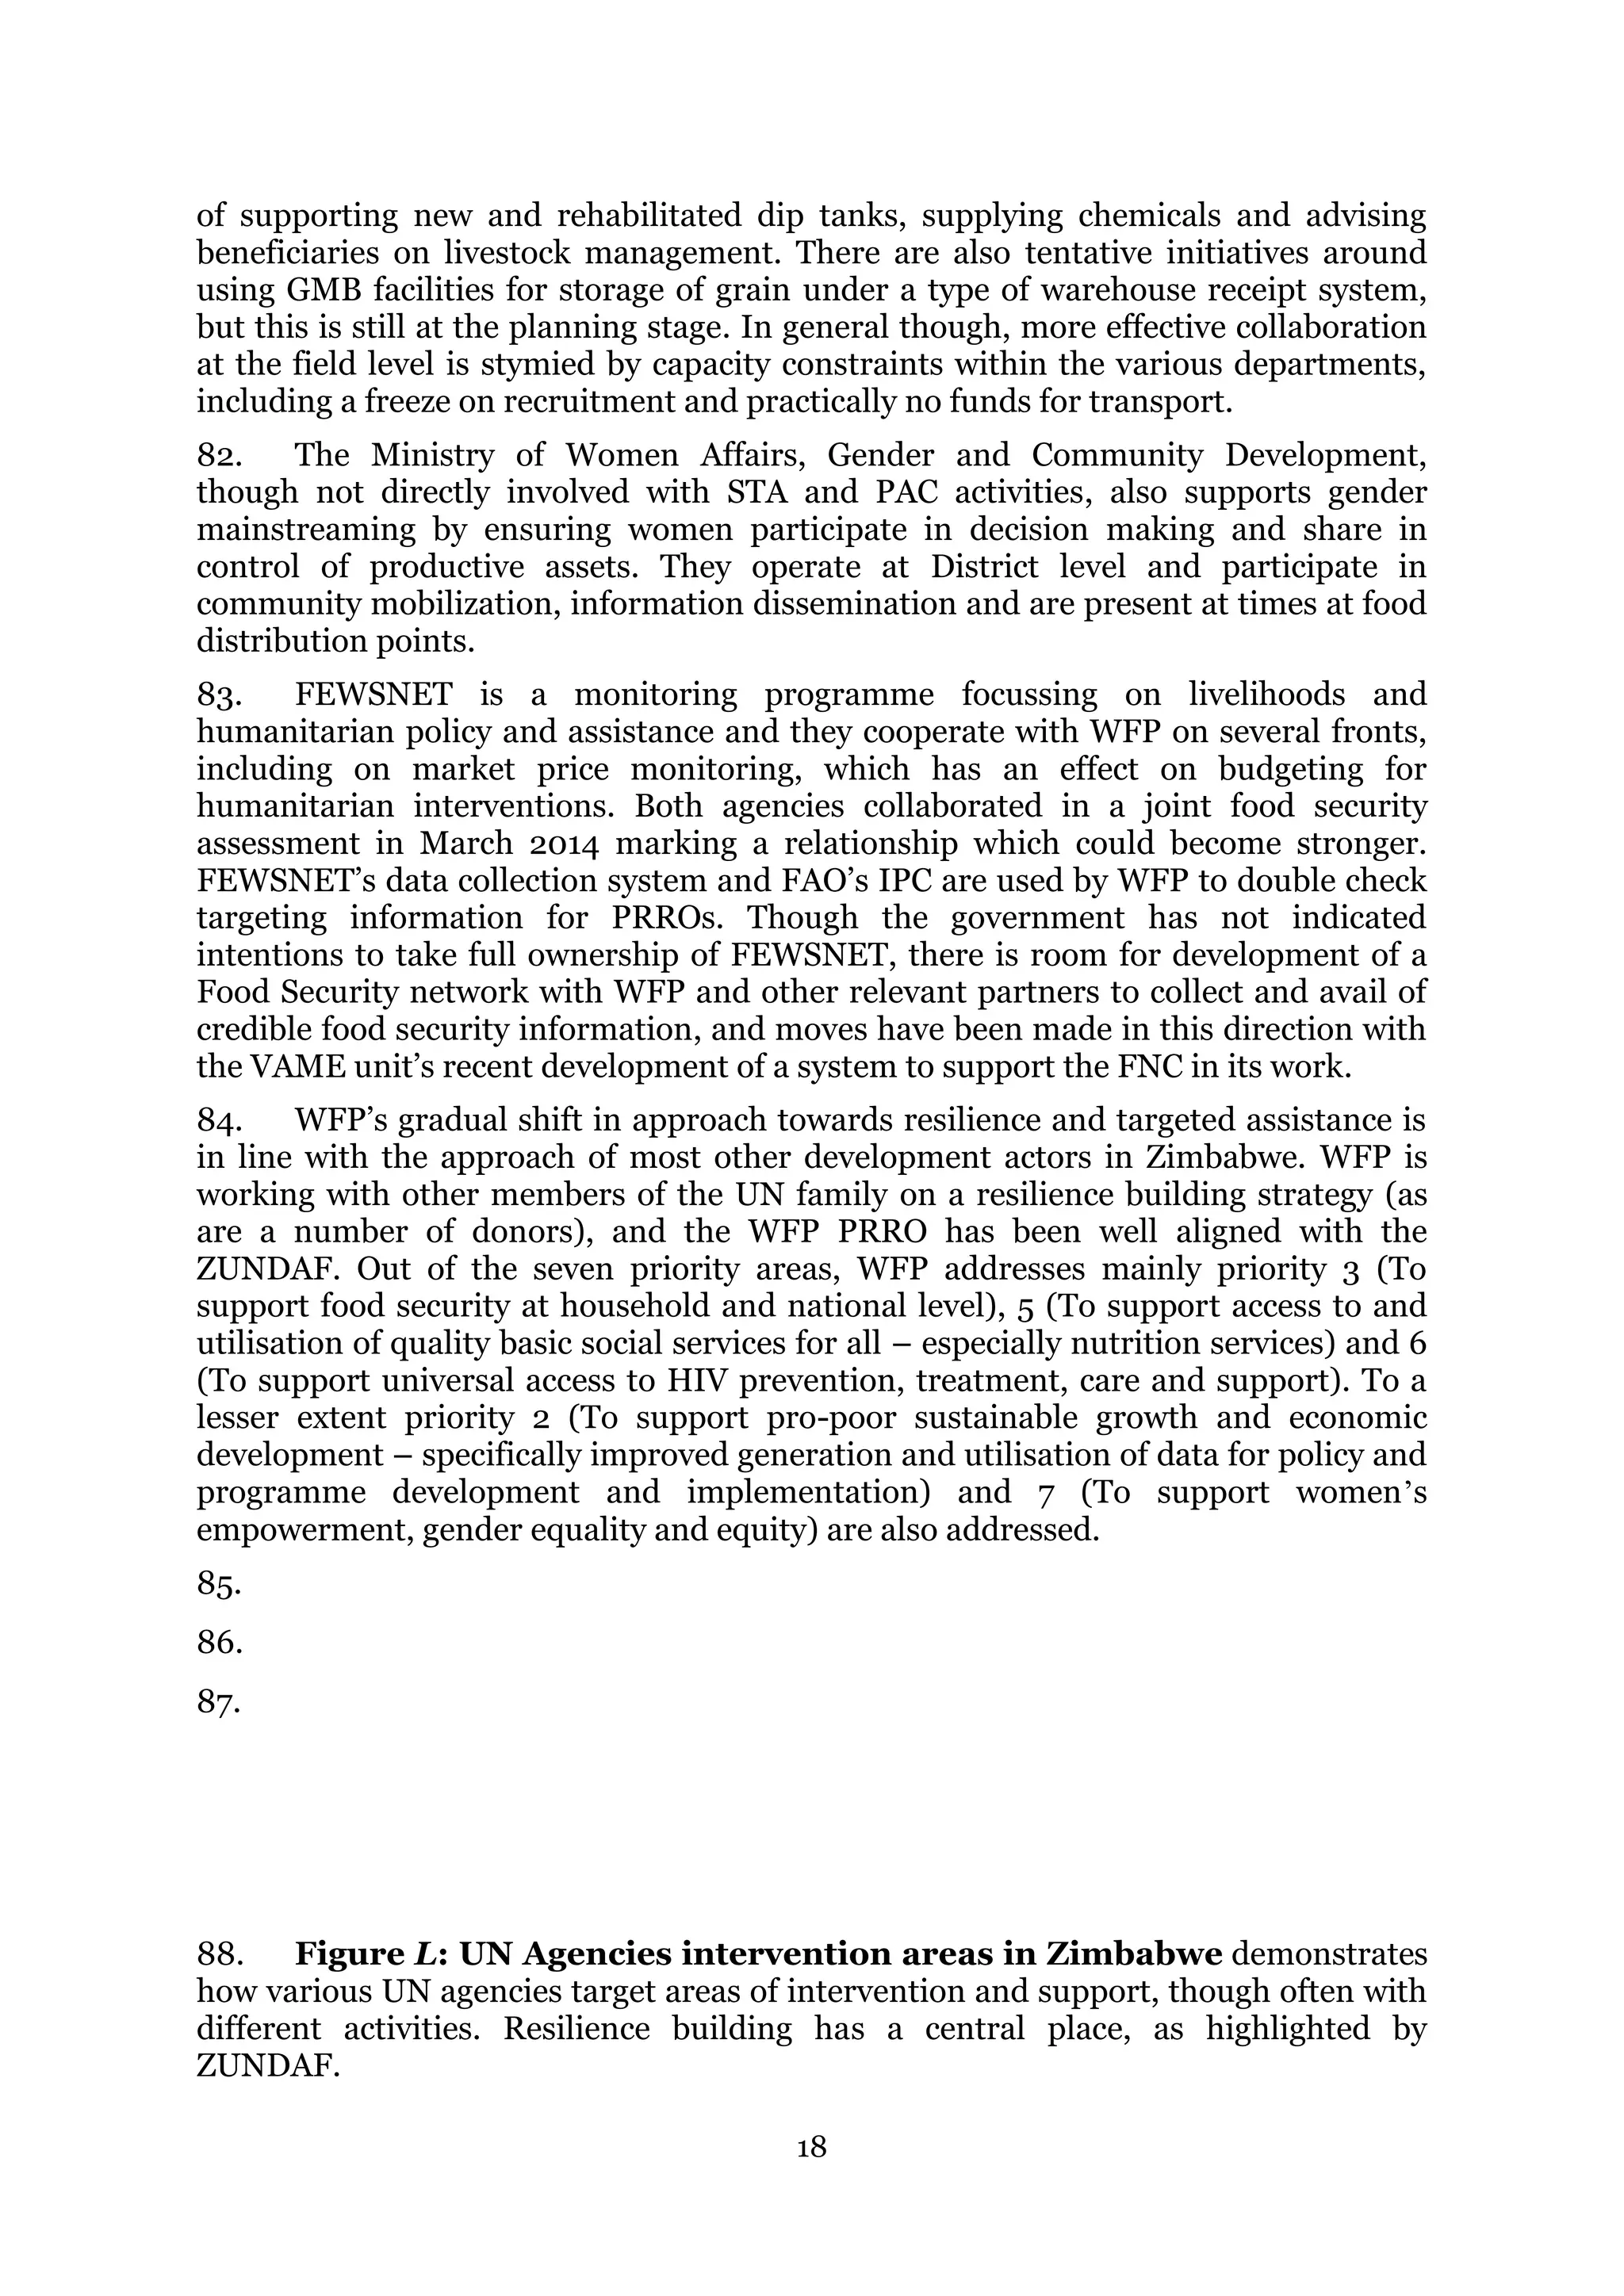
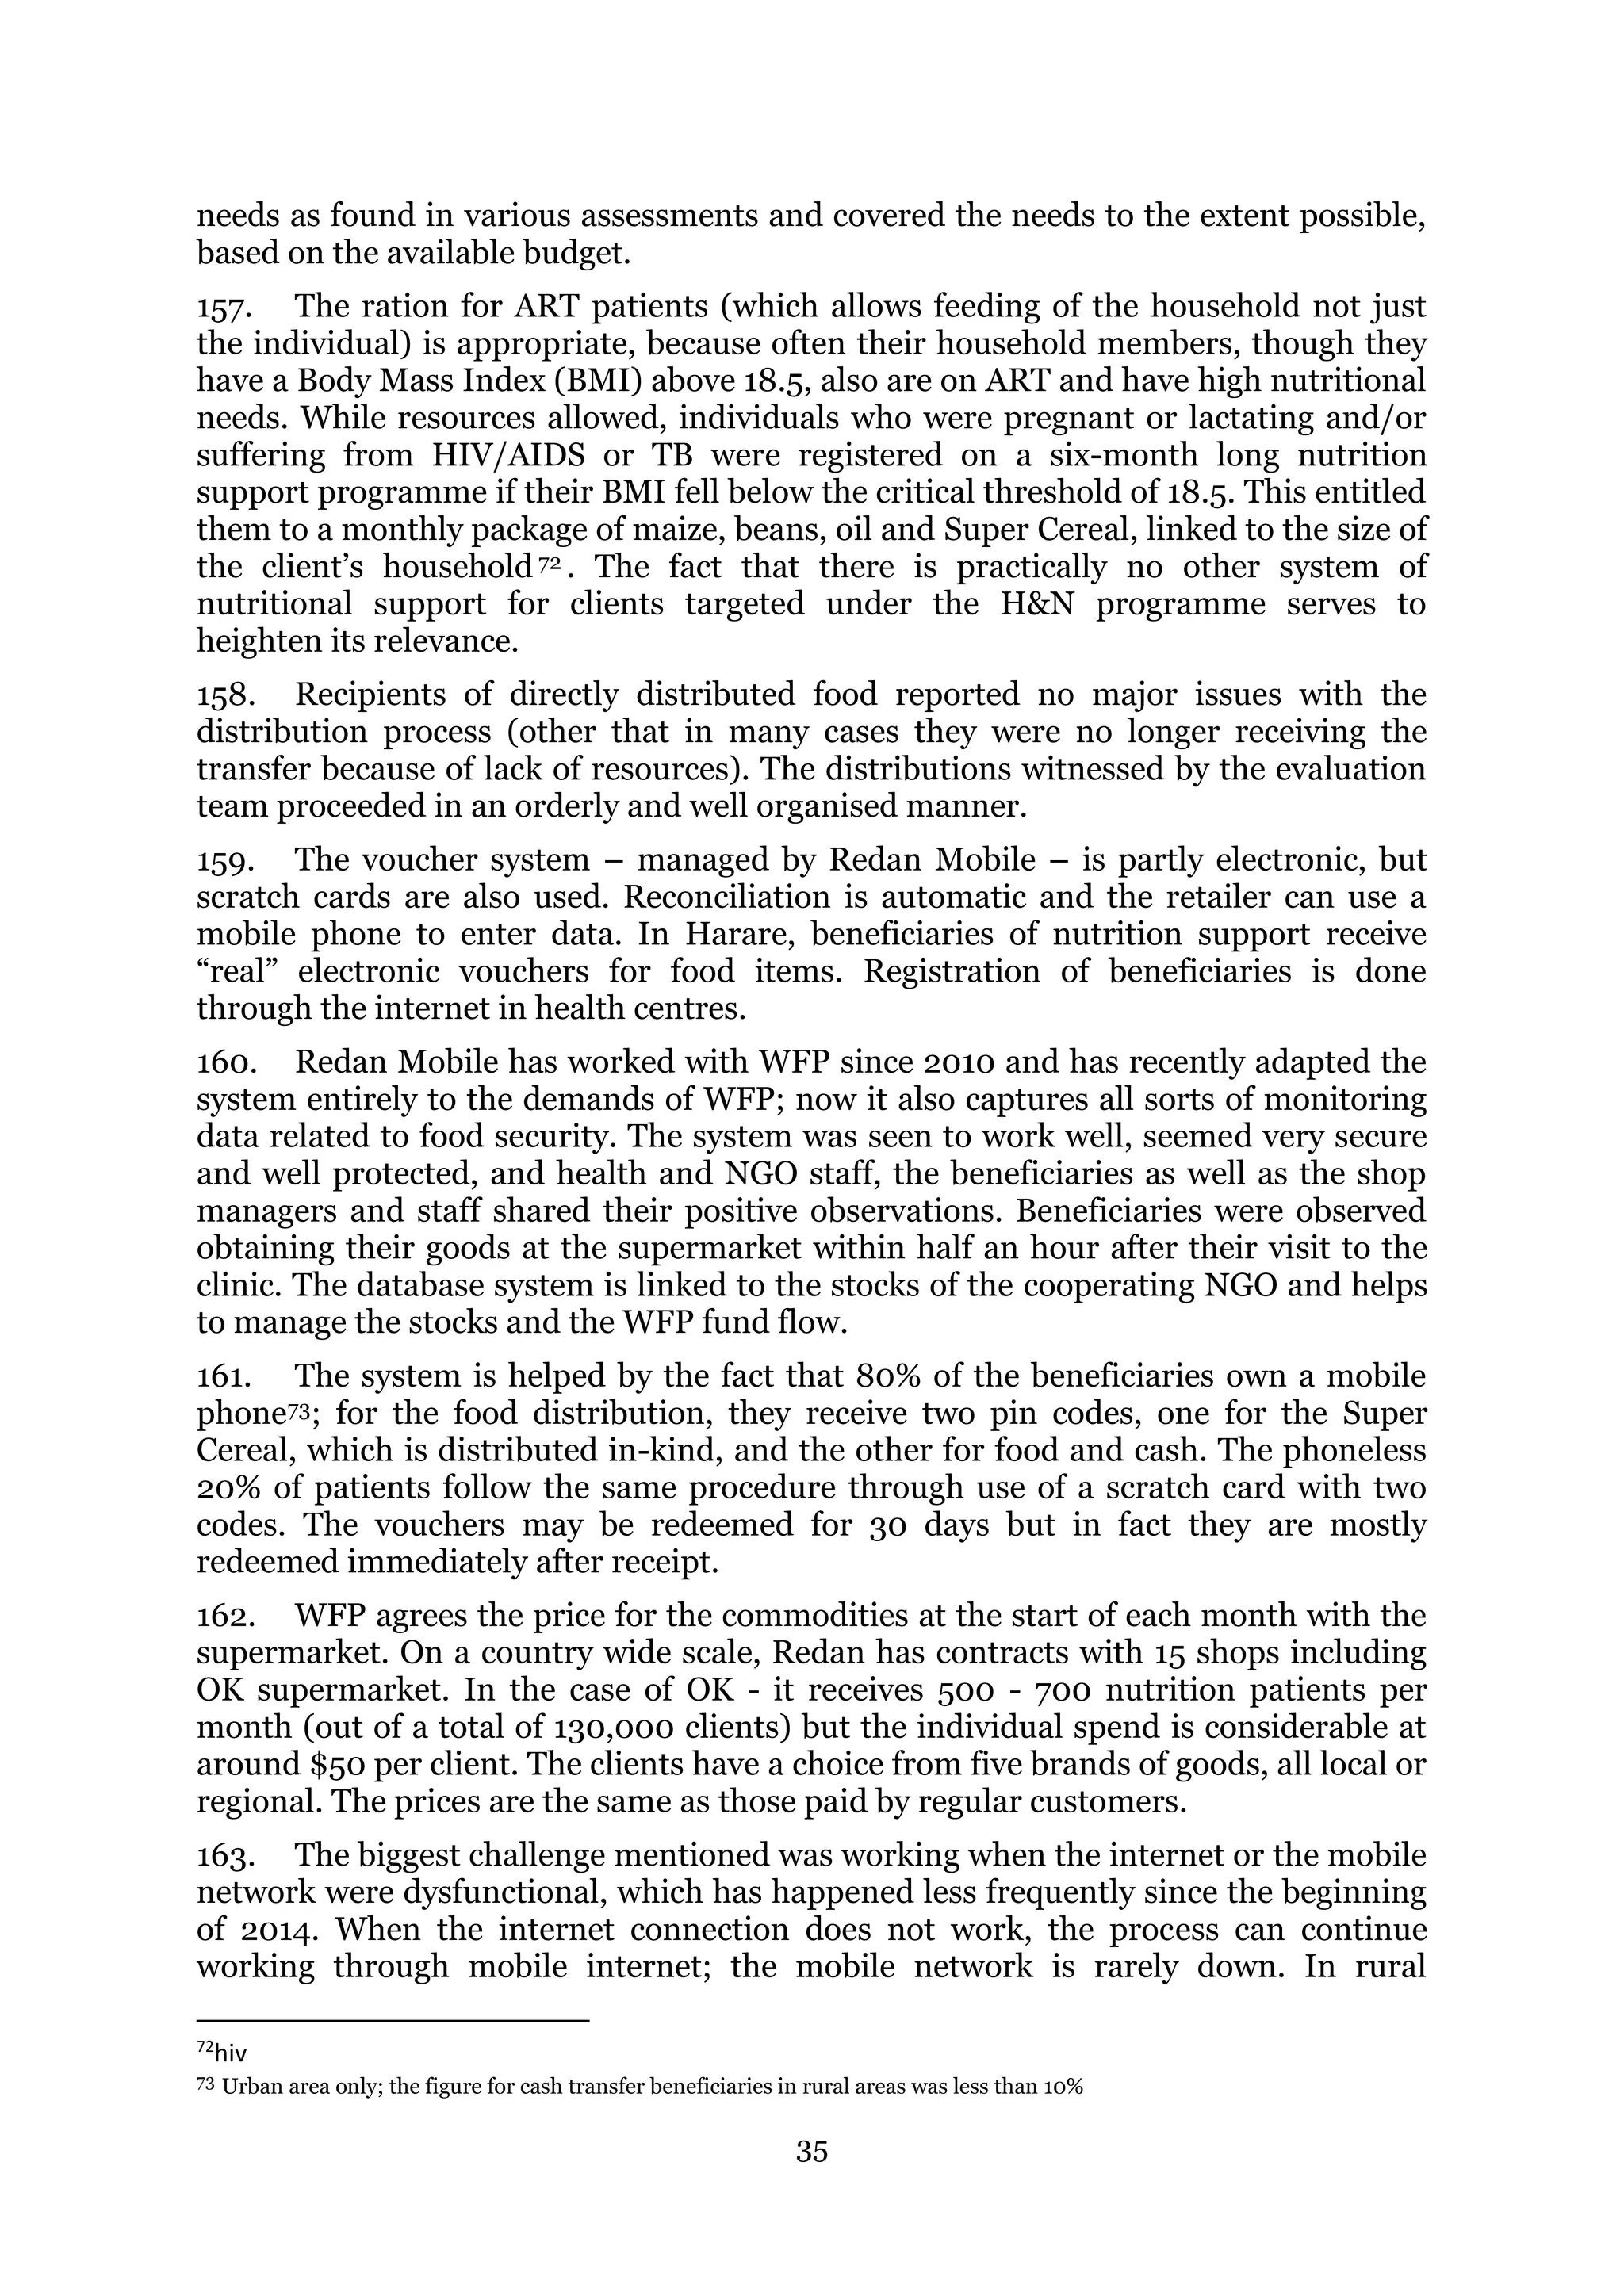
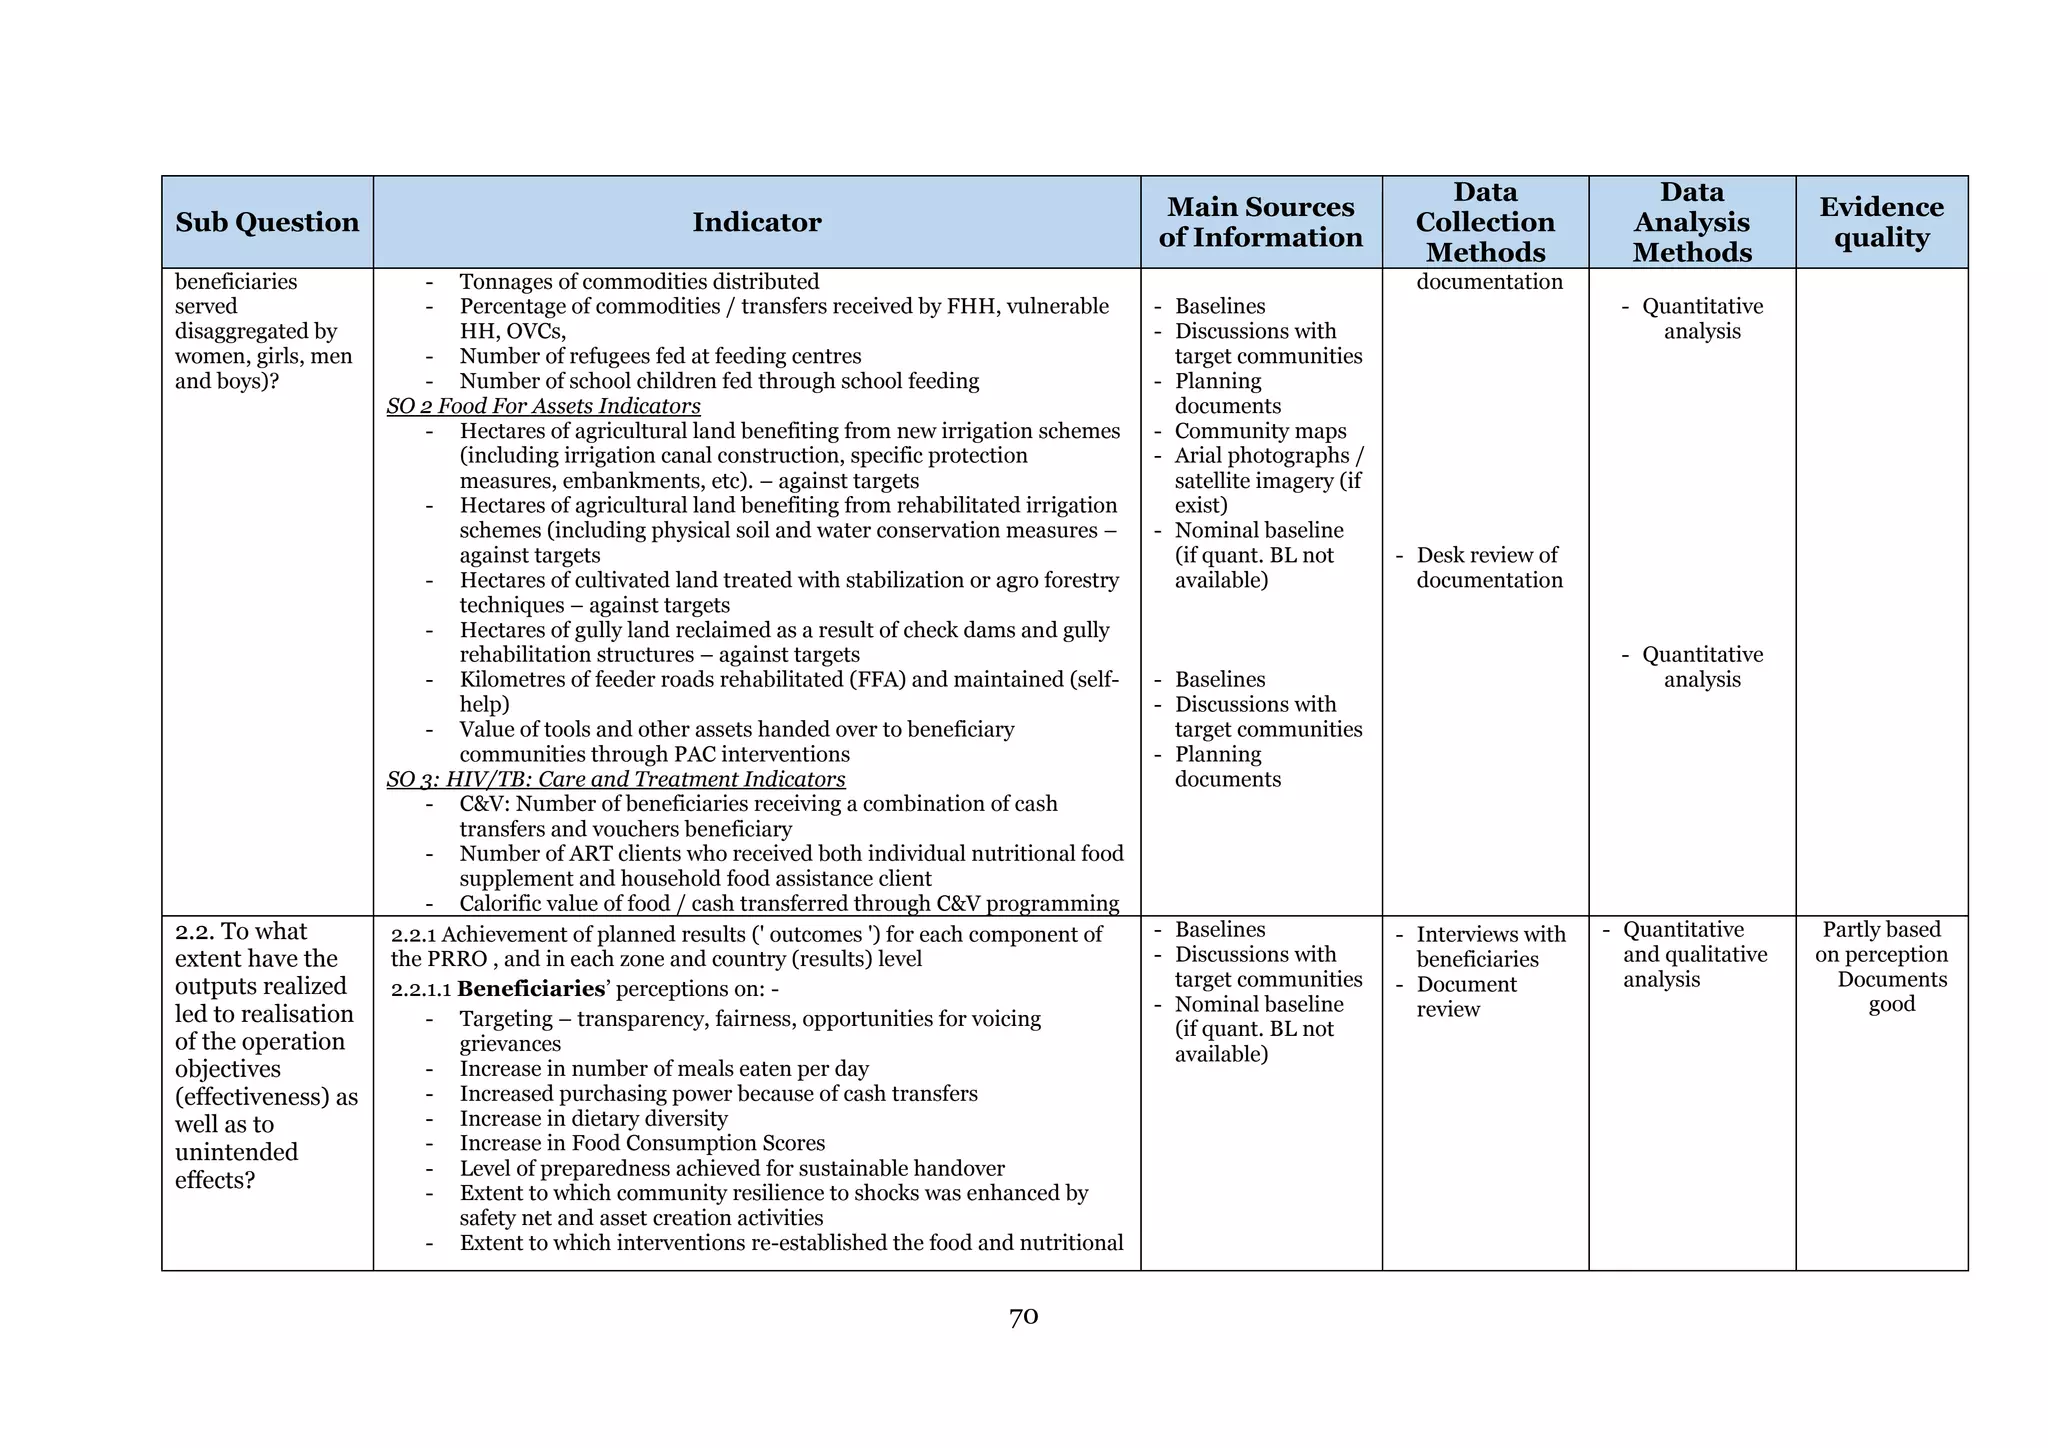
distributed 98% of the tonnage of food planned in the PRRO, reaching just over
100% of the planned 250,000 beneficiaries. However, only $721,710 (20%) of a
planned $3,600,000 cash / voucher distribution was completed because of funding
constraints (Table 4: PAC Outputs - Planned & Actual).
Table 4: PAC Outputs - Planned & Actual May 2013 – March 2014
66
A continuously updated record of all people living in the village kept by the head man](https://image.slidesharecdn.com/bf1fb9fa-b81e-453e-8f3d-187e133a2a27-170124040005/75/wfp268240-38-2048.jpg)


![32
142. Apart from the MoHCC for the screening and referral, WFP works with 16
national and international NGOs who perform the food (and voucher) distribution,
collect data and analyse the results. In addition, WFP has supported the development
of nutrition related policy components and strategies of GoZ; including a study of the
importance of nutrition for HIV patients. Currently, GoZ works on developing food
fortification legislation supported by WFP.
143. In the rural areas, nutrition beneficiaries were provided with 10 kg Super
Cereal per month throughout the year, provided no pipeline breaks occurred (in
urban areas a voucher scheme [described in section 2] was used). Their households
received a ration for up to 5 members, if they were found food insecure (a full ration
consists of 10 kg cereals, 2 kg pulses and 750 gram vegetable oil per household
member). The cooperating NGO checks whether the family is food insecure, which
was almost always the case, since the public hospitals are primarily used by the most
vulnerable population. A clear explanation and guidance on the use of Super Cereal is
given when patients get their first ration, and that has contributed to its high
acceptance.
144. There have been several pipeline breaks, most of them caused by a funding
shortfall, from November onwards. From March 2014 there was no Super Cereal at
all, but in general, the distribution had returned to full rations from May 2014,
however, as prepositioned stocks are limited, it is unsure yet how long this will last –
for example, in Bulawayo, in May 2014 there was no Super Cereal provided by CRS
since they had not settled their contract with WFP yet, and in Kwekwe the entire
nutrition support was stopped in February 2014 because of lack of food.
145. In the case of serious pipeline breaks (for instance March 2014), food
distribution was done on a first-come-first serve basis, because the NGO partners as
well as WFP believed and hoped that the food would still arrive. This was not the
case, and a number of patients had to forego their entire ration for a month, some of
them travelling to the clinic or hospital several times only to find out there was no
food. Food also arrived late at some distribution points late in April 2014. No
analysis has been conducted into the possible effect of one month shortage on the
nutritional status.
146. In some of the hospitals in the West of the country staff reported that iron
tablets for pregnant women and Plumpy Nut for SAM patients were not available.
Some of the SAM patients reportedly ended up among the MAM patients, which then
had a negative influence on the recovery rate, since a year is generally too short to
cure SAM patients with the help of Super Cereal.
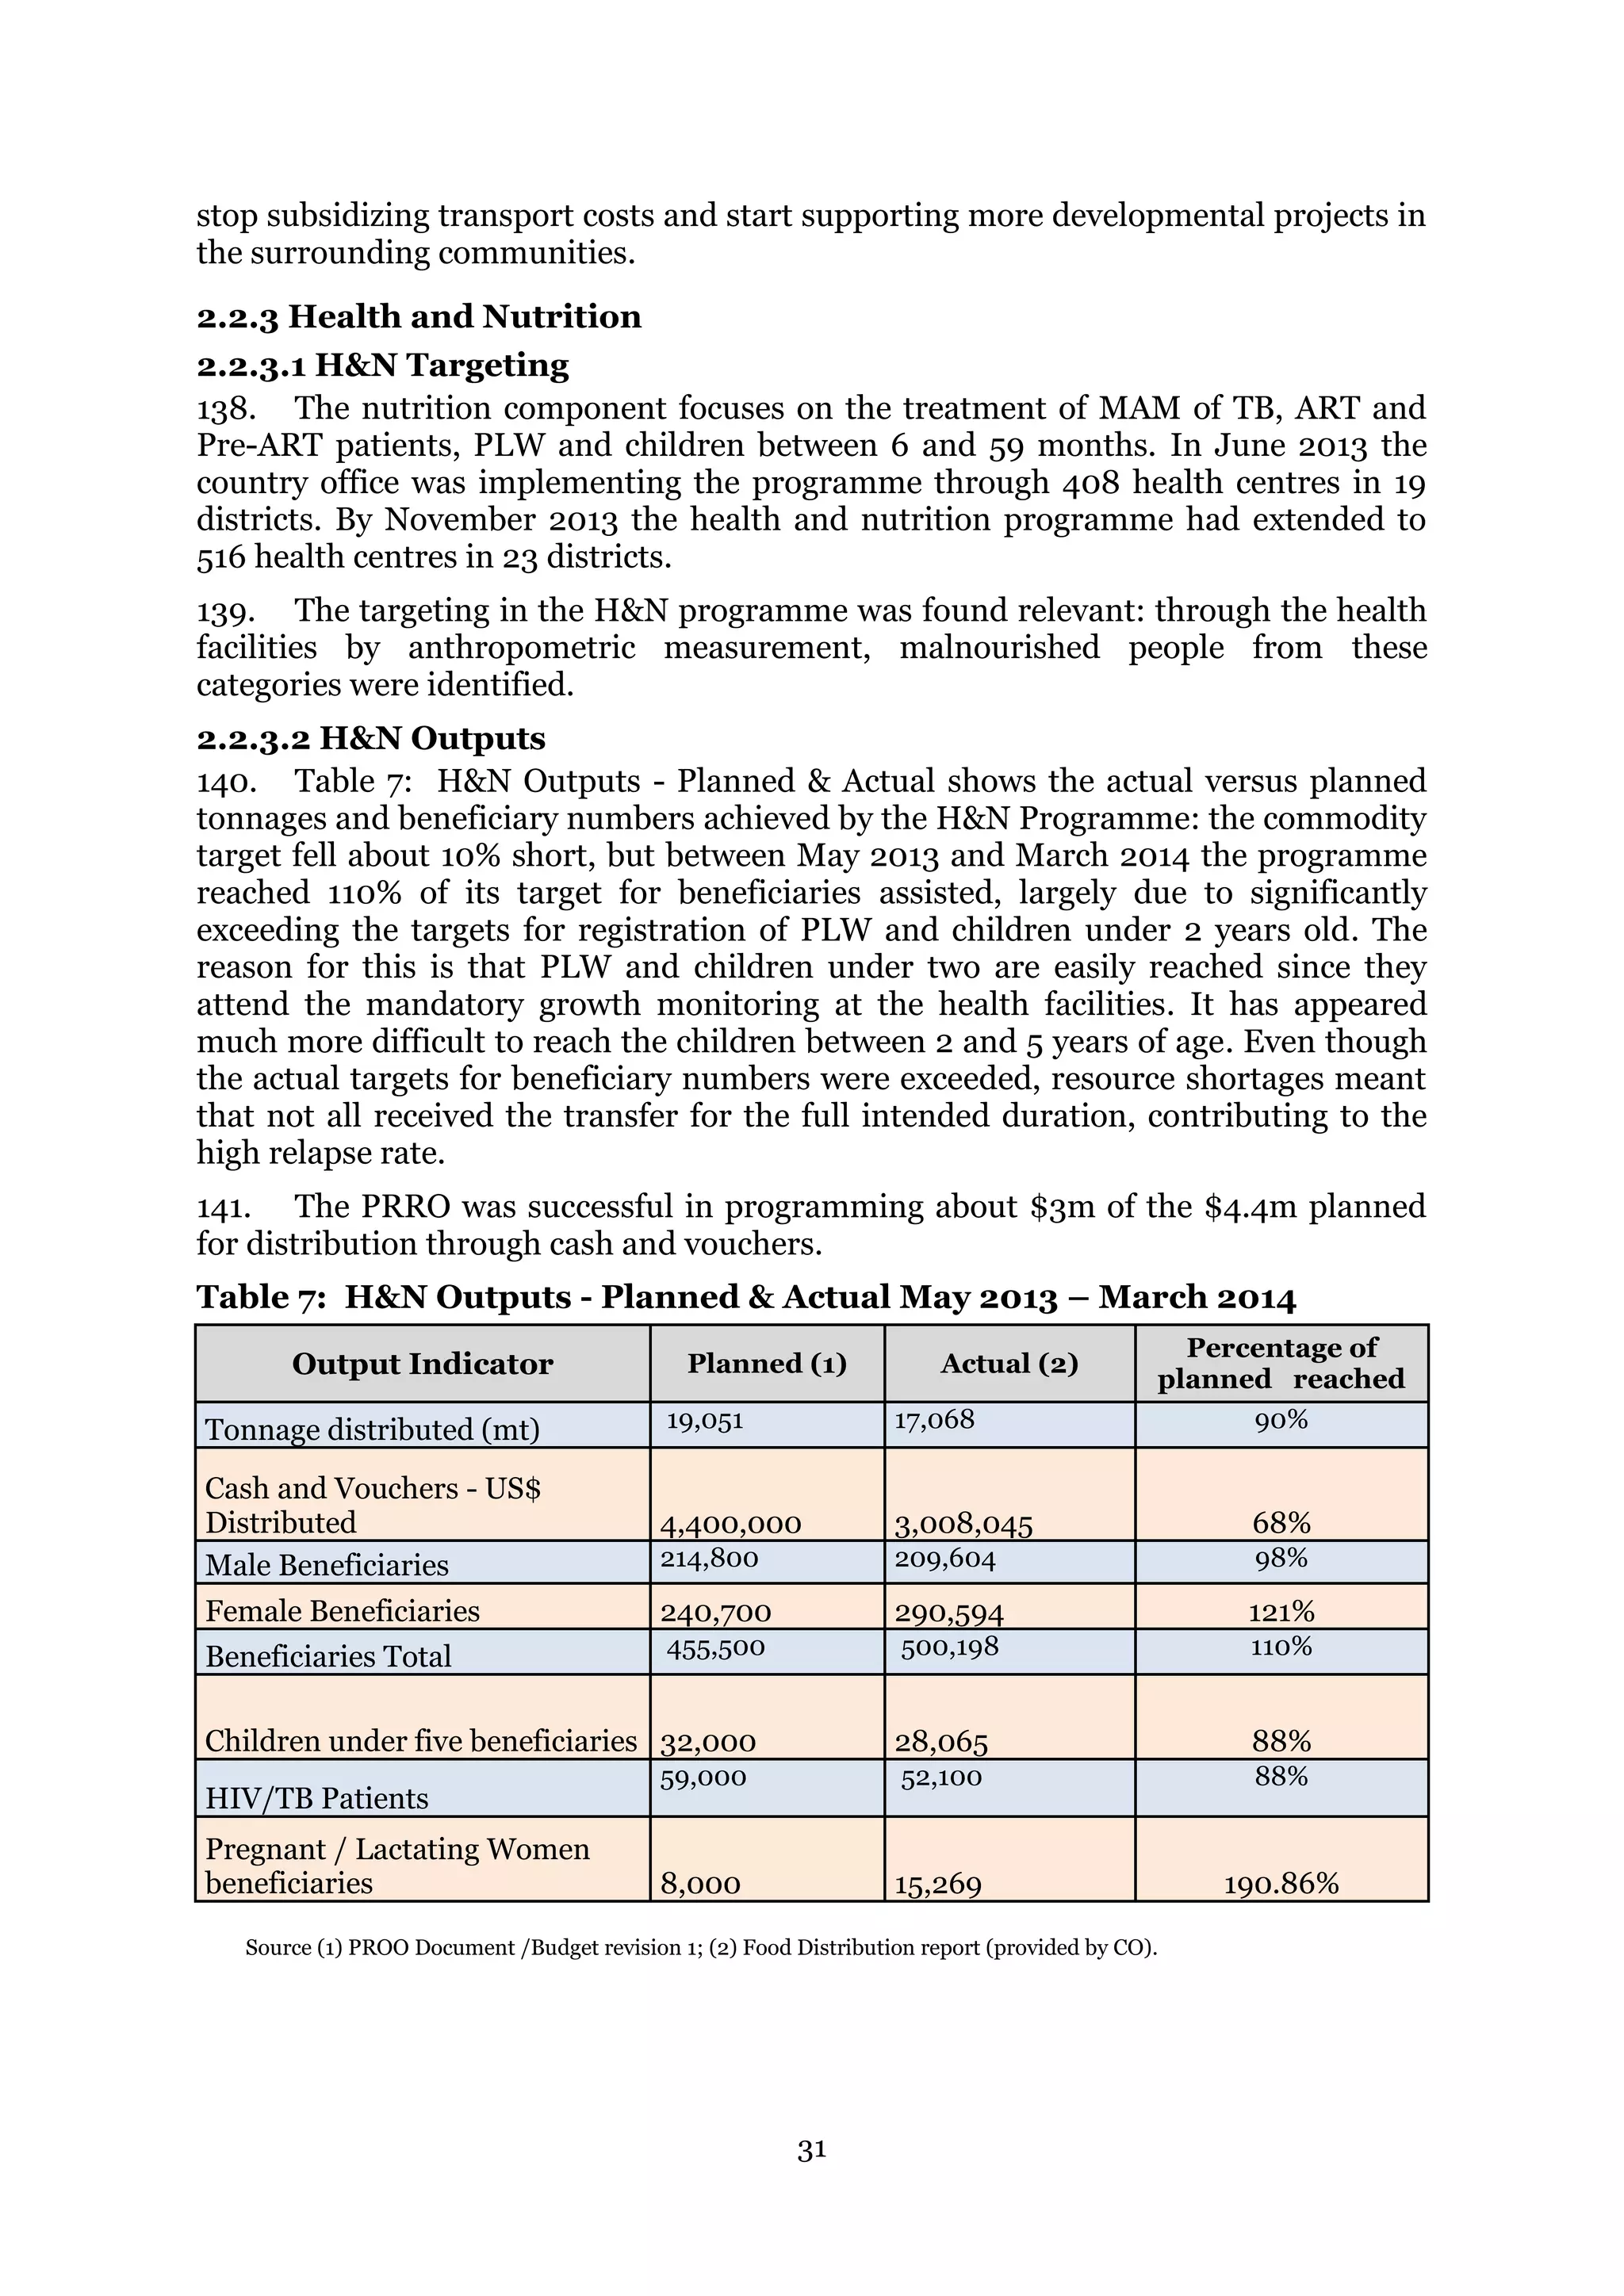
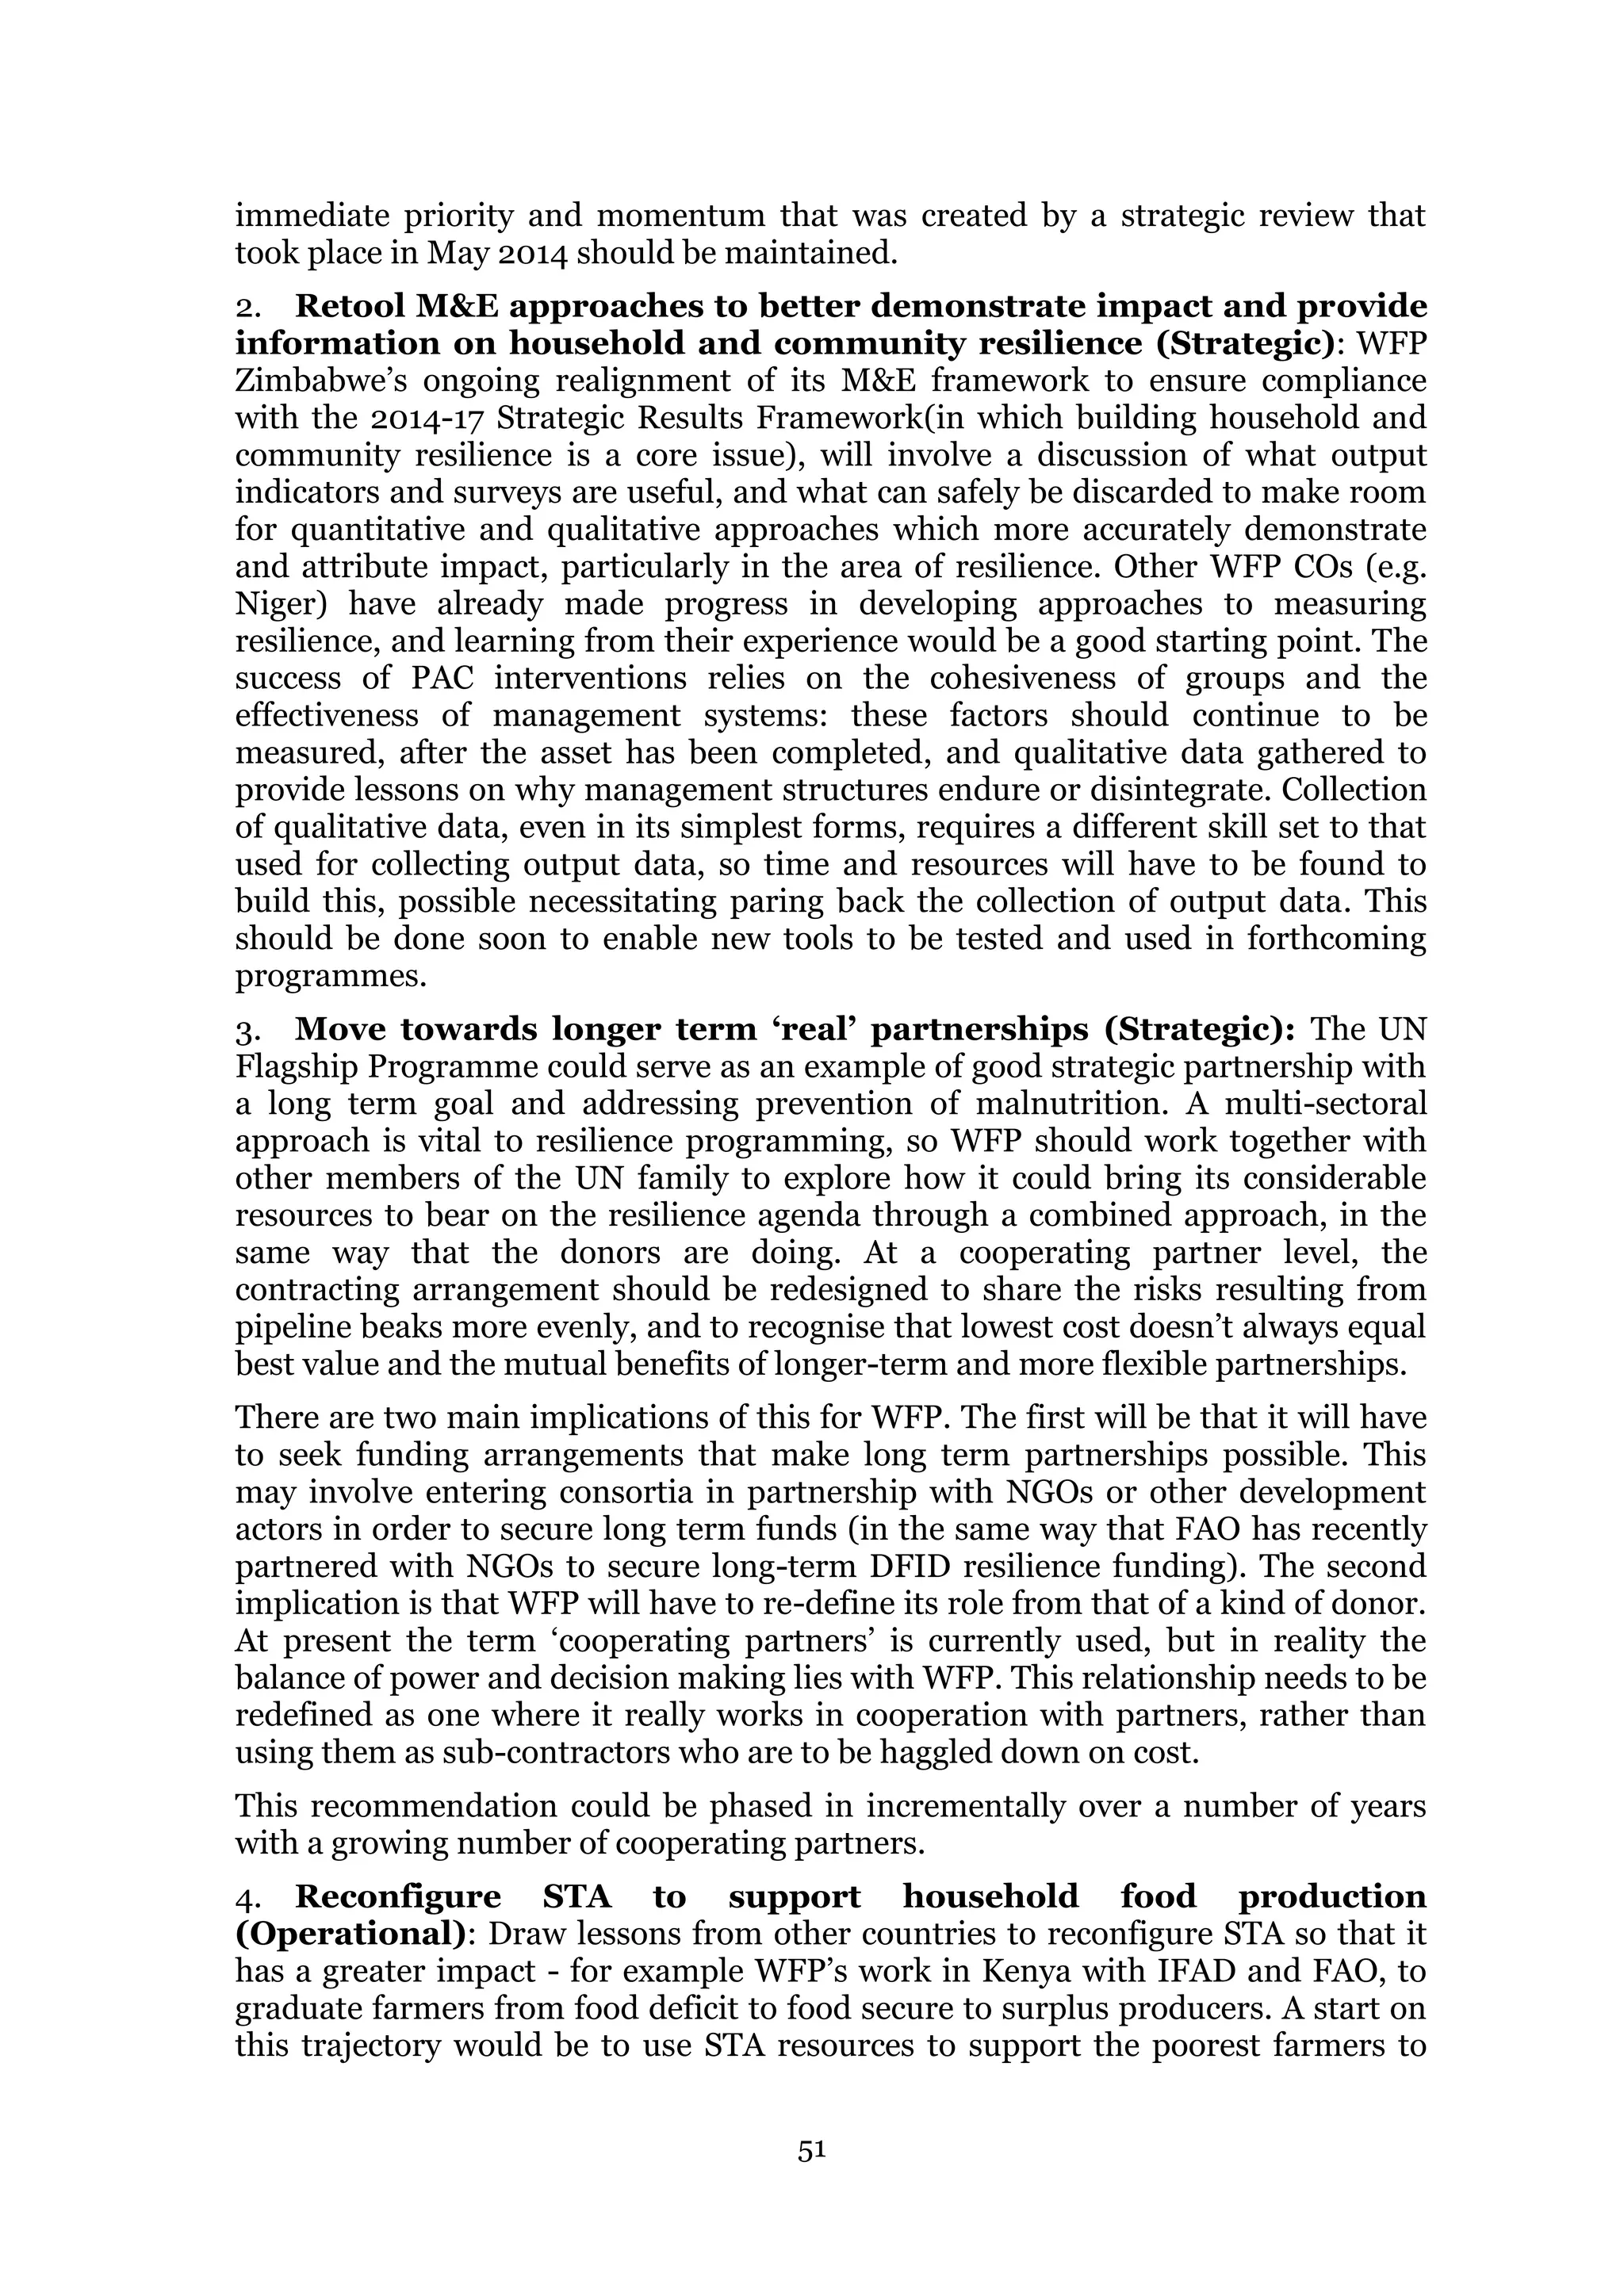
2.2.3.3 H&N Outcomes
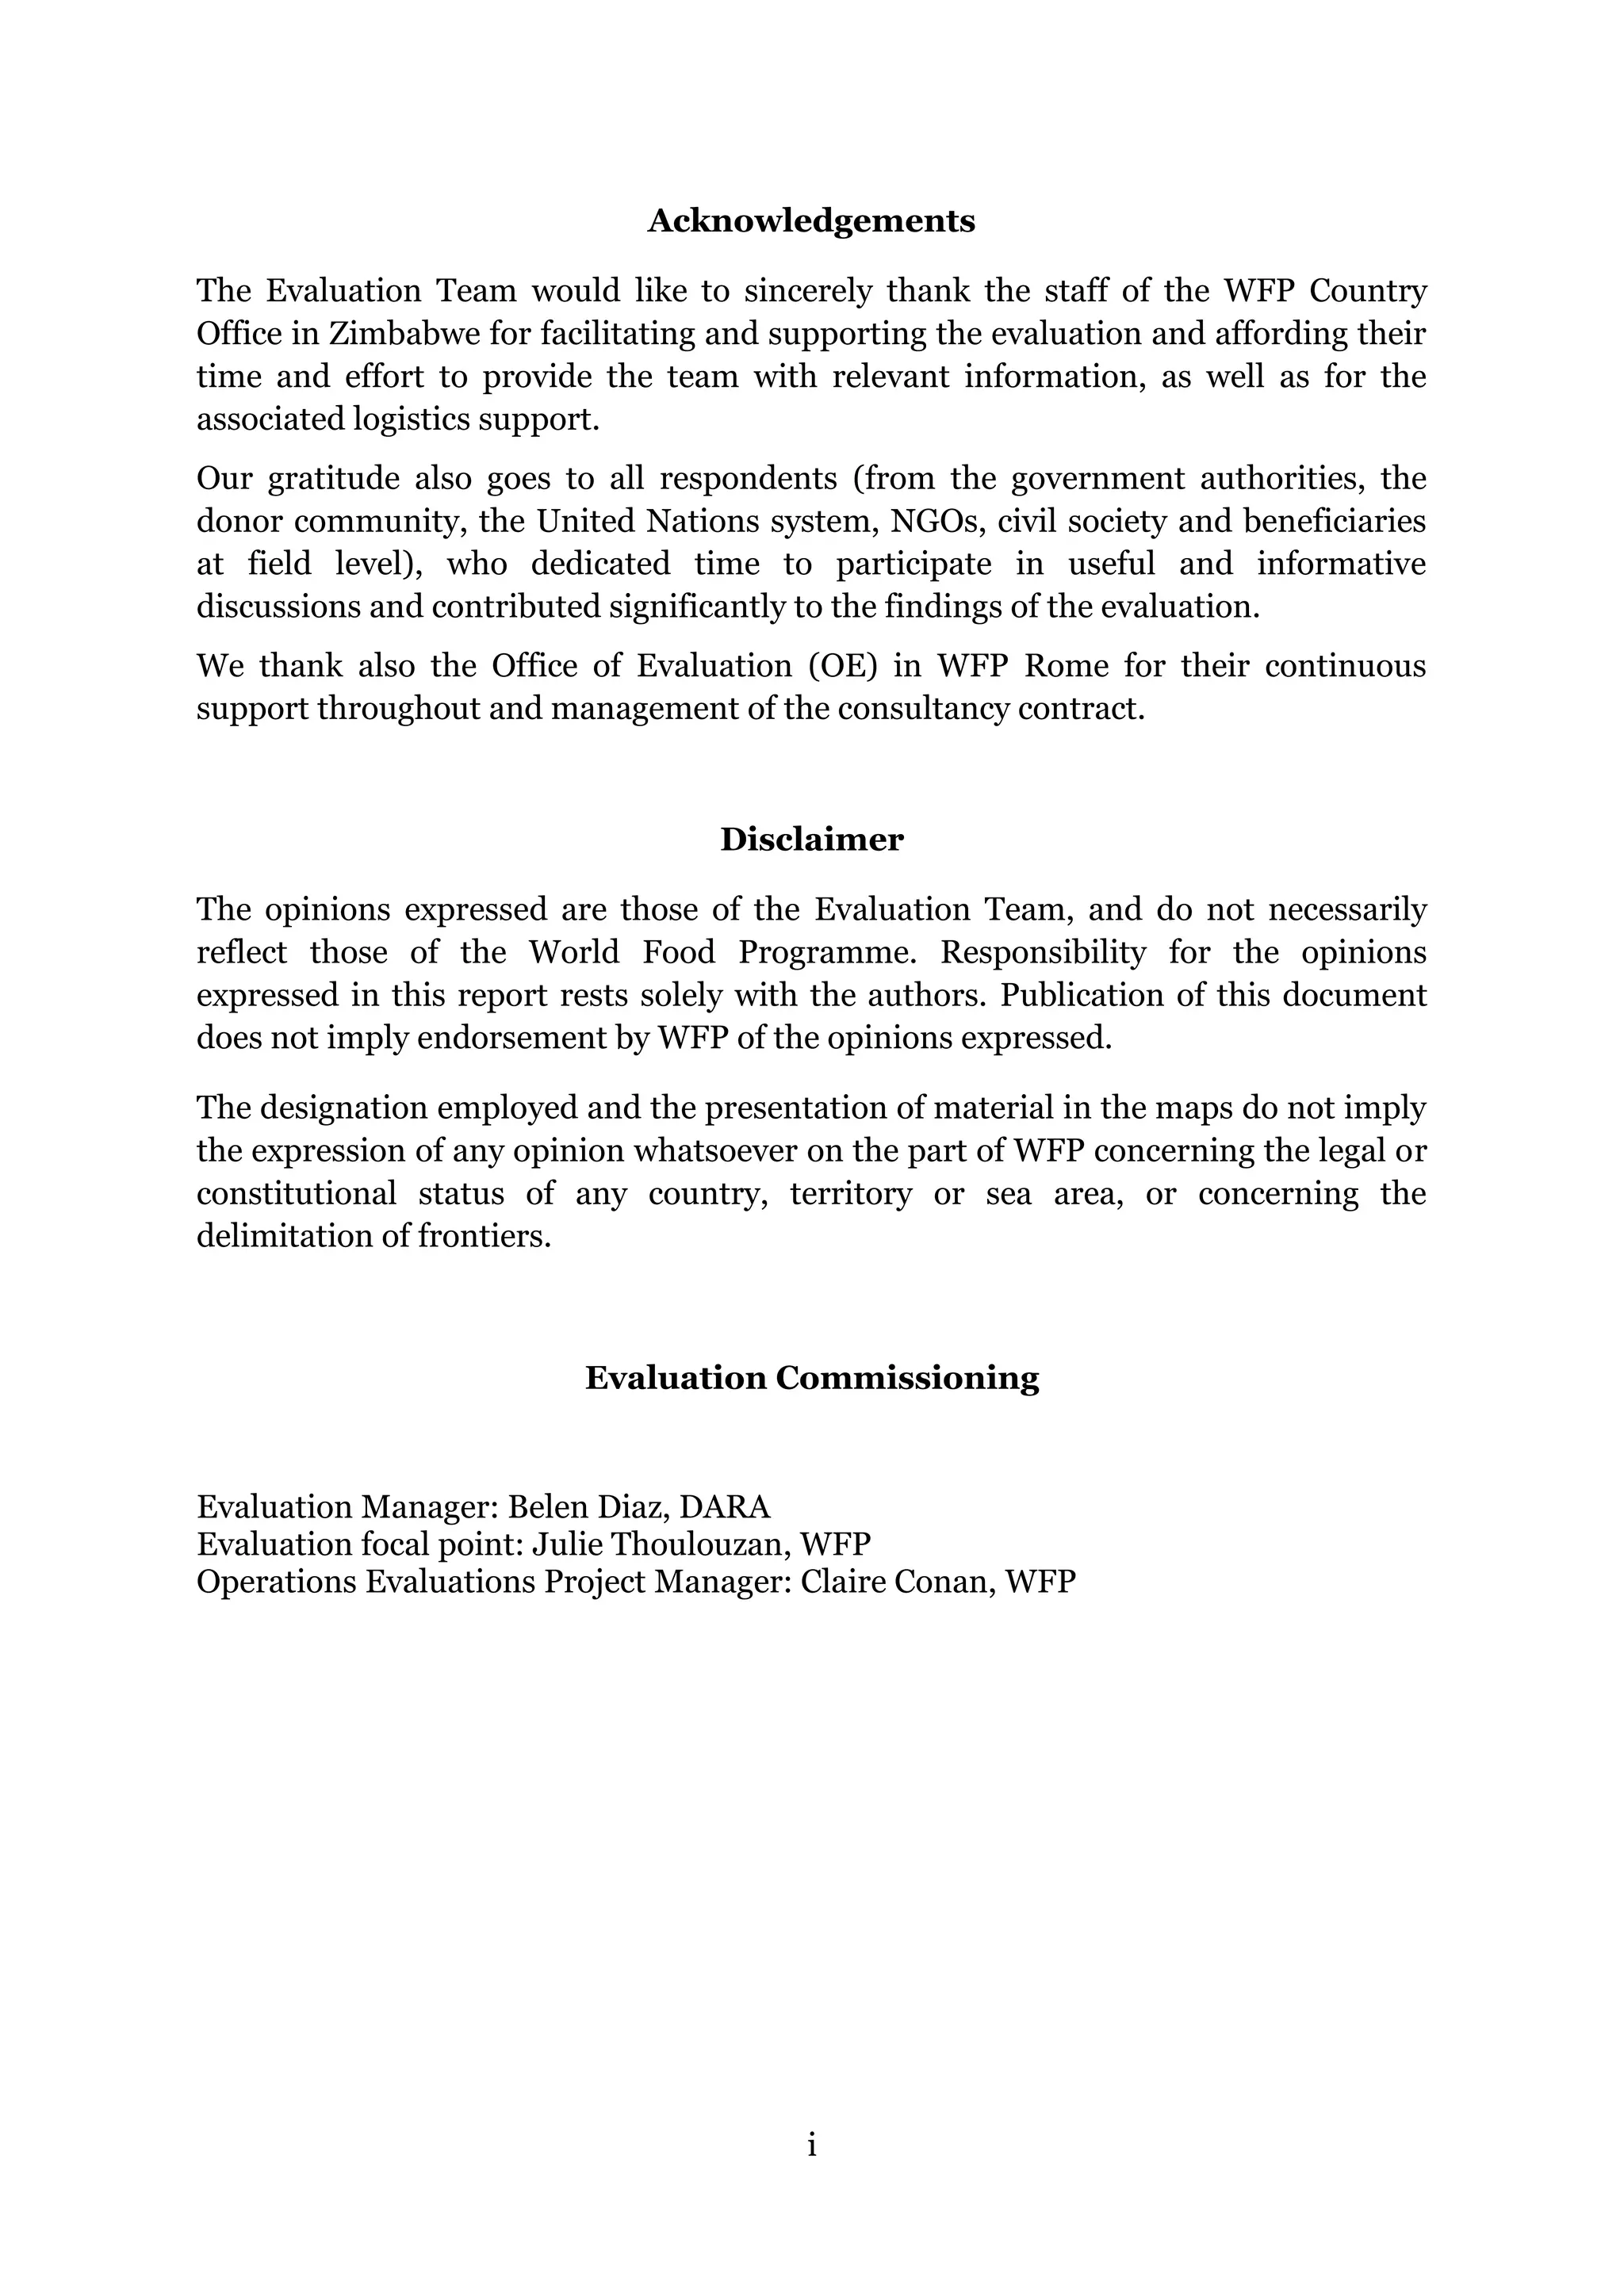
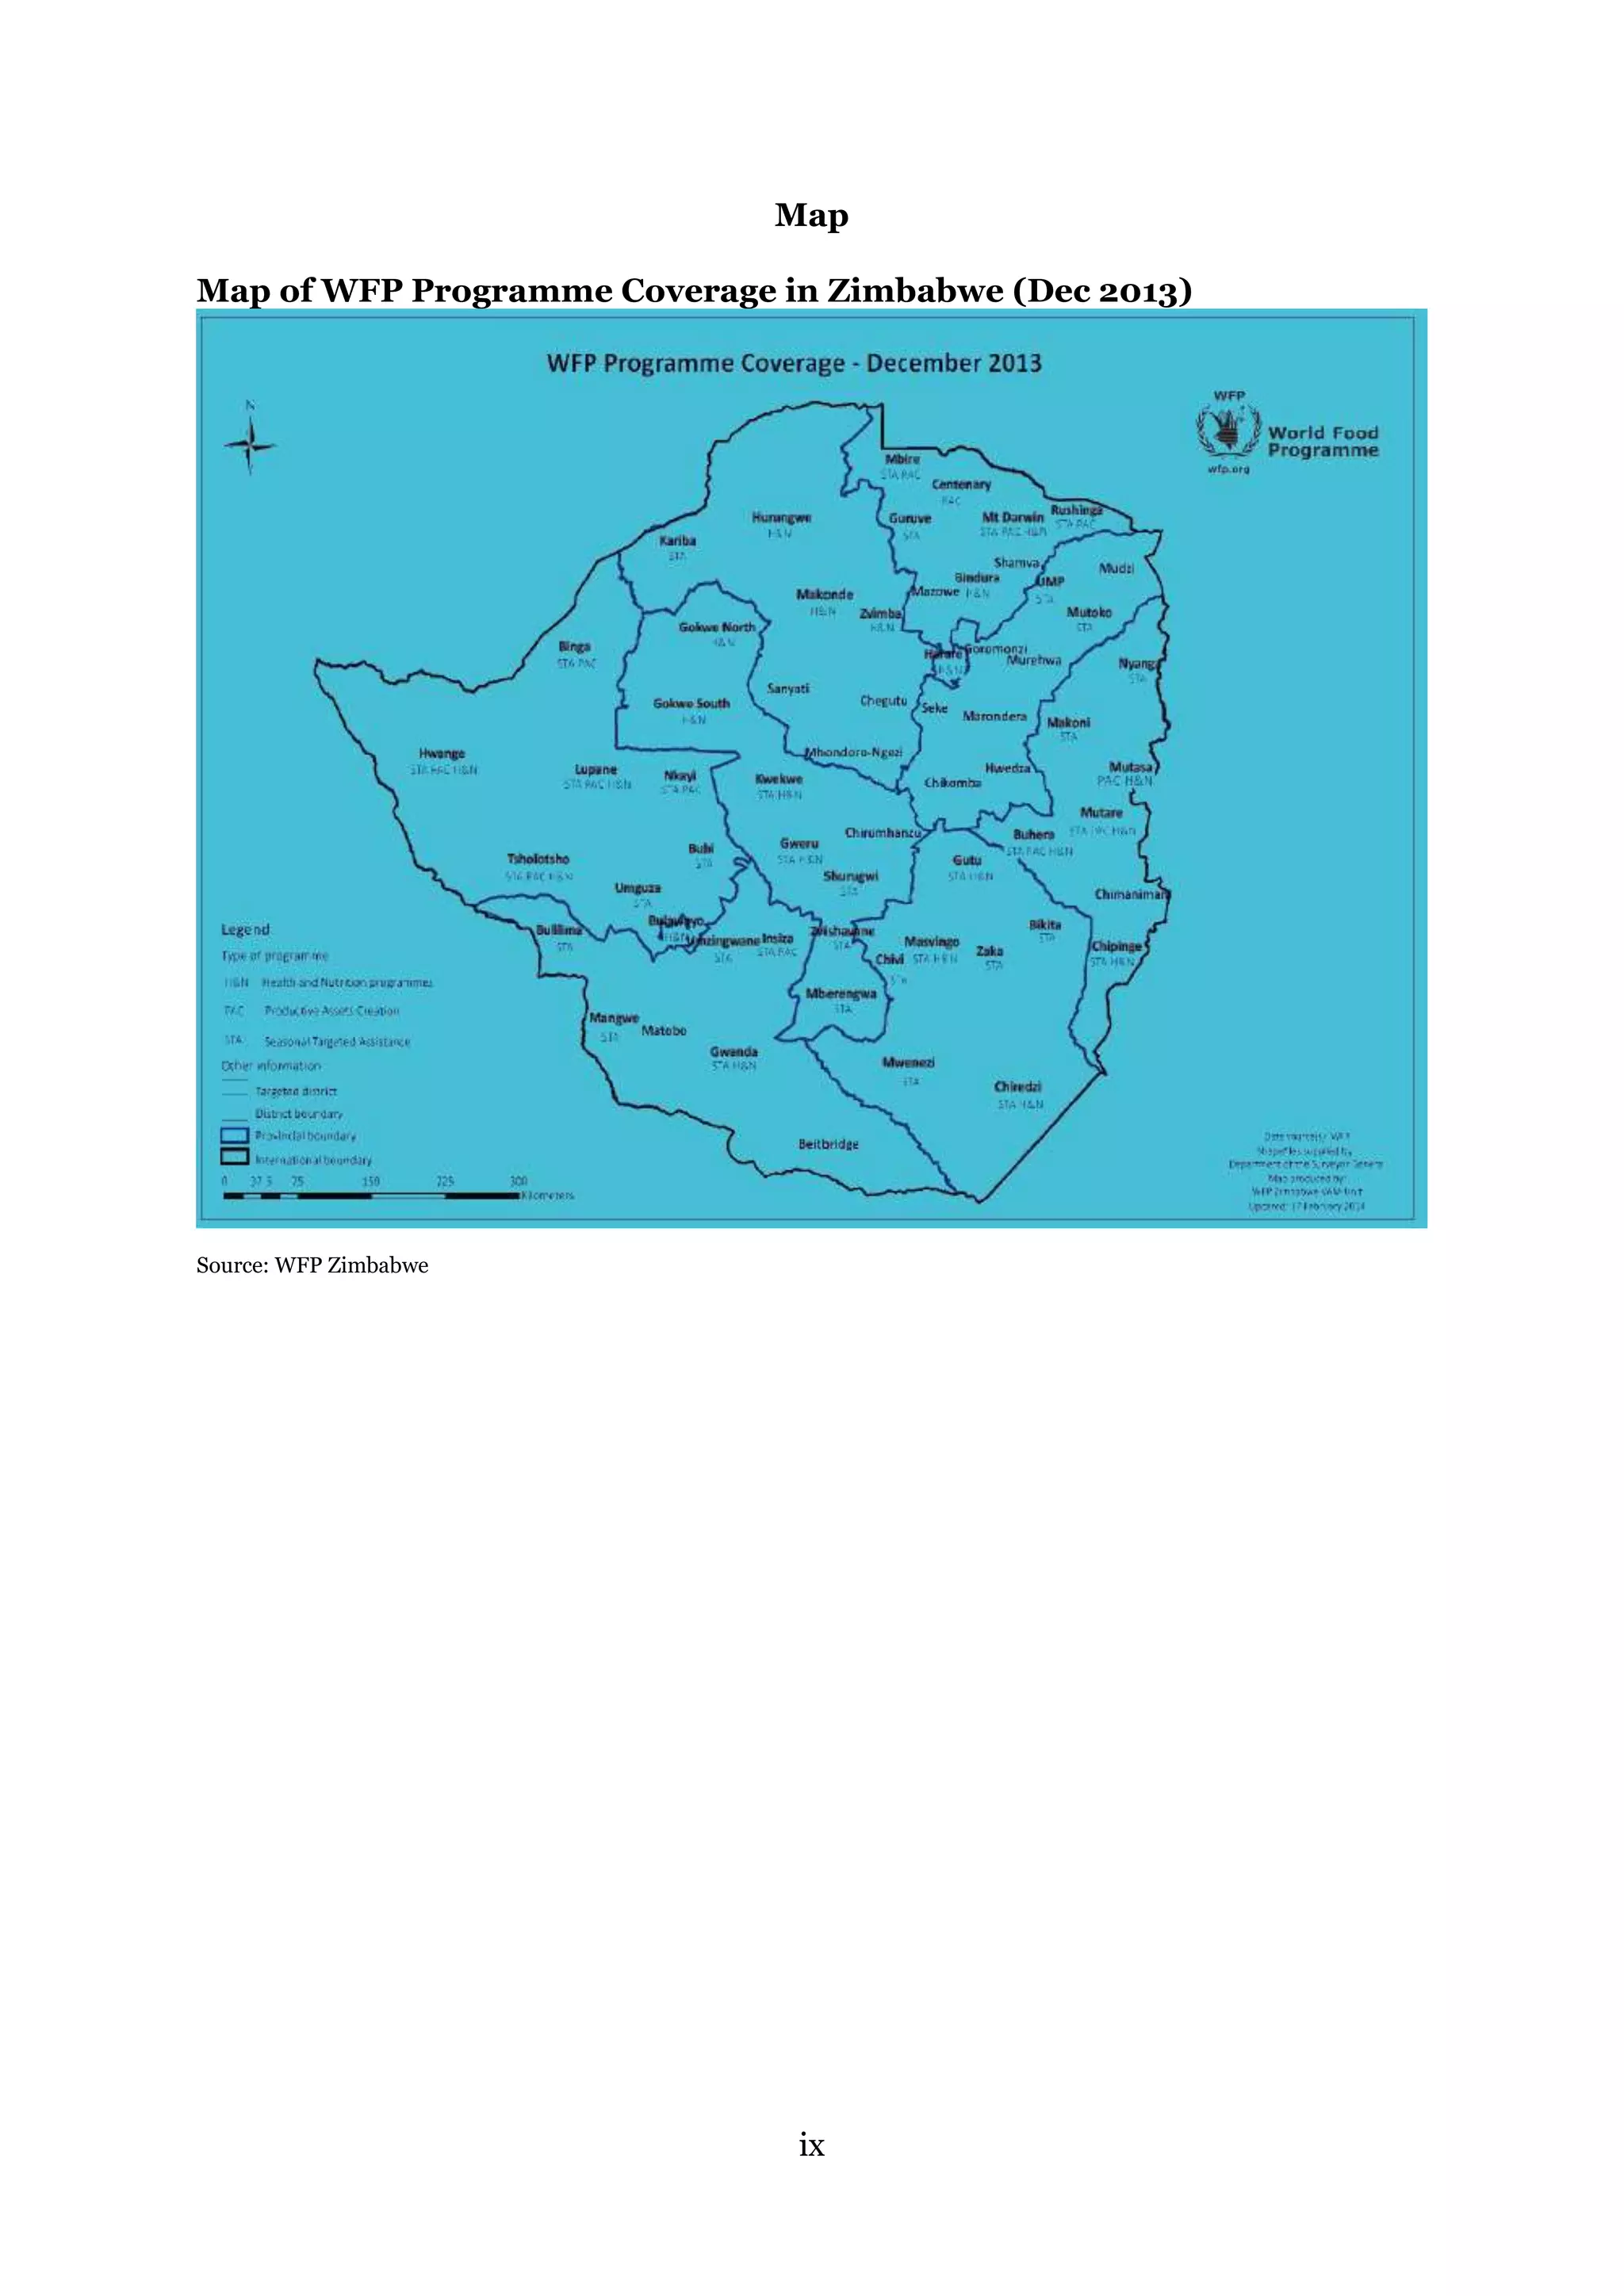
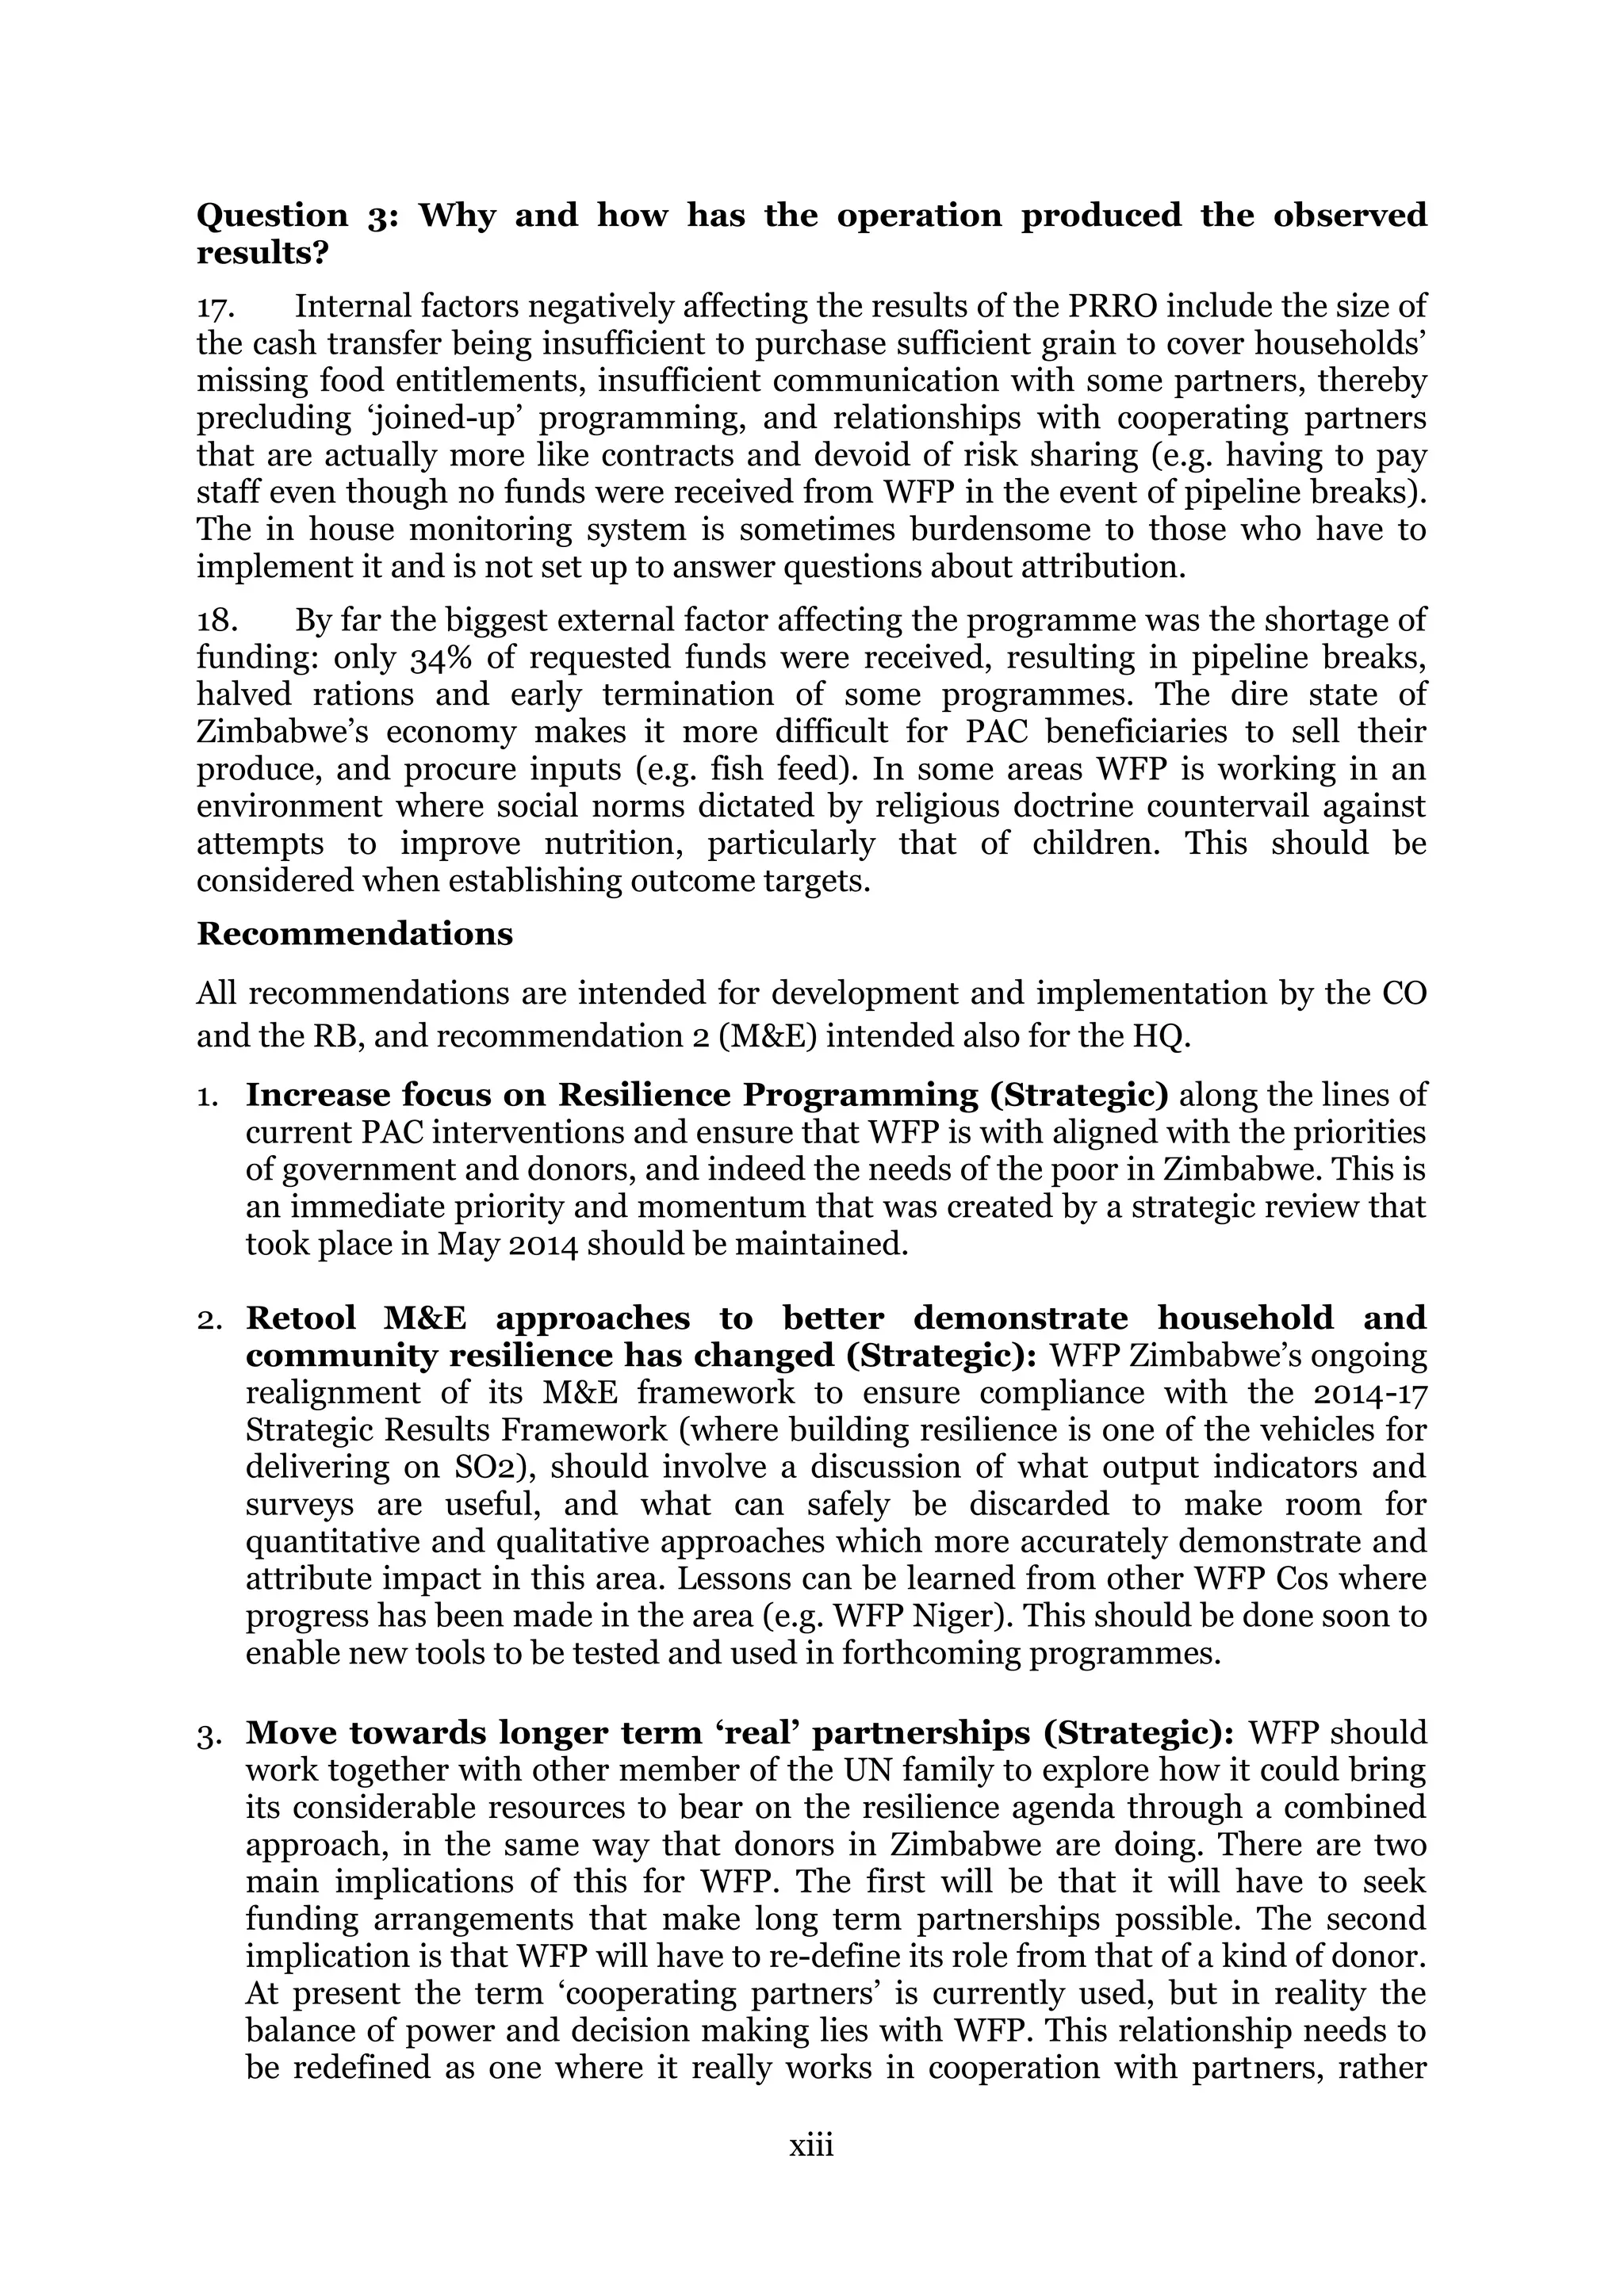
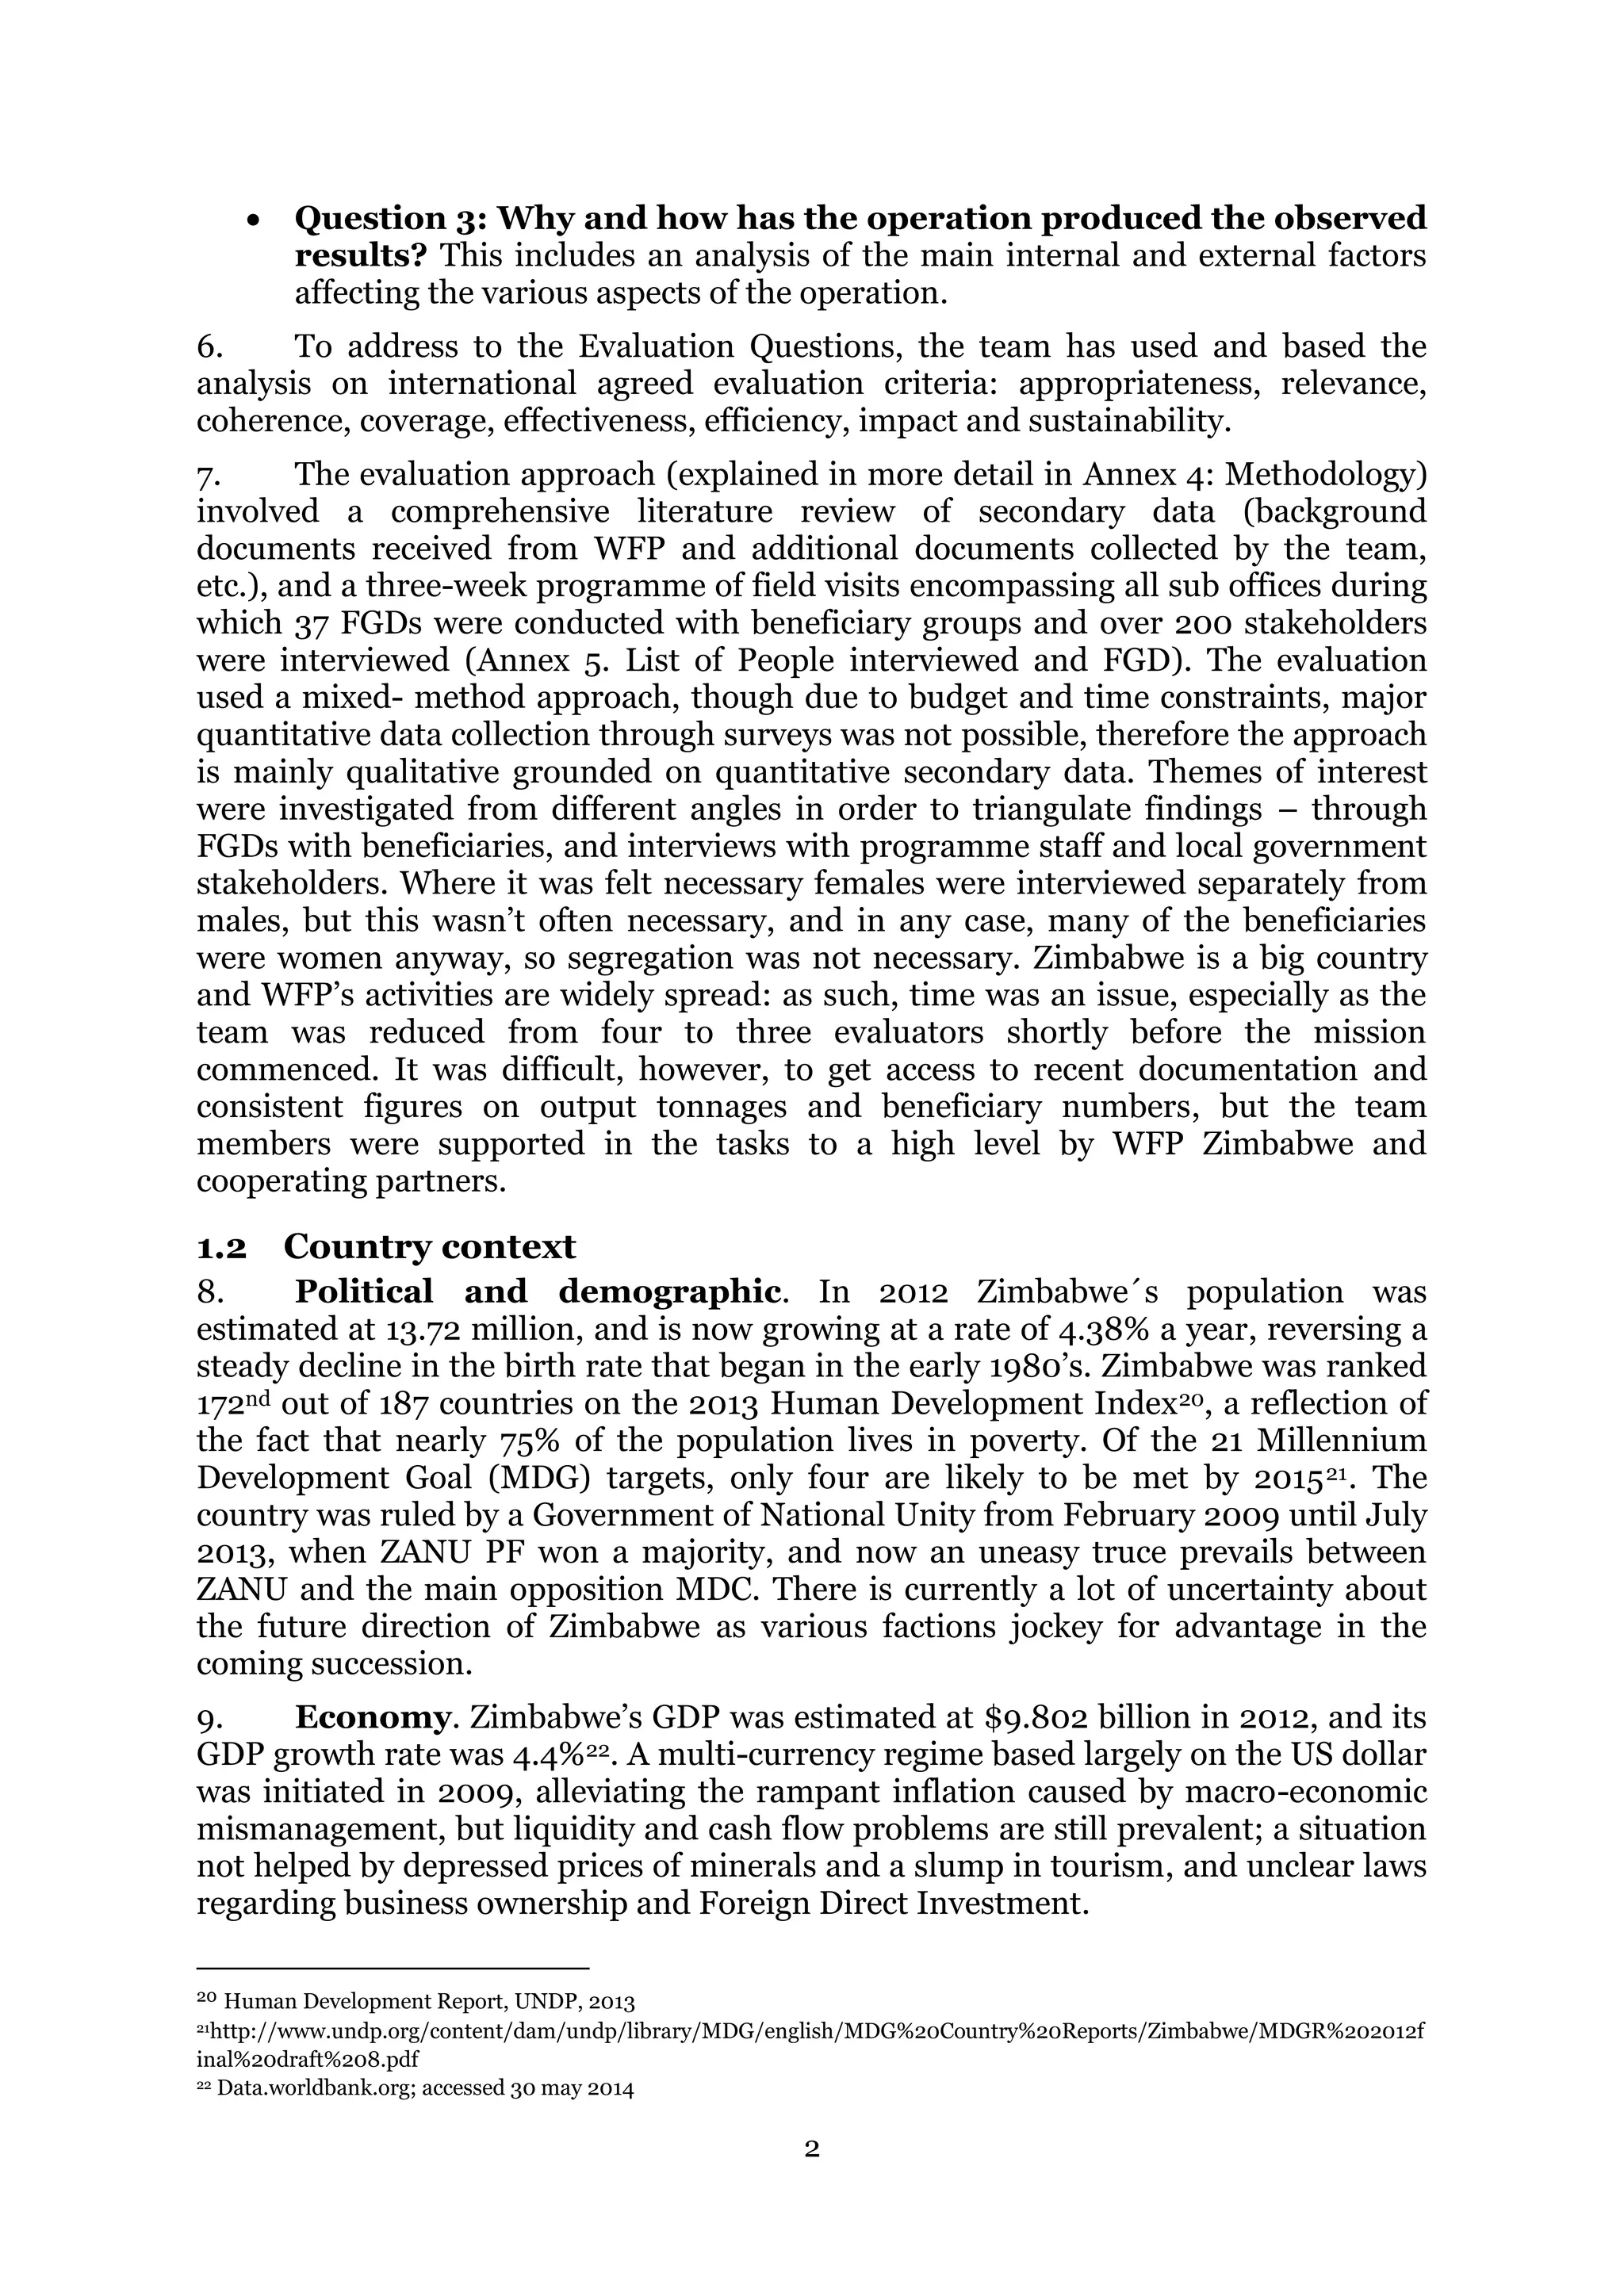
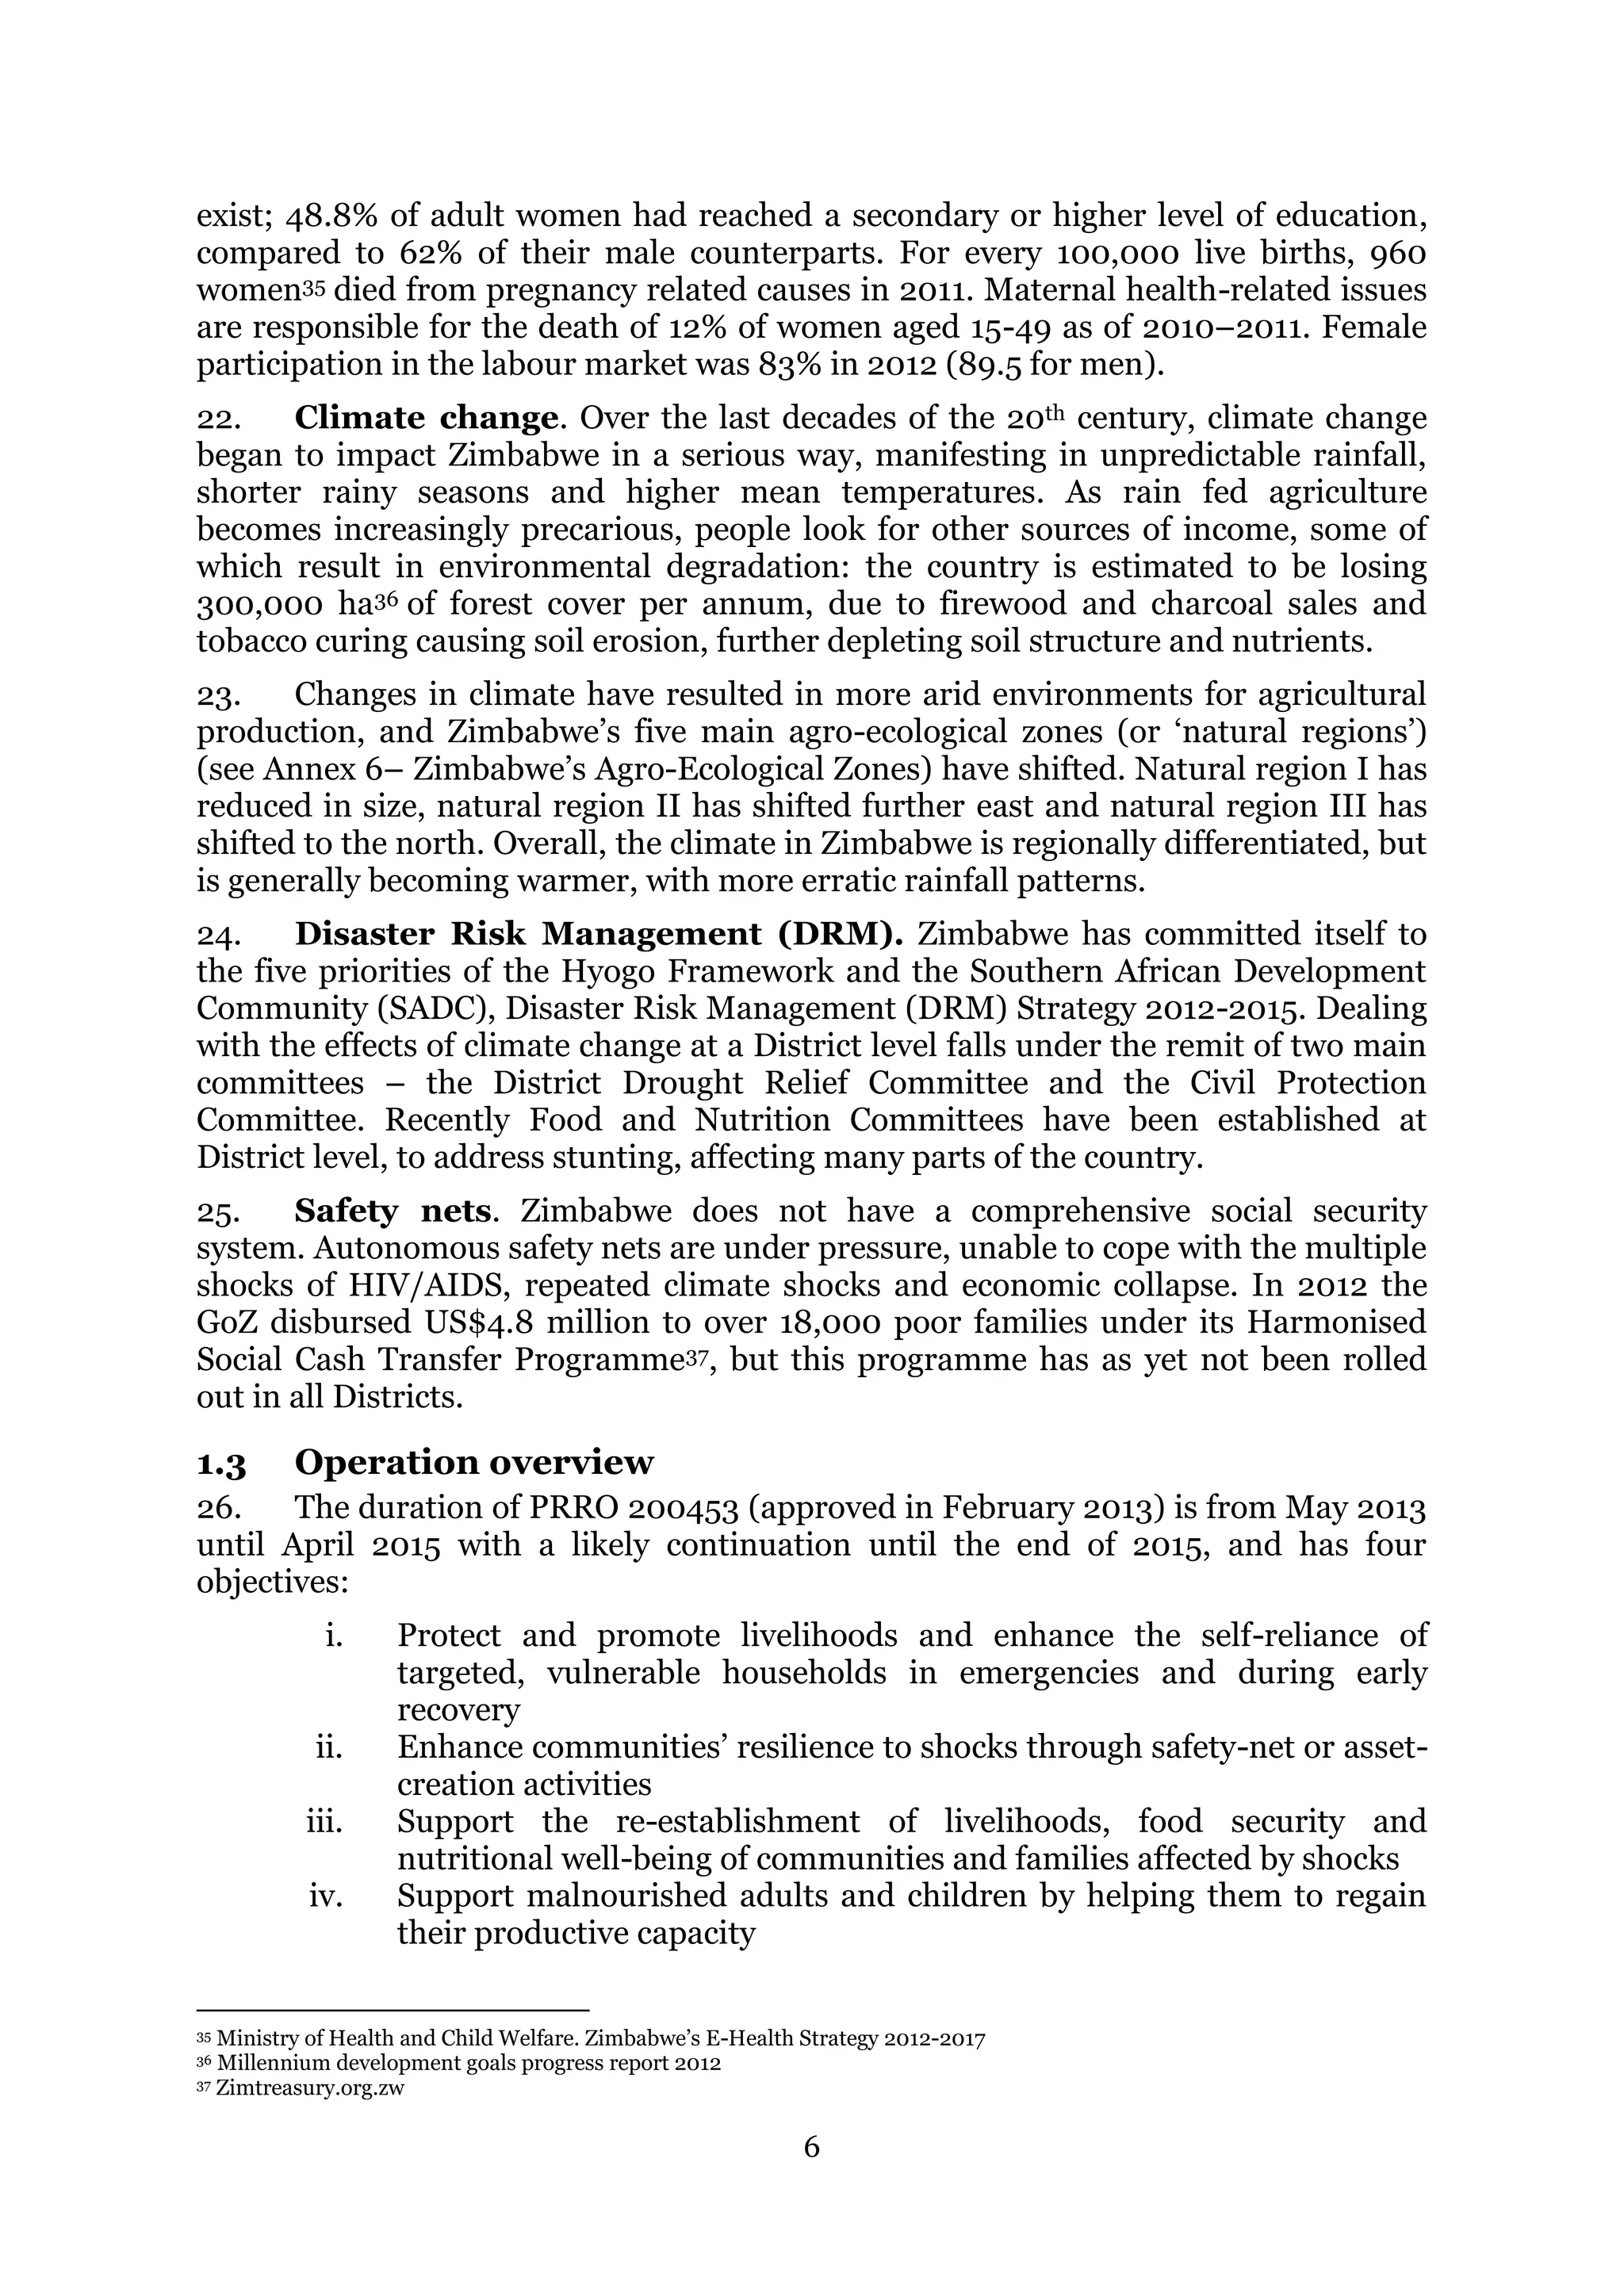
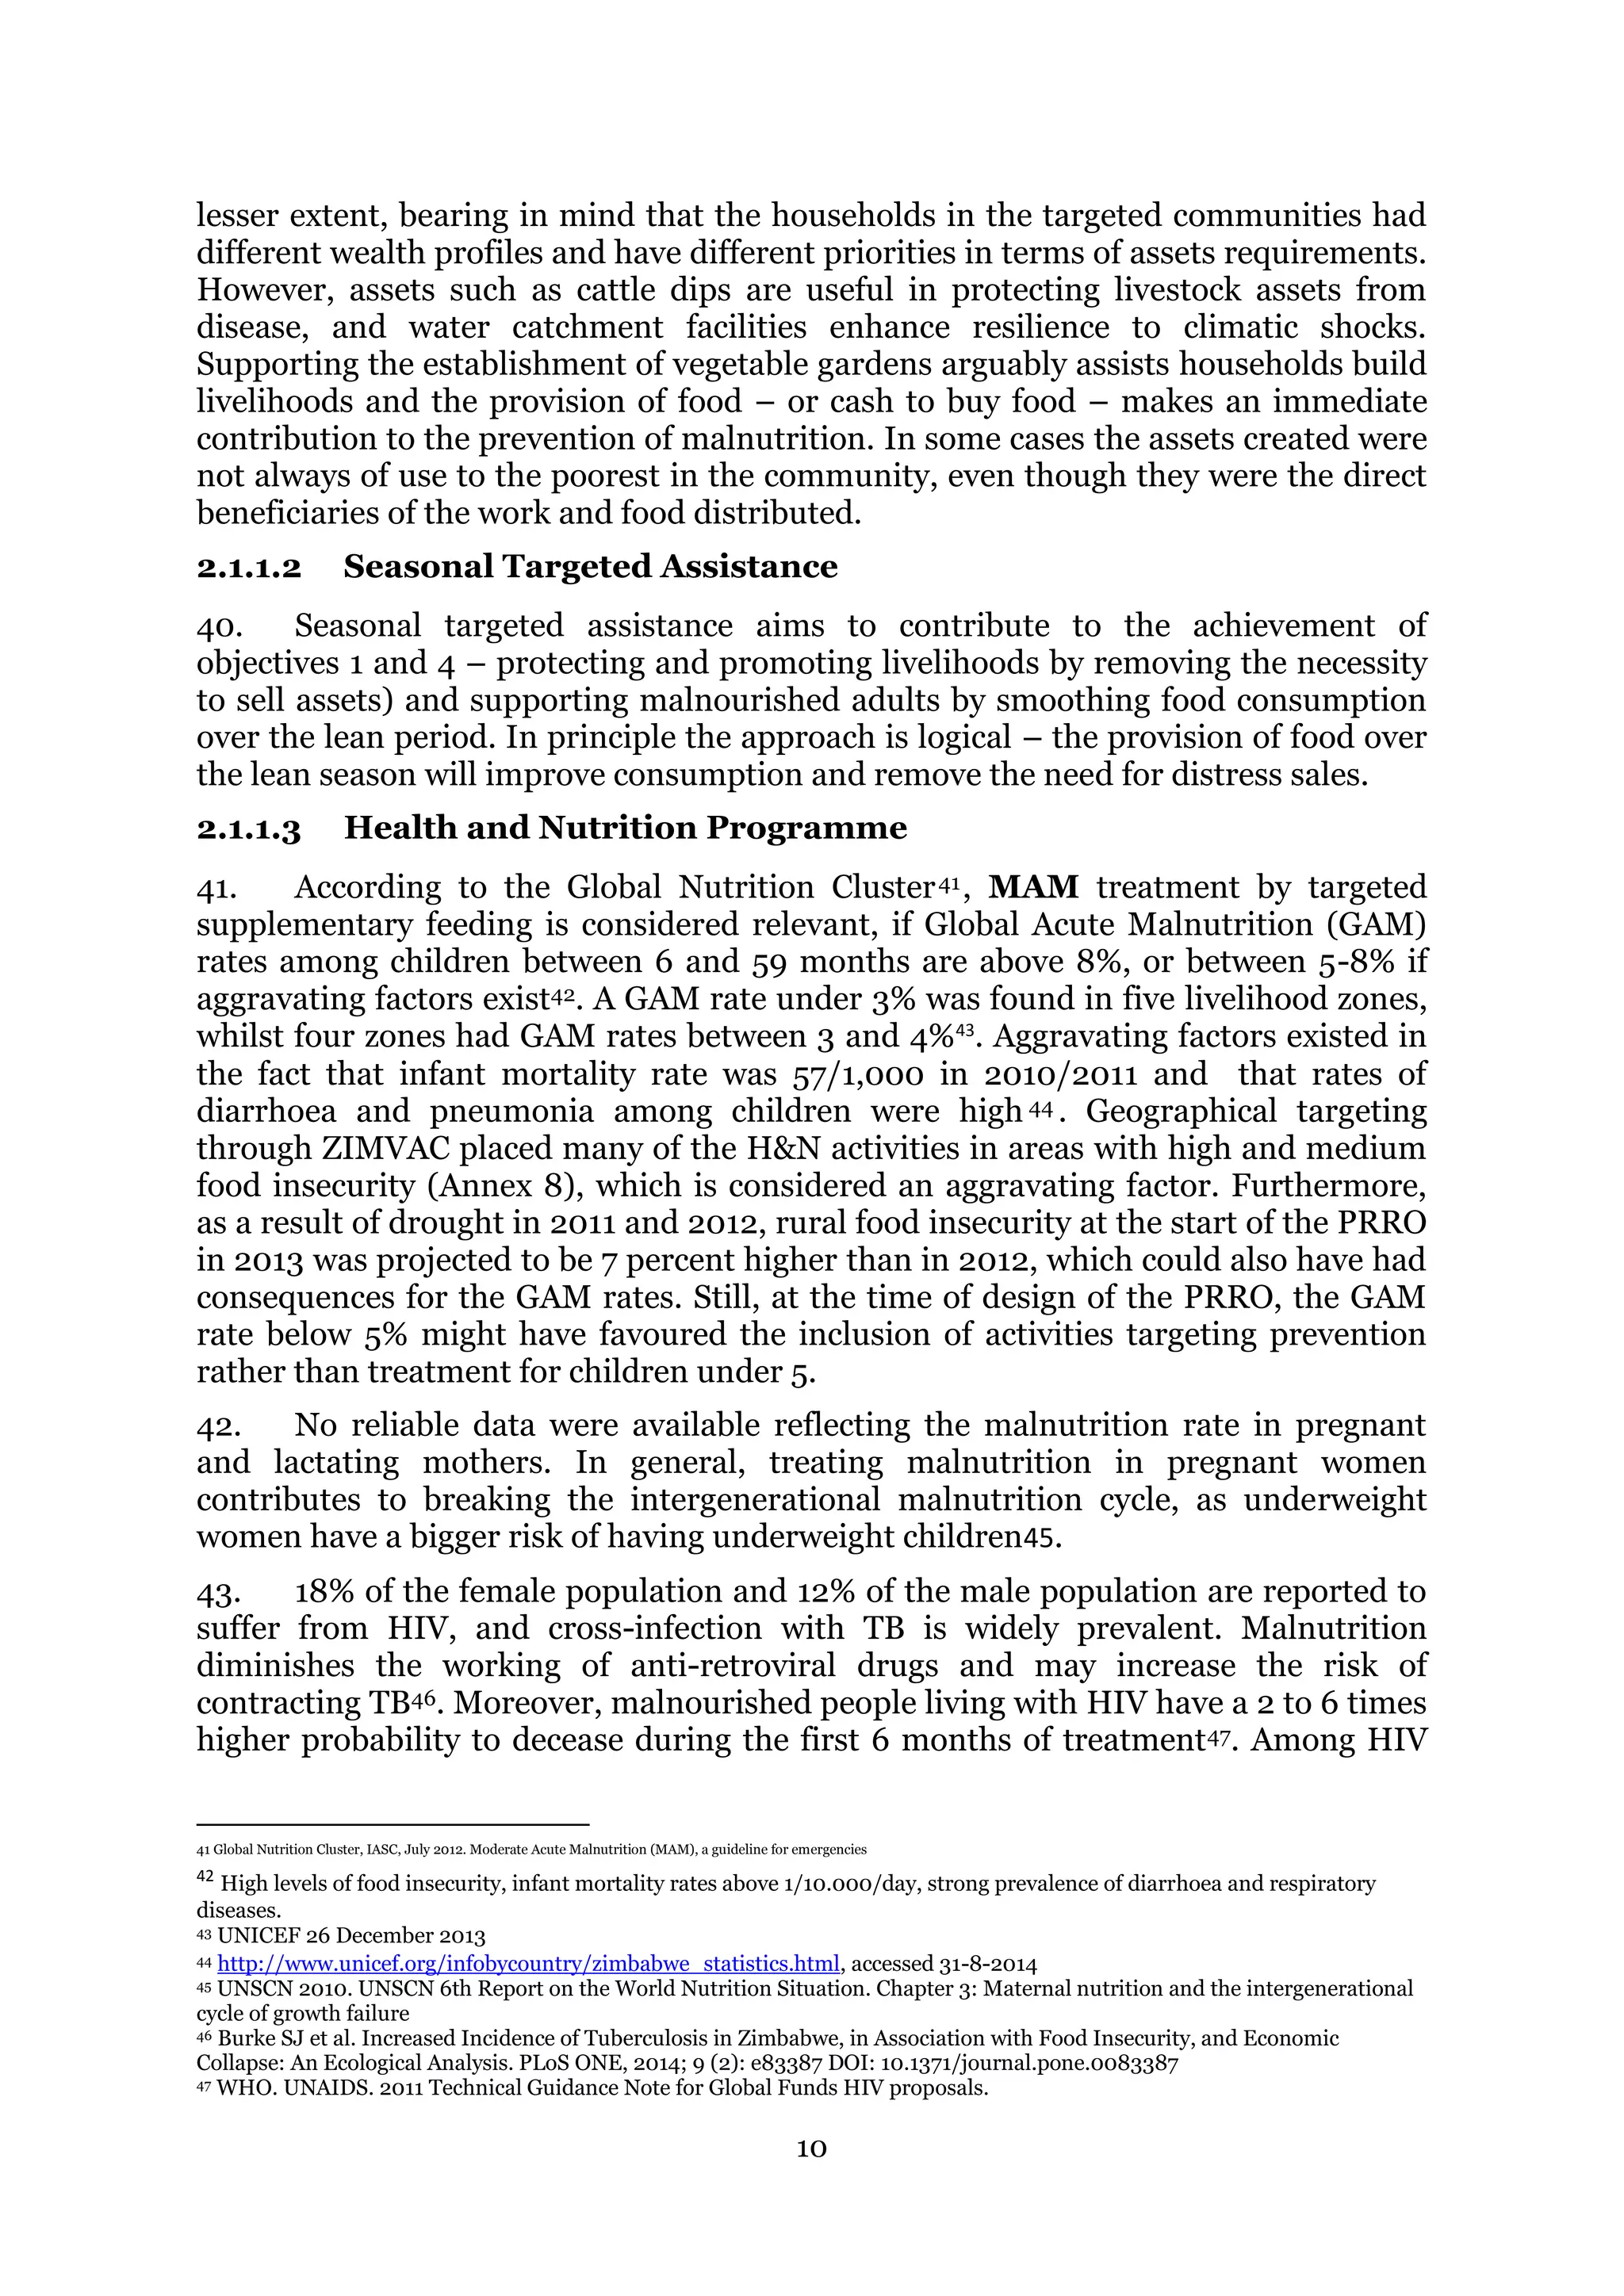
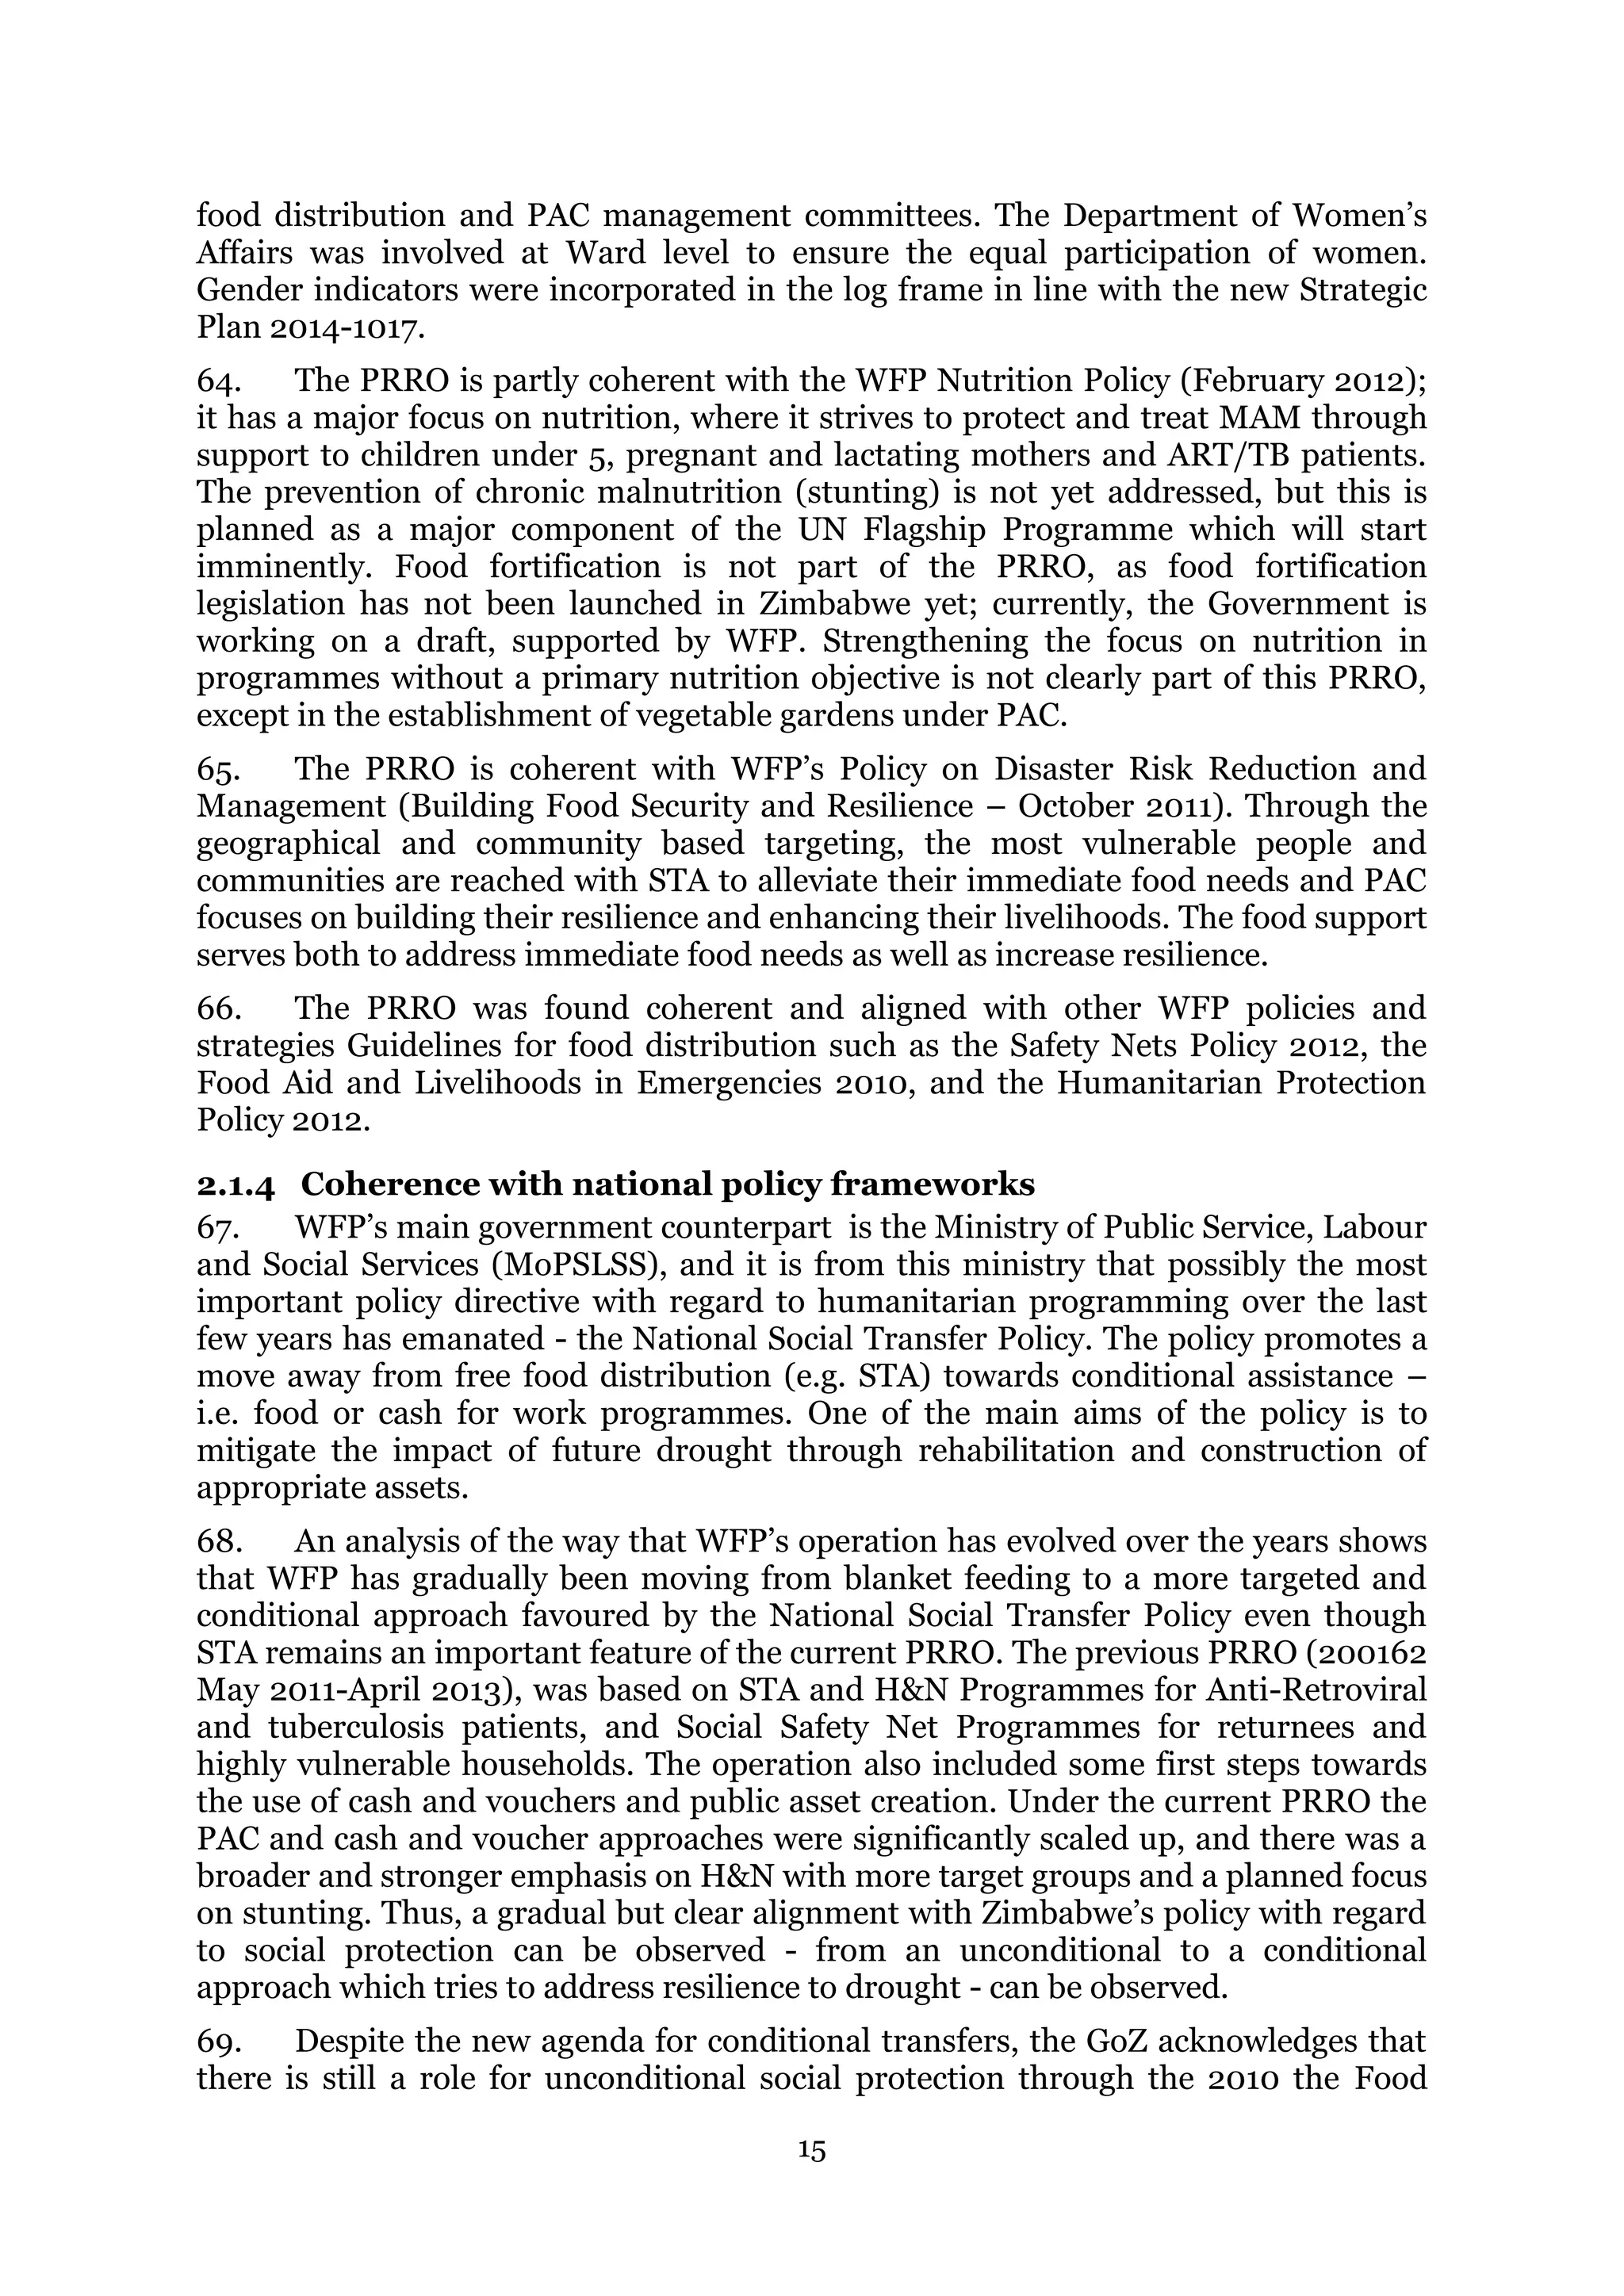
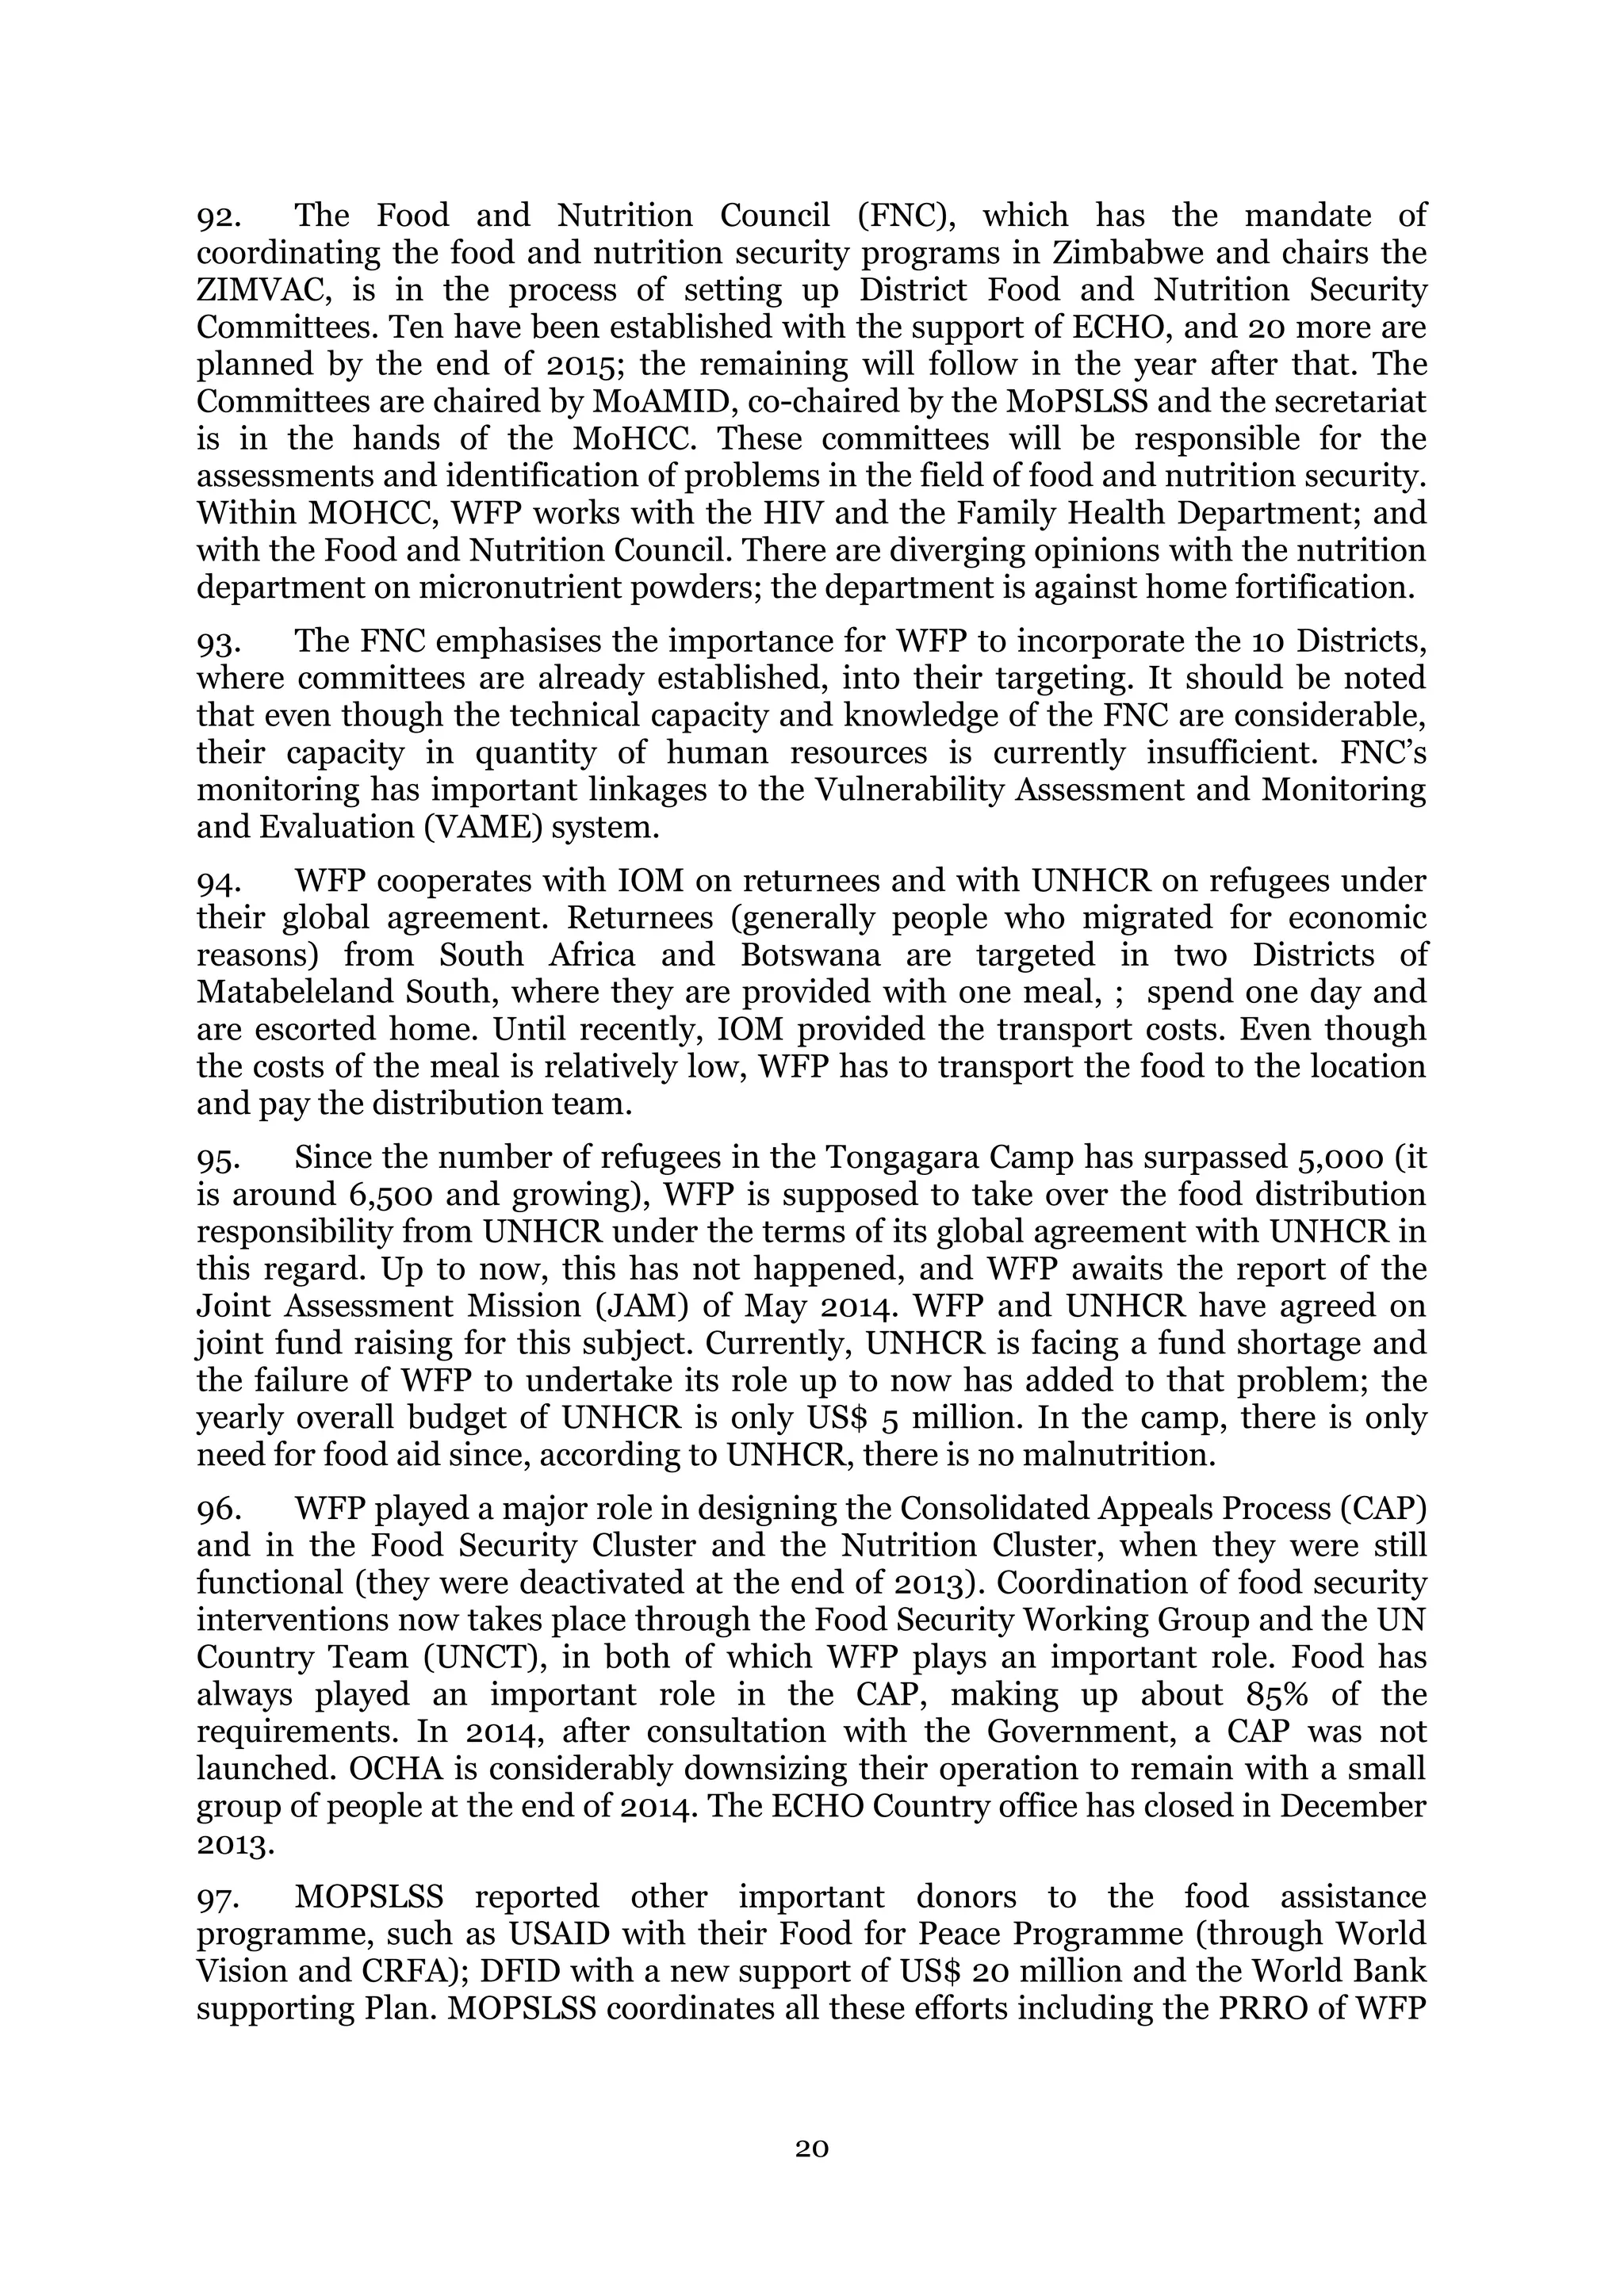
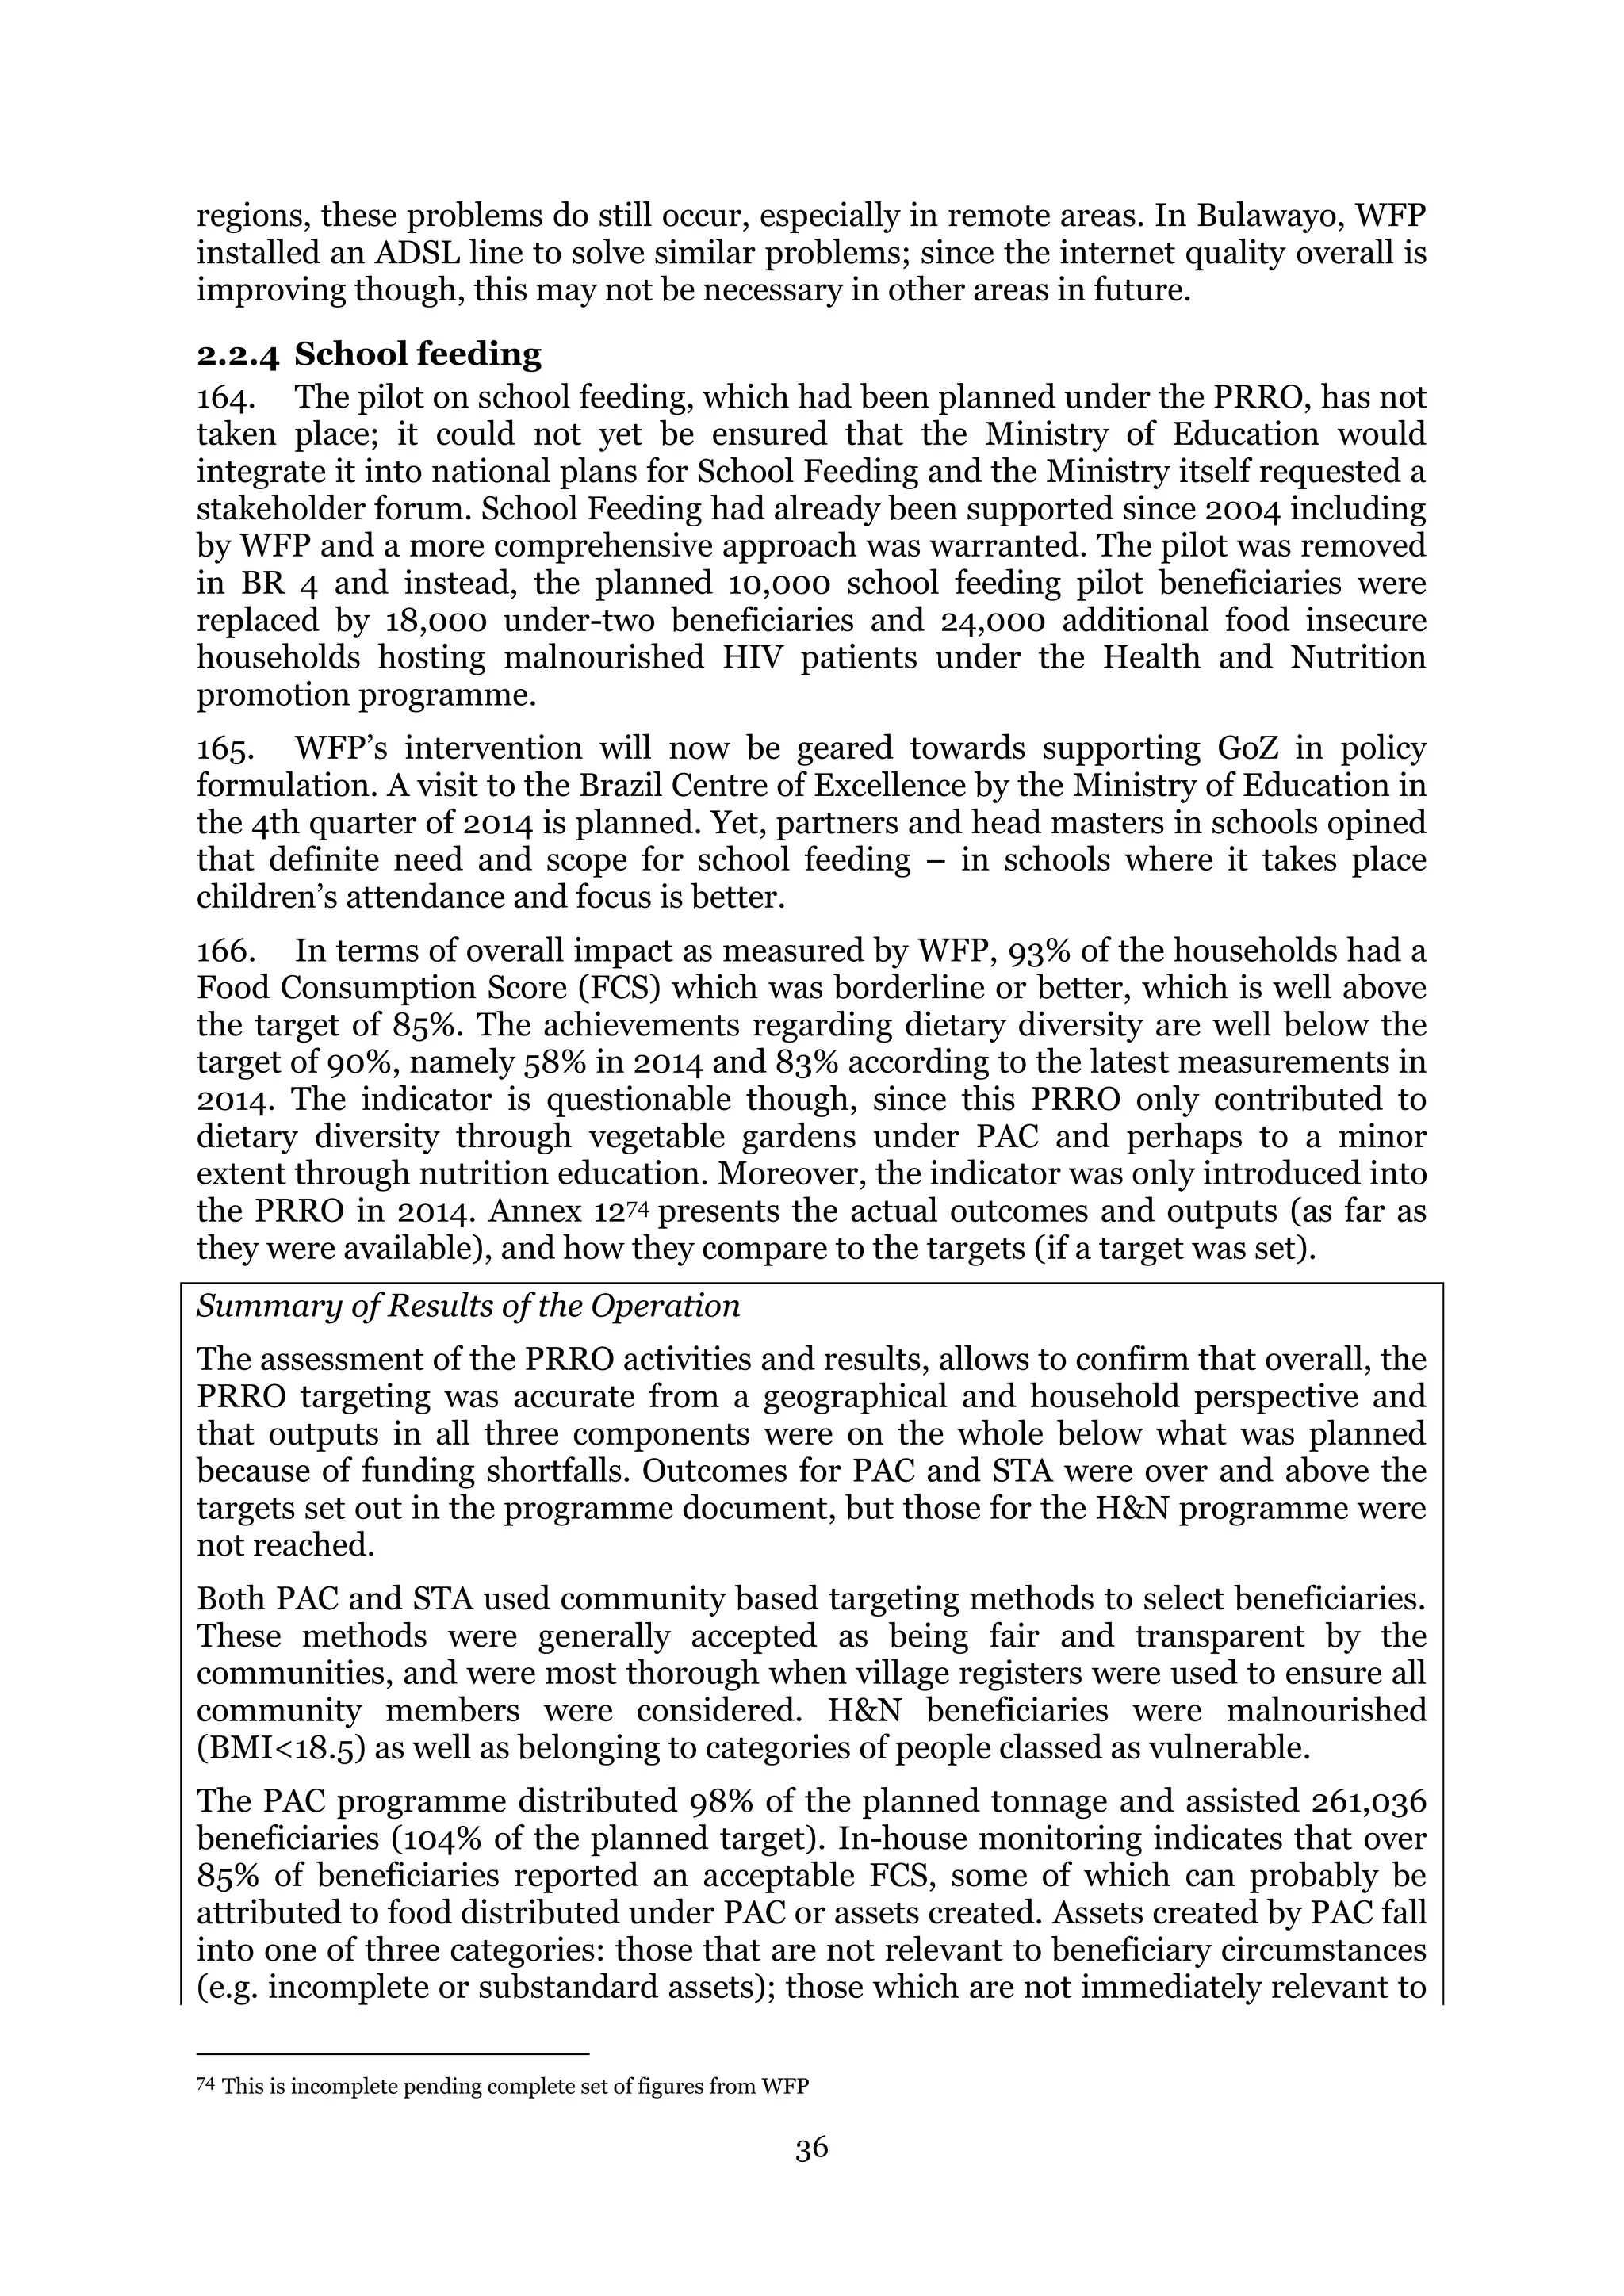
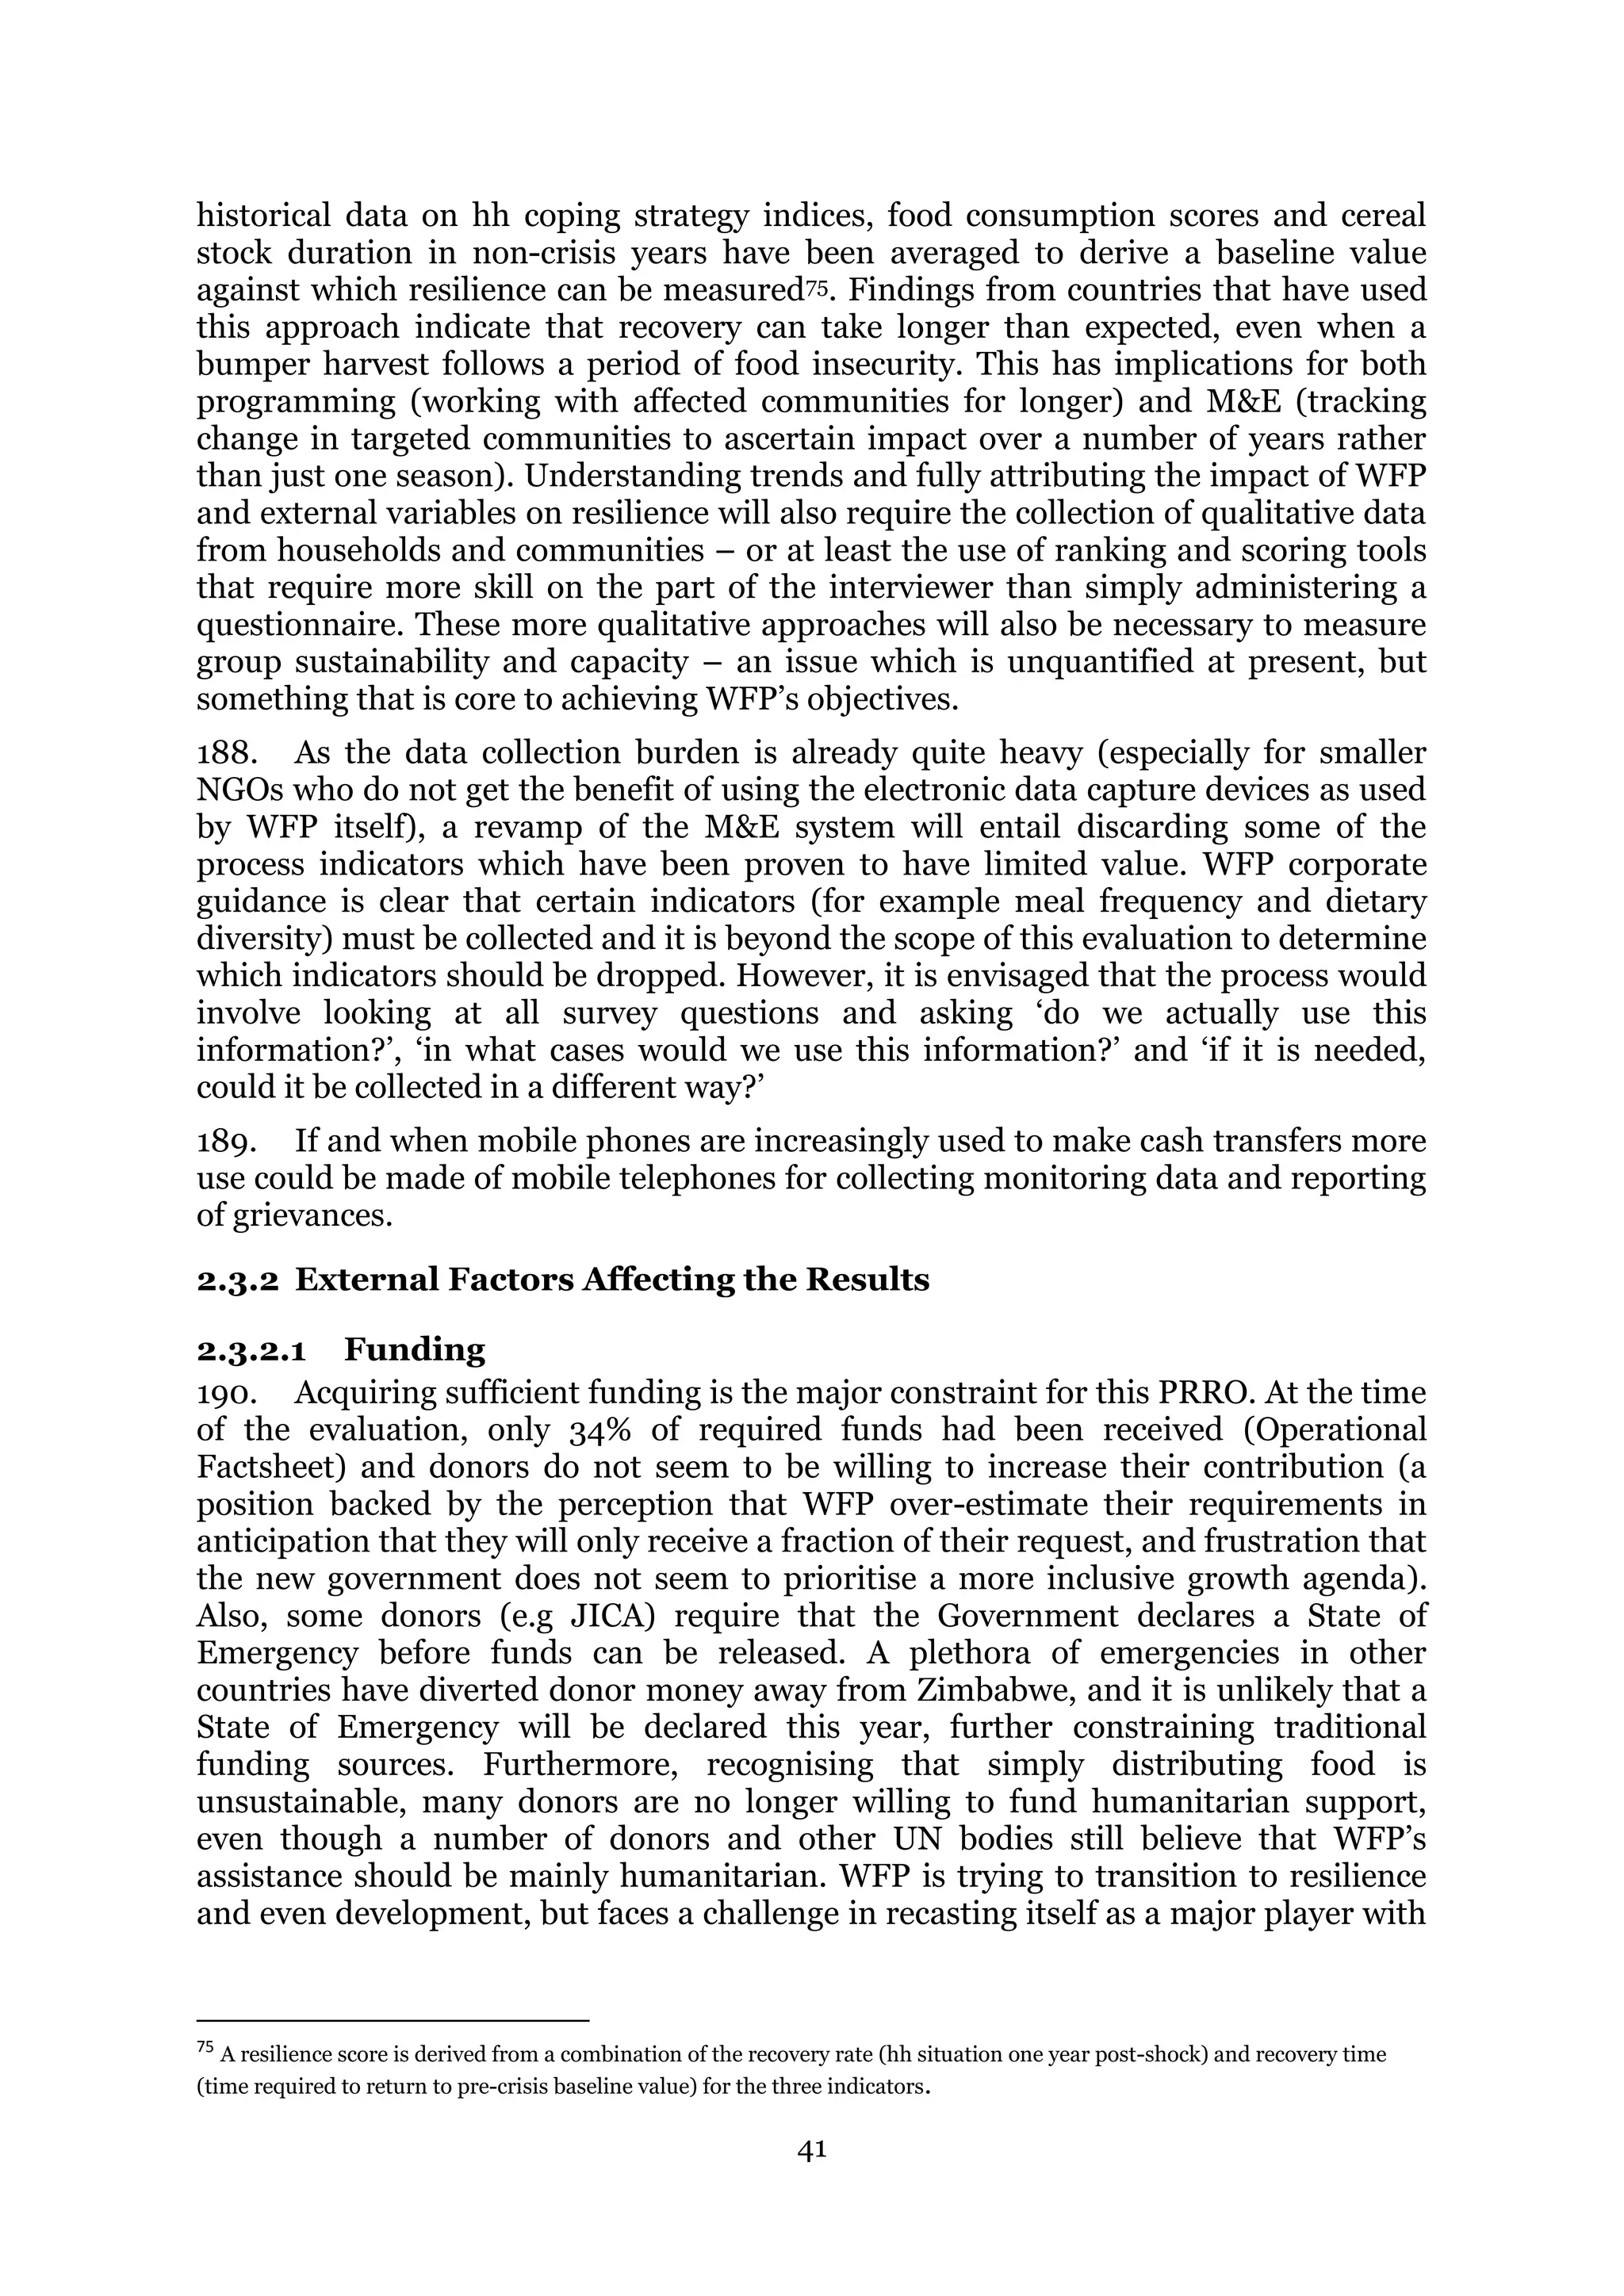
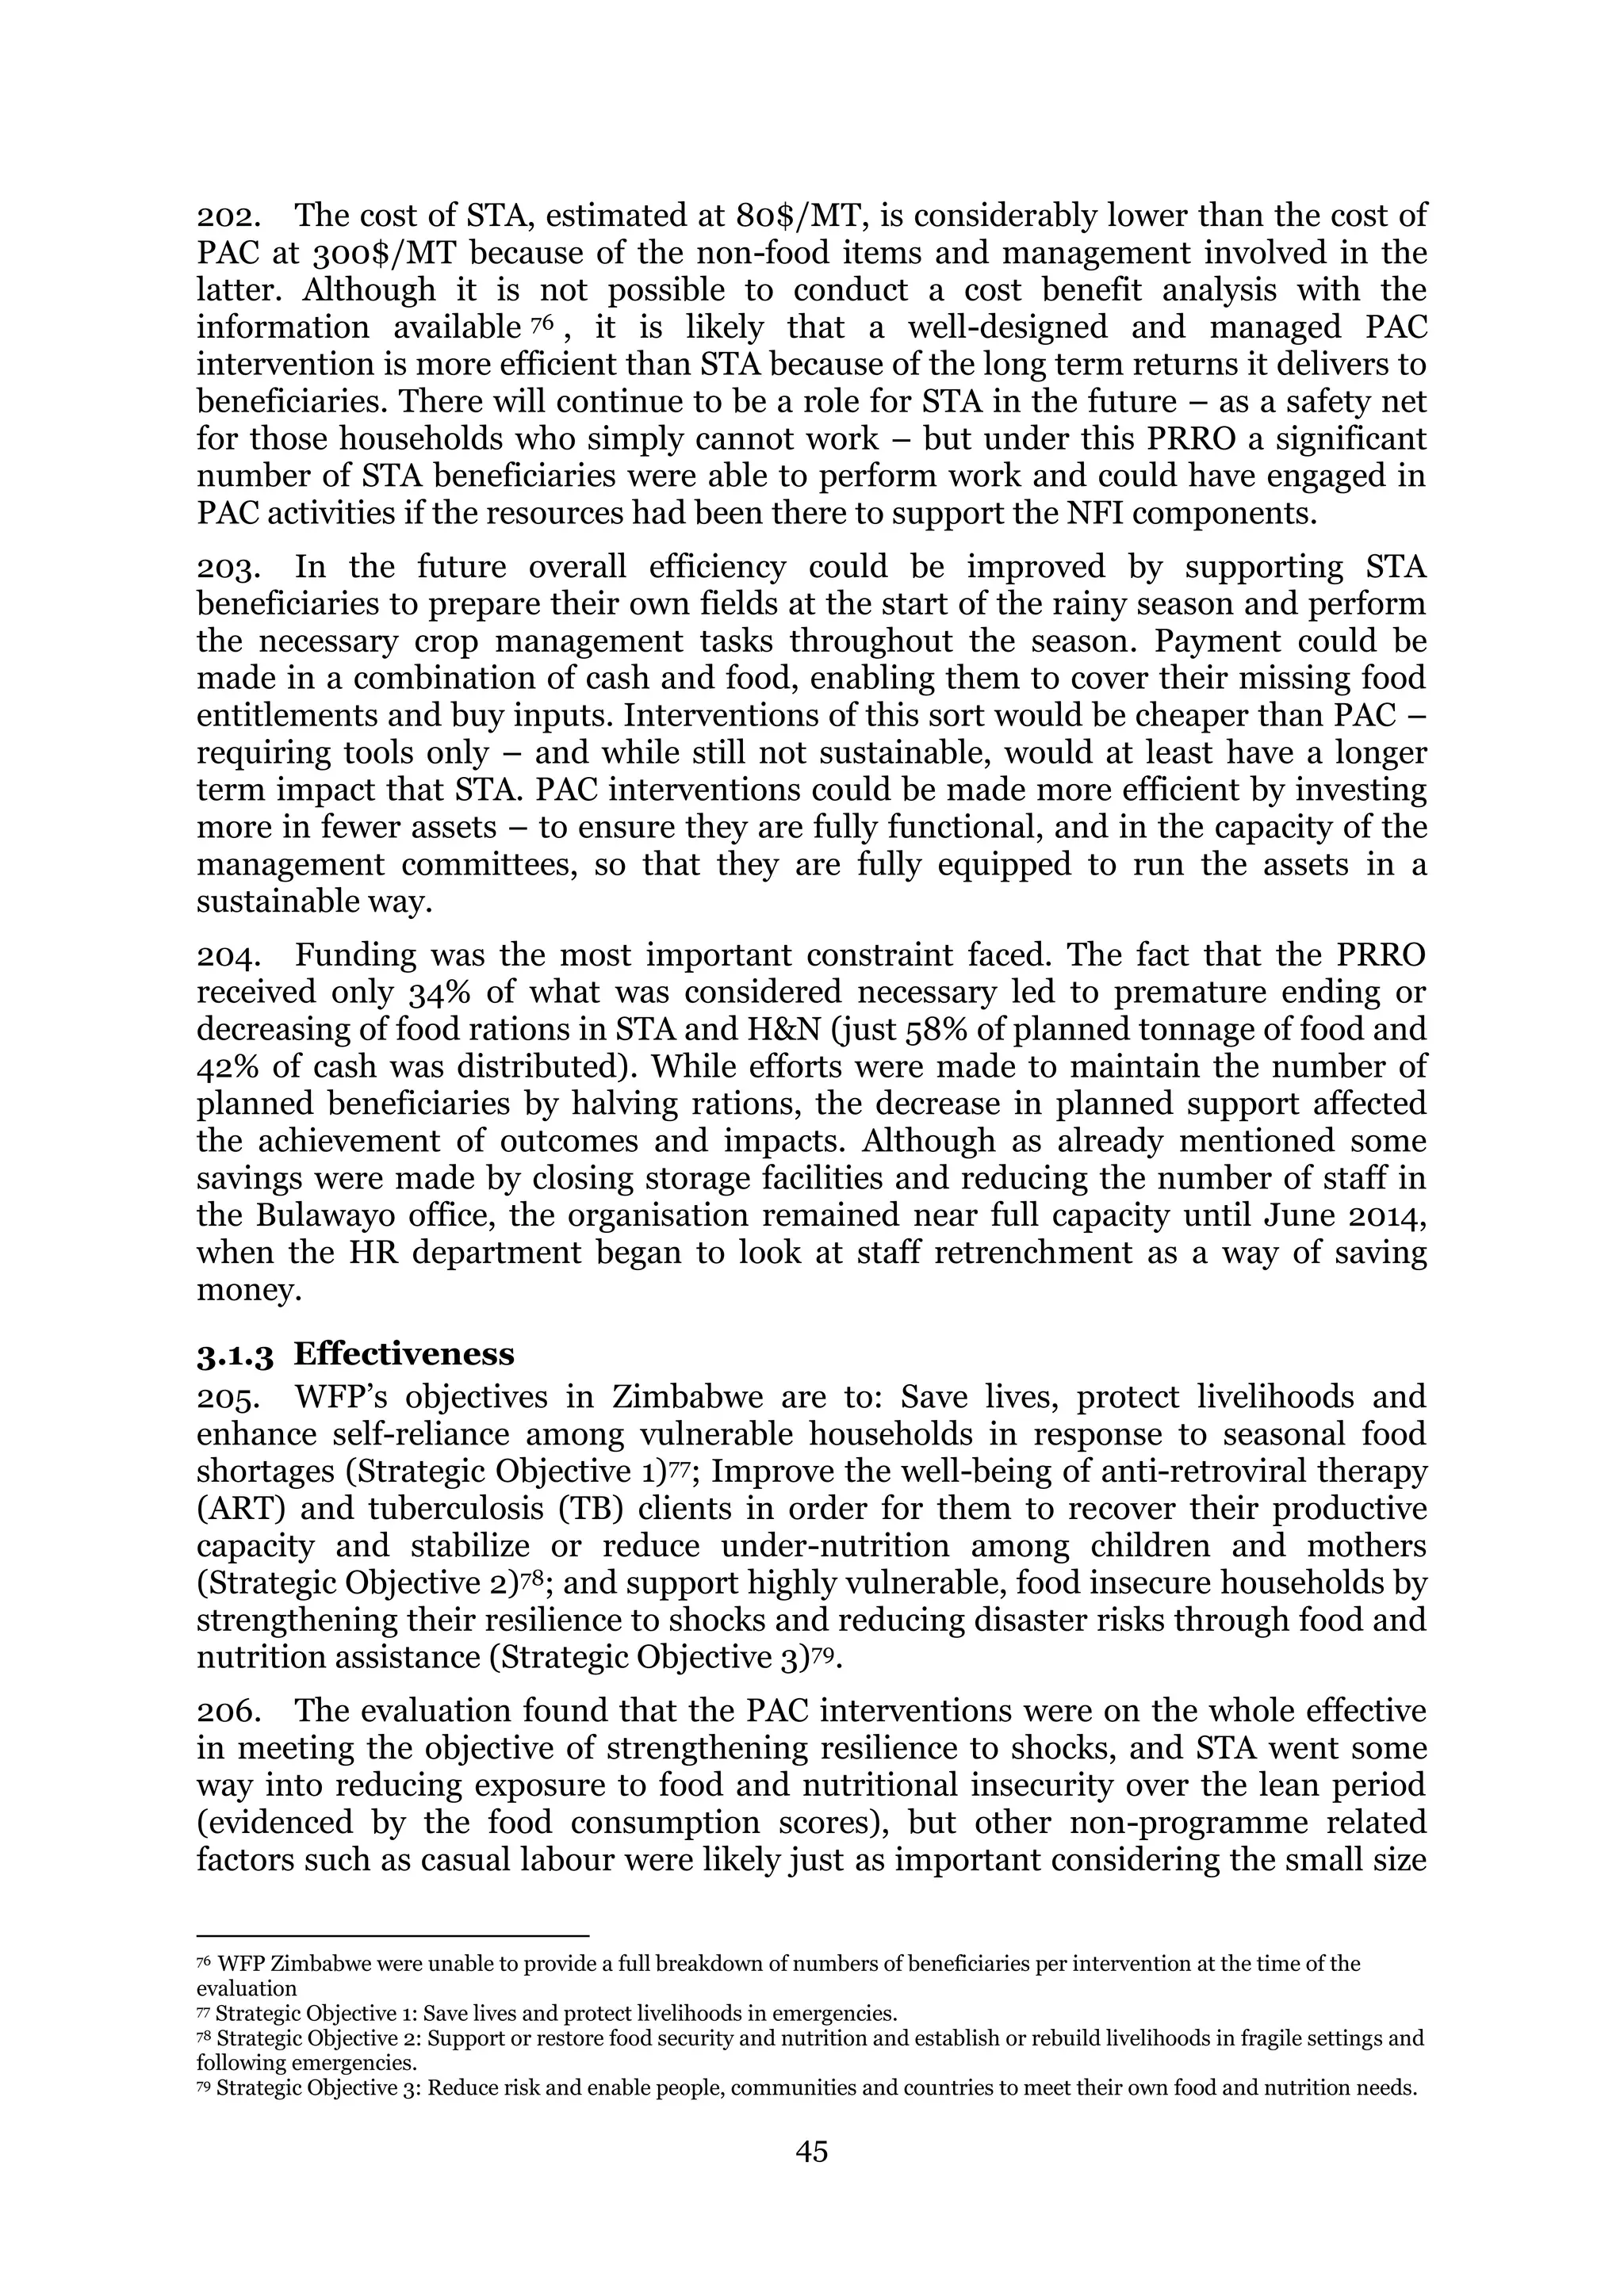
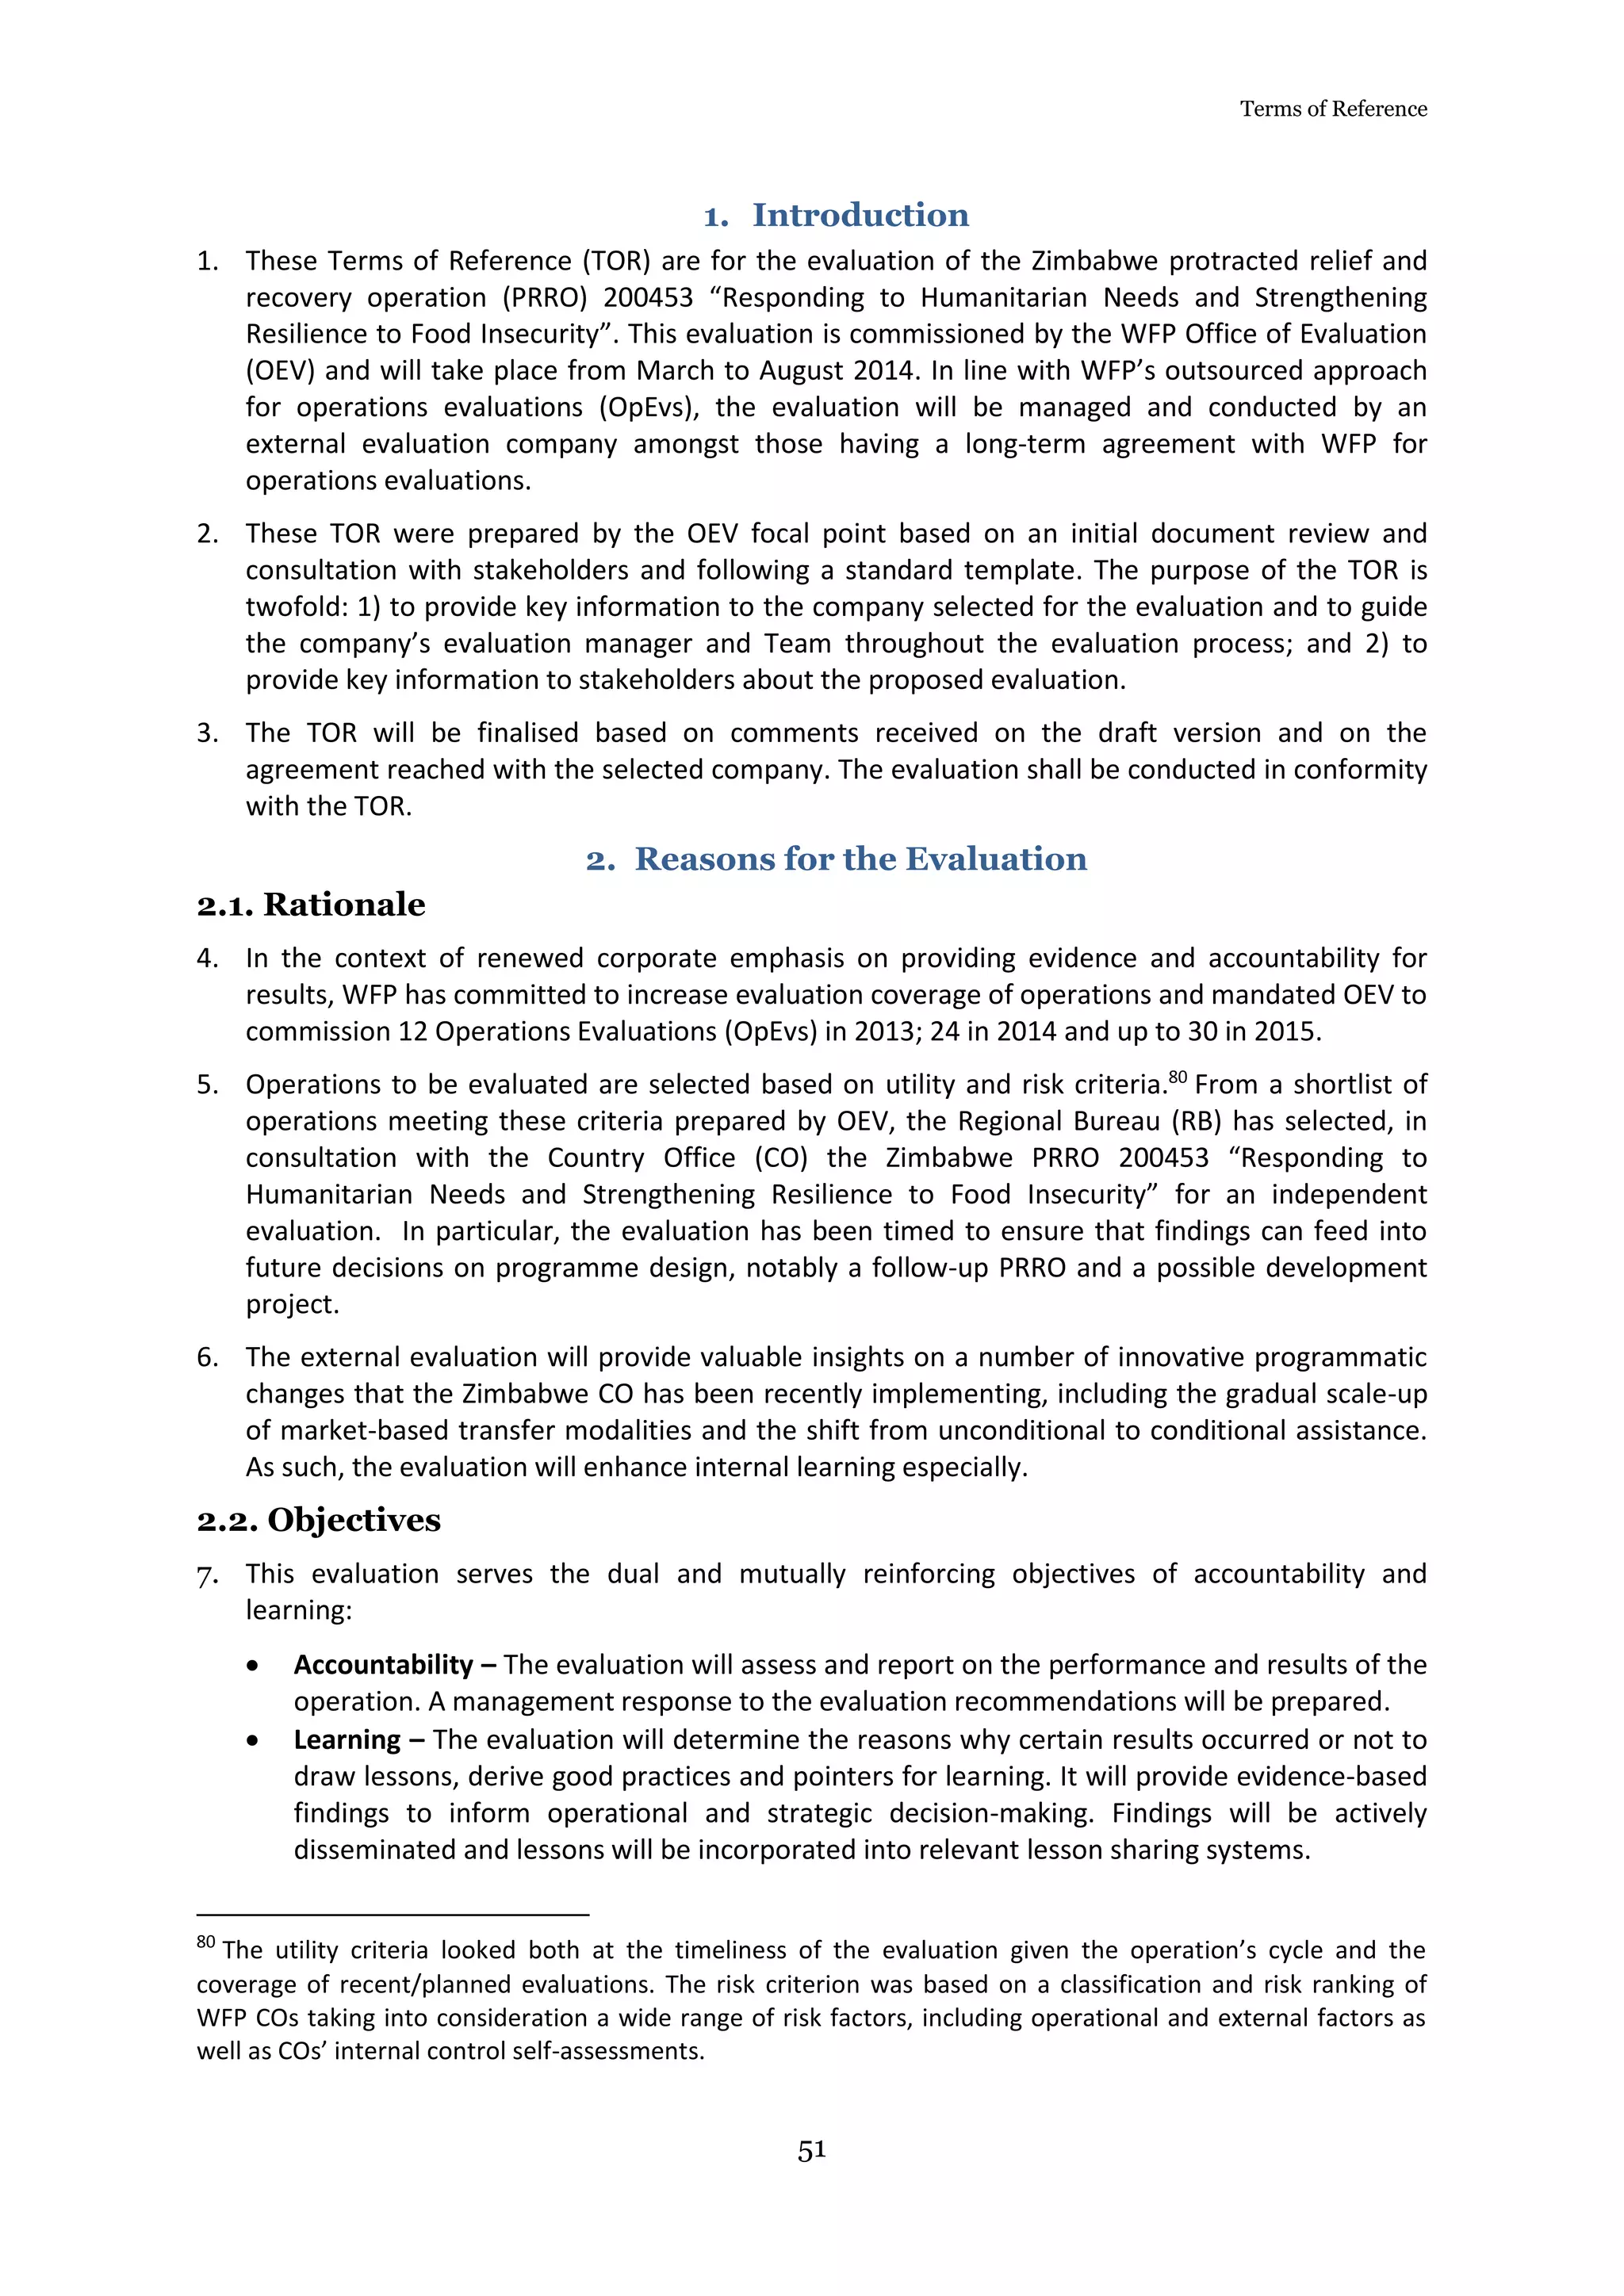
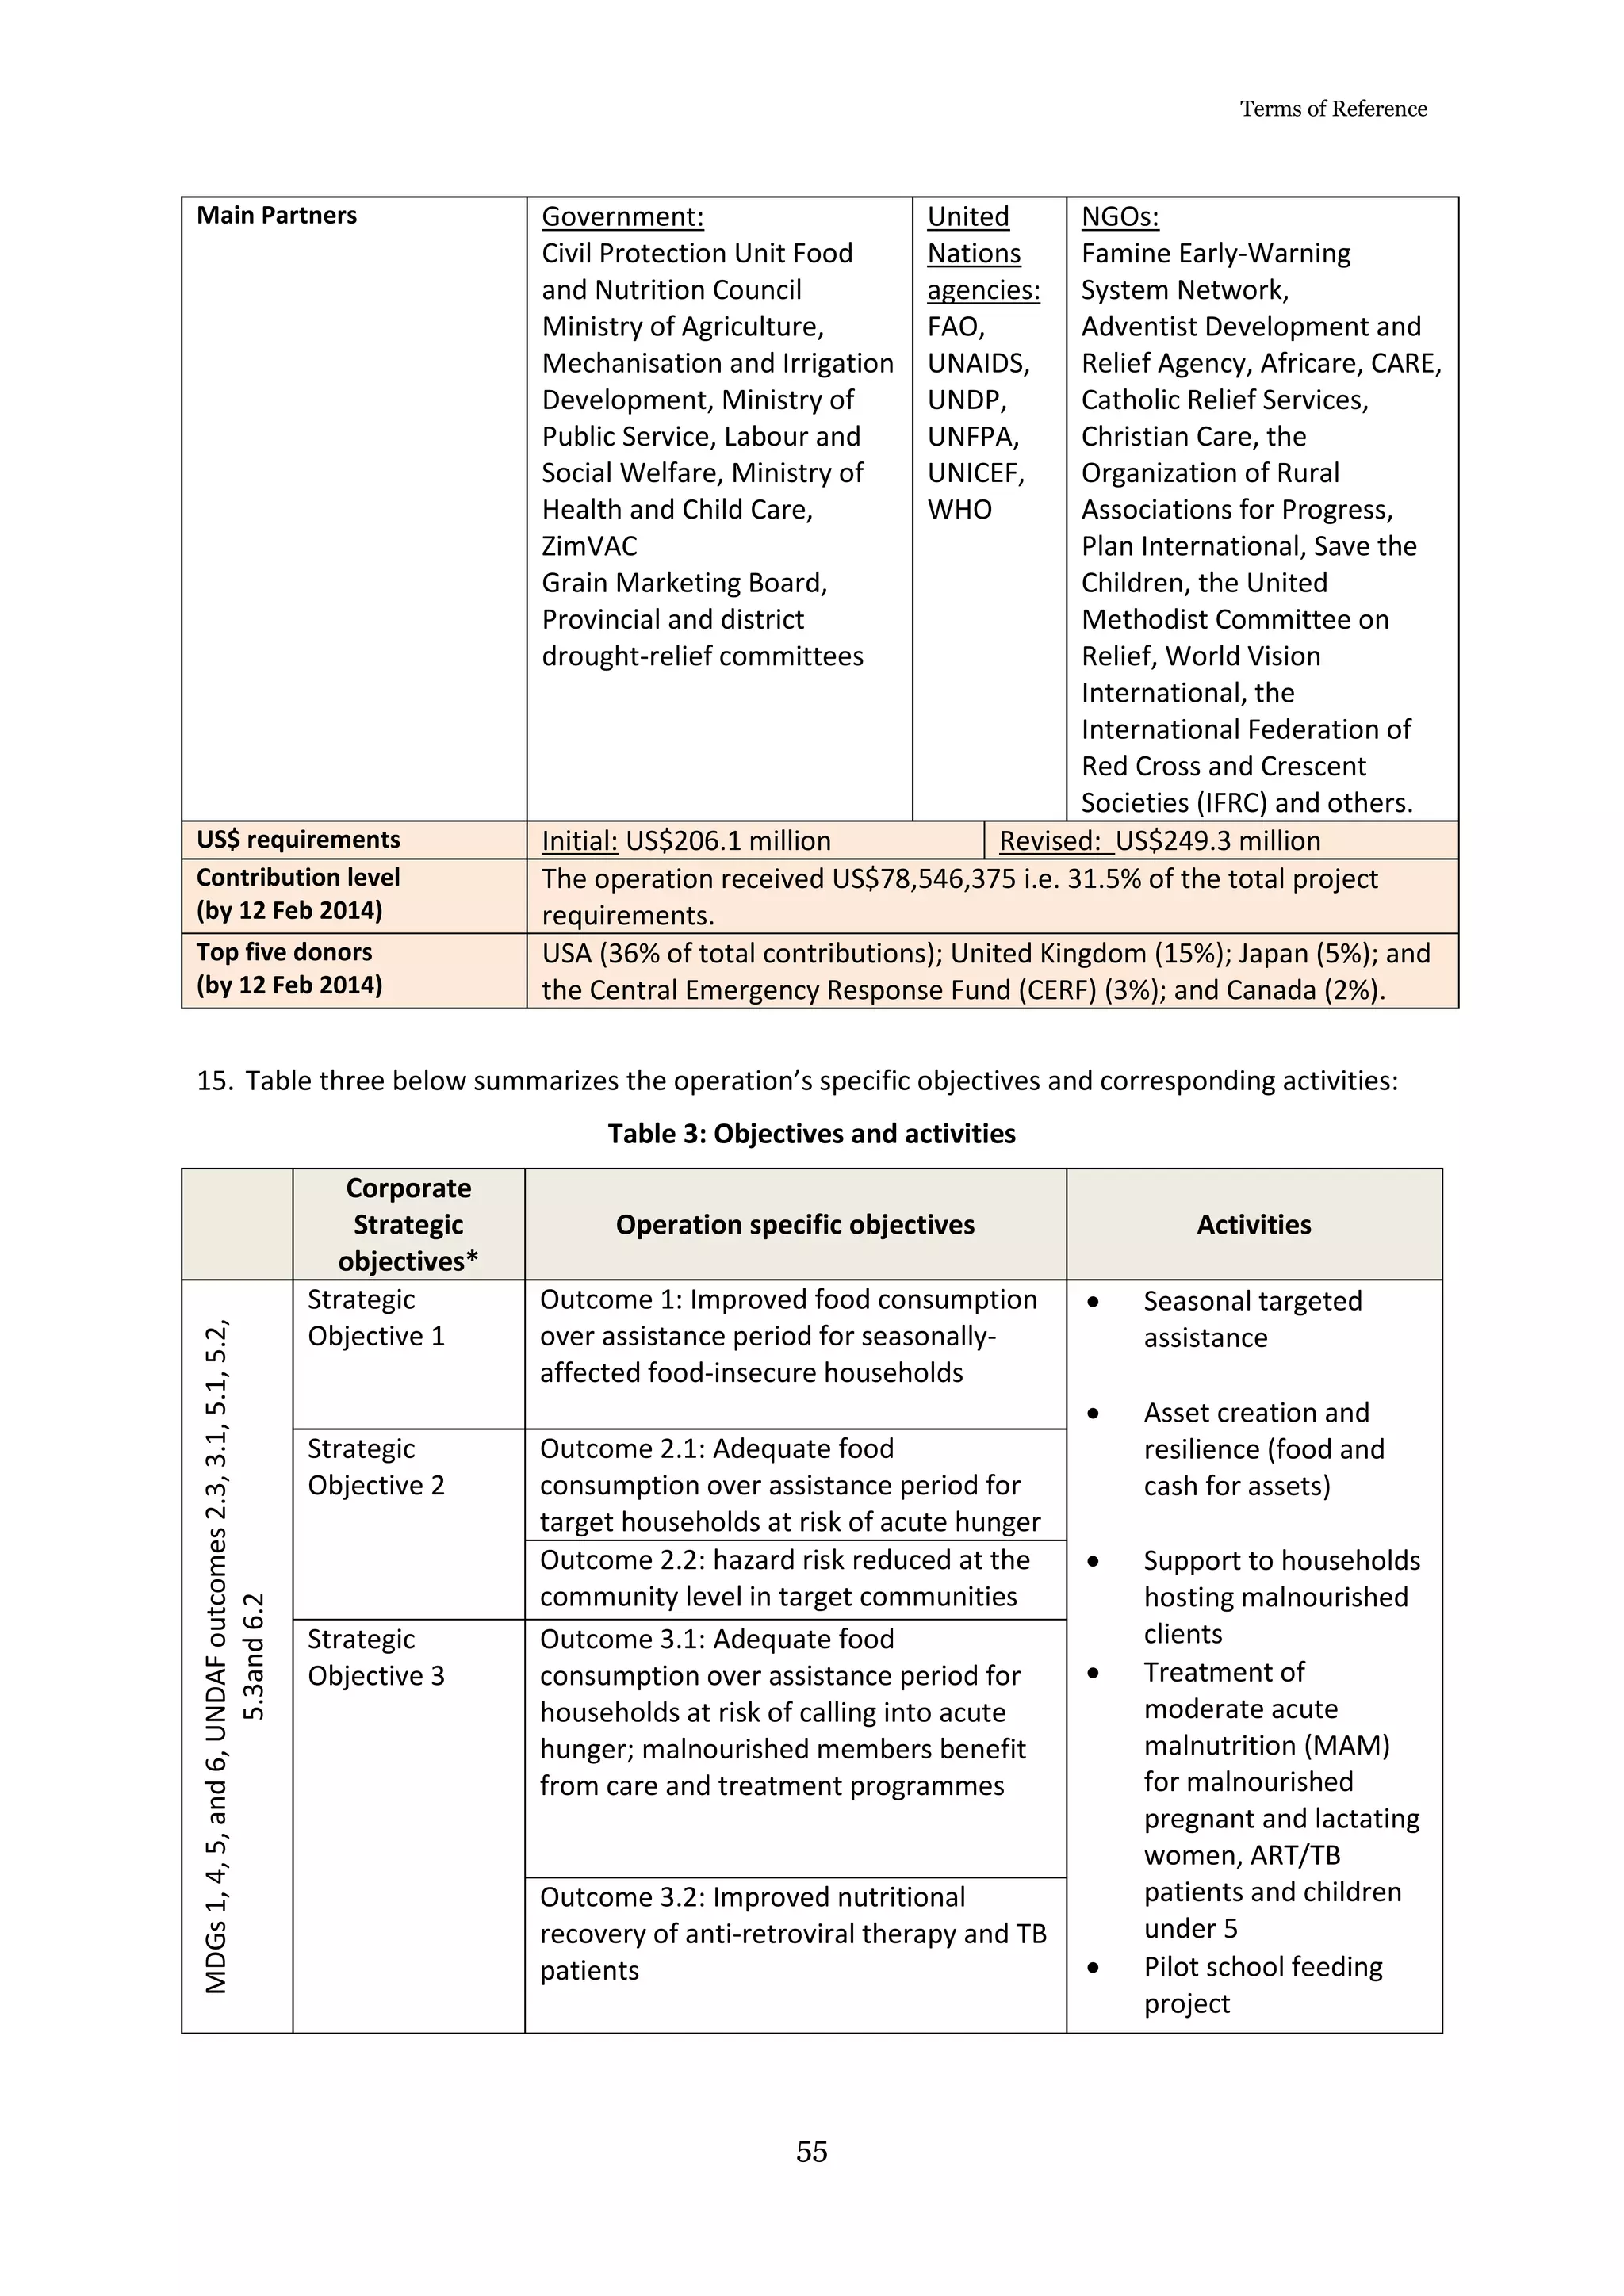
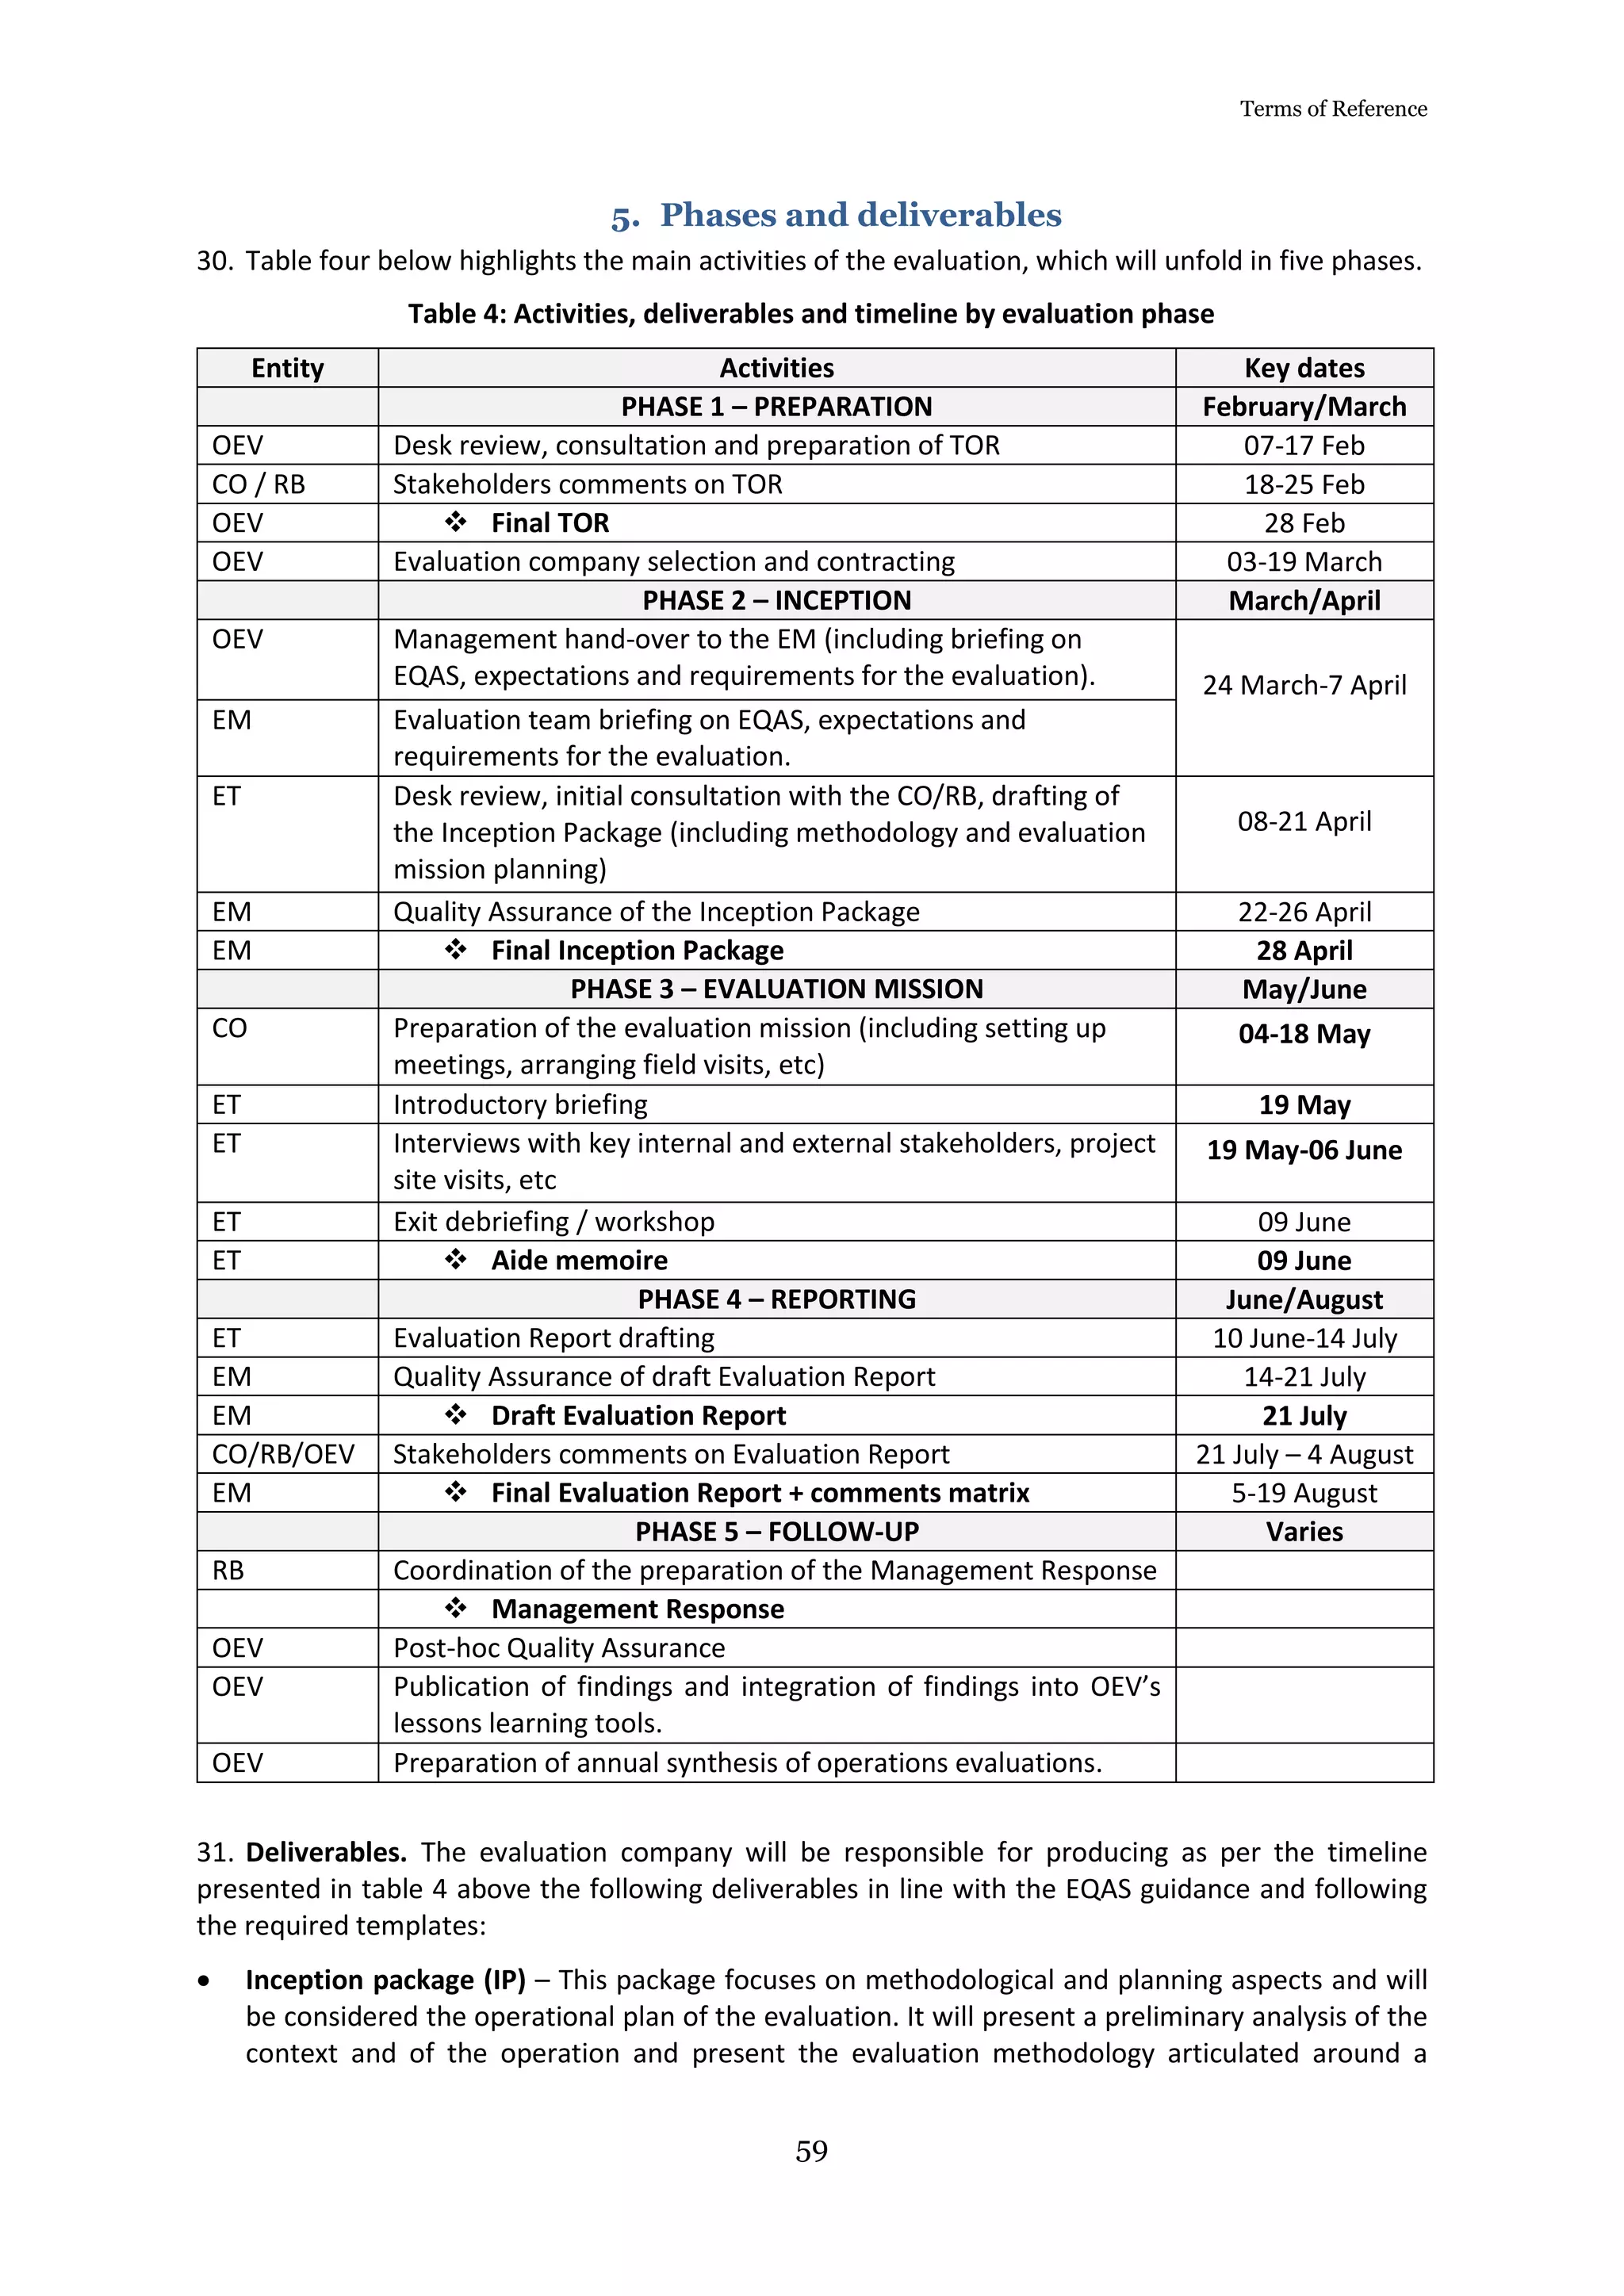
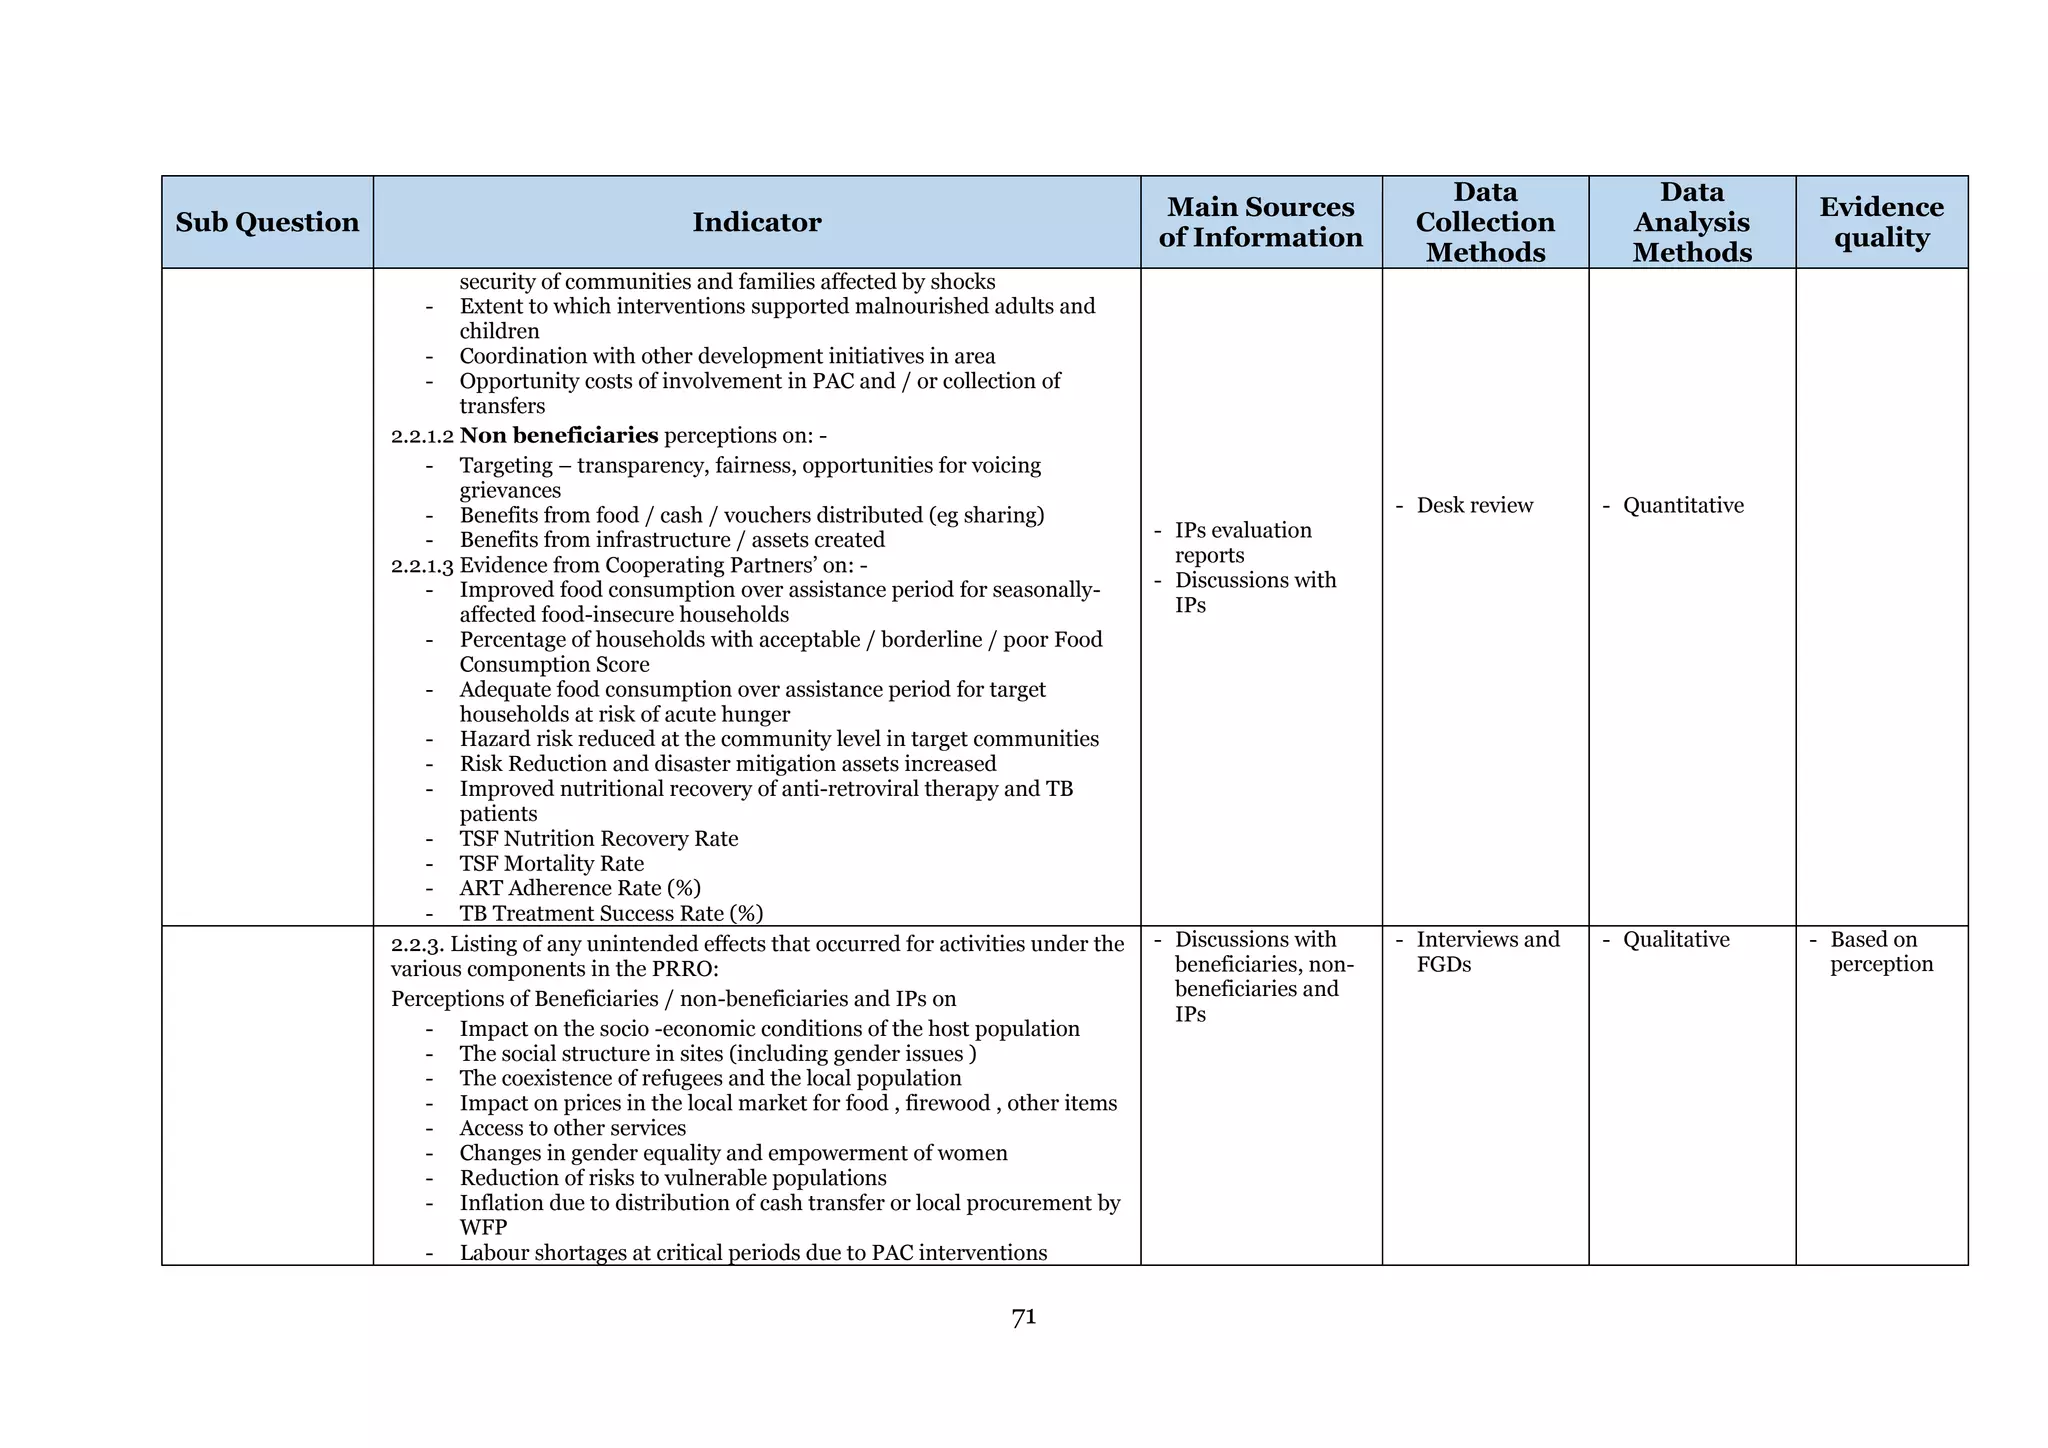
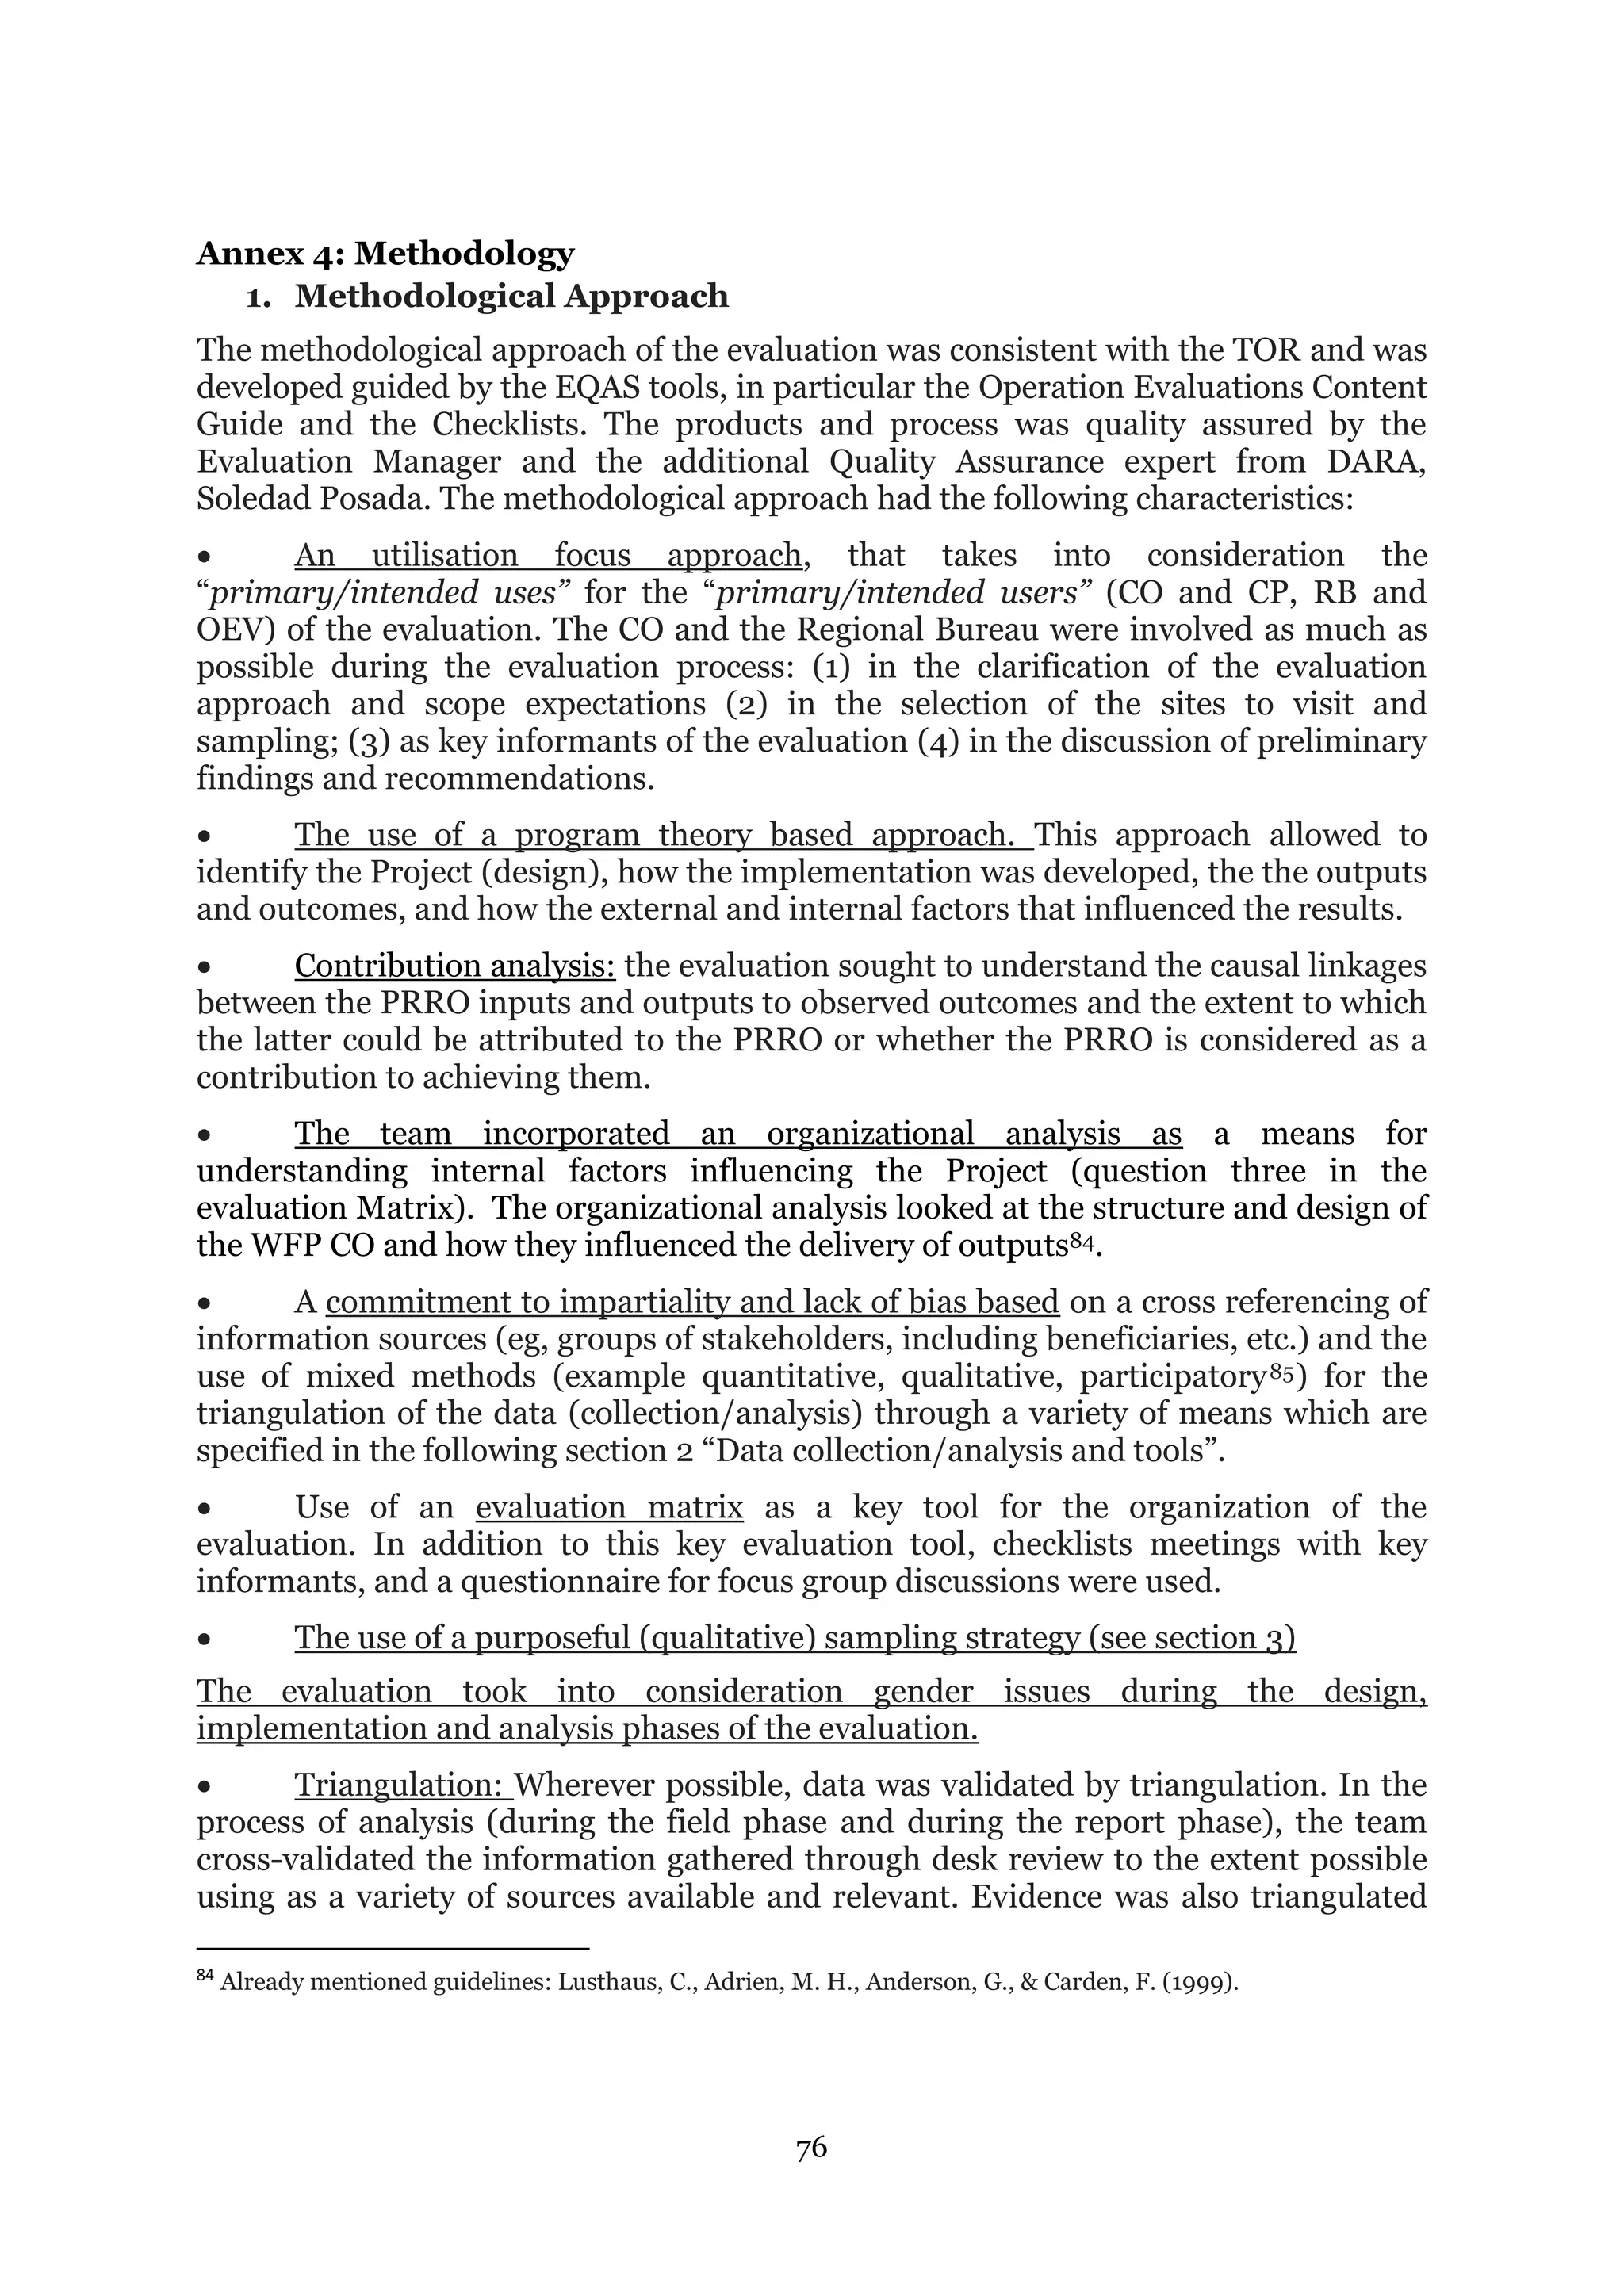
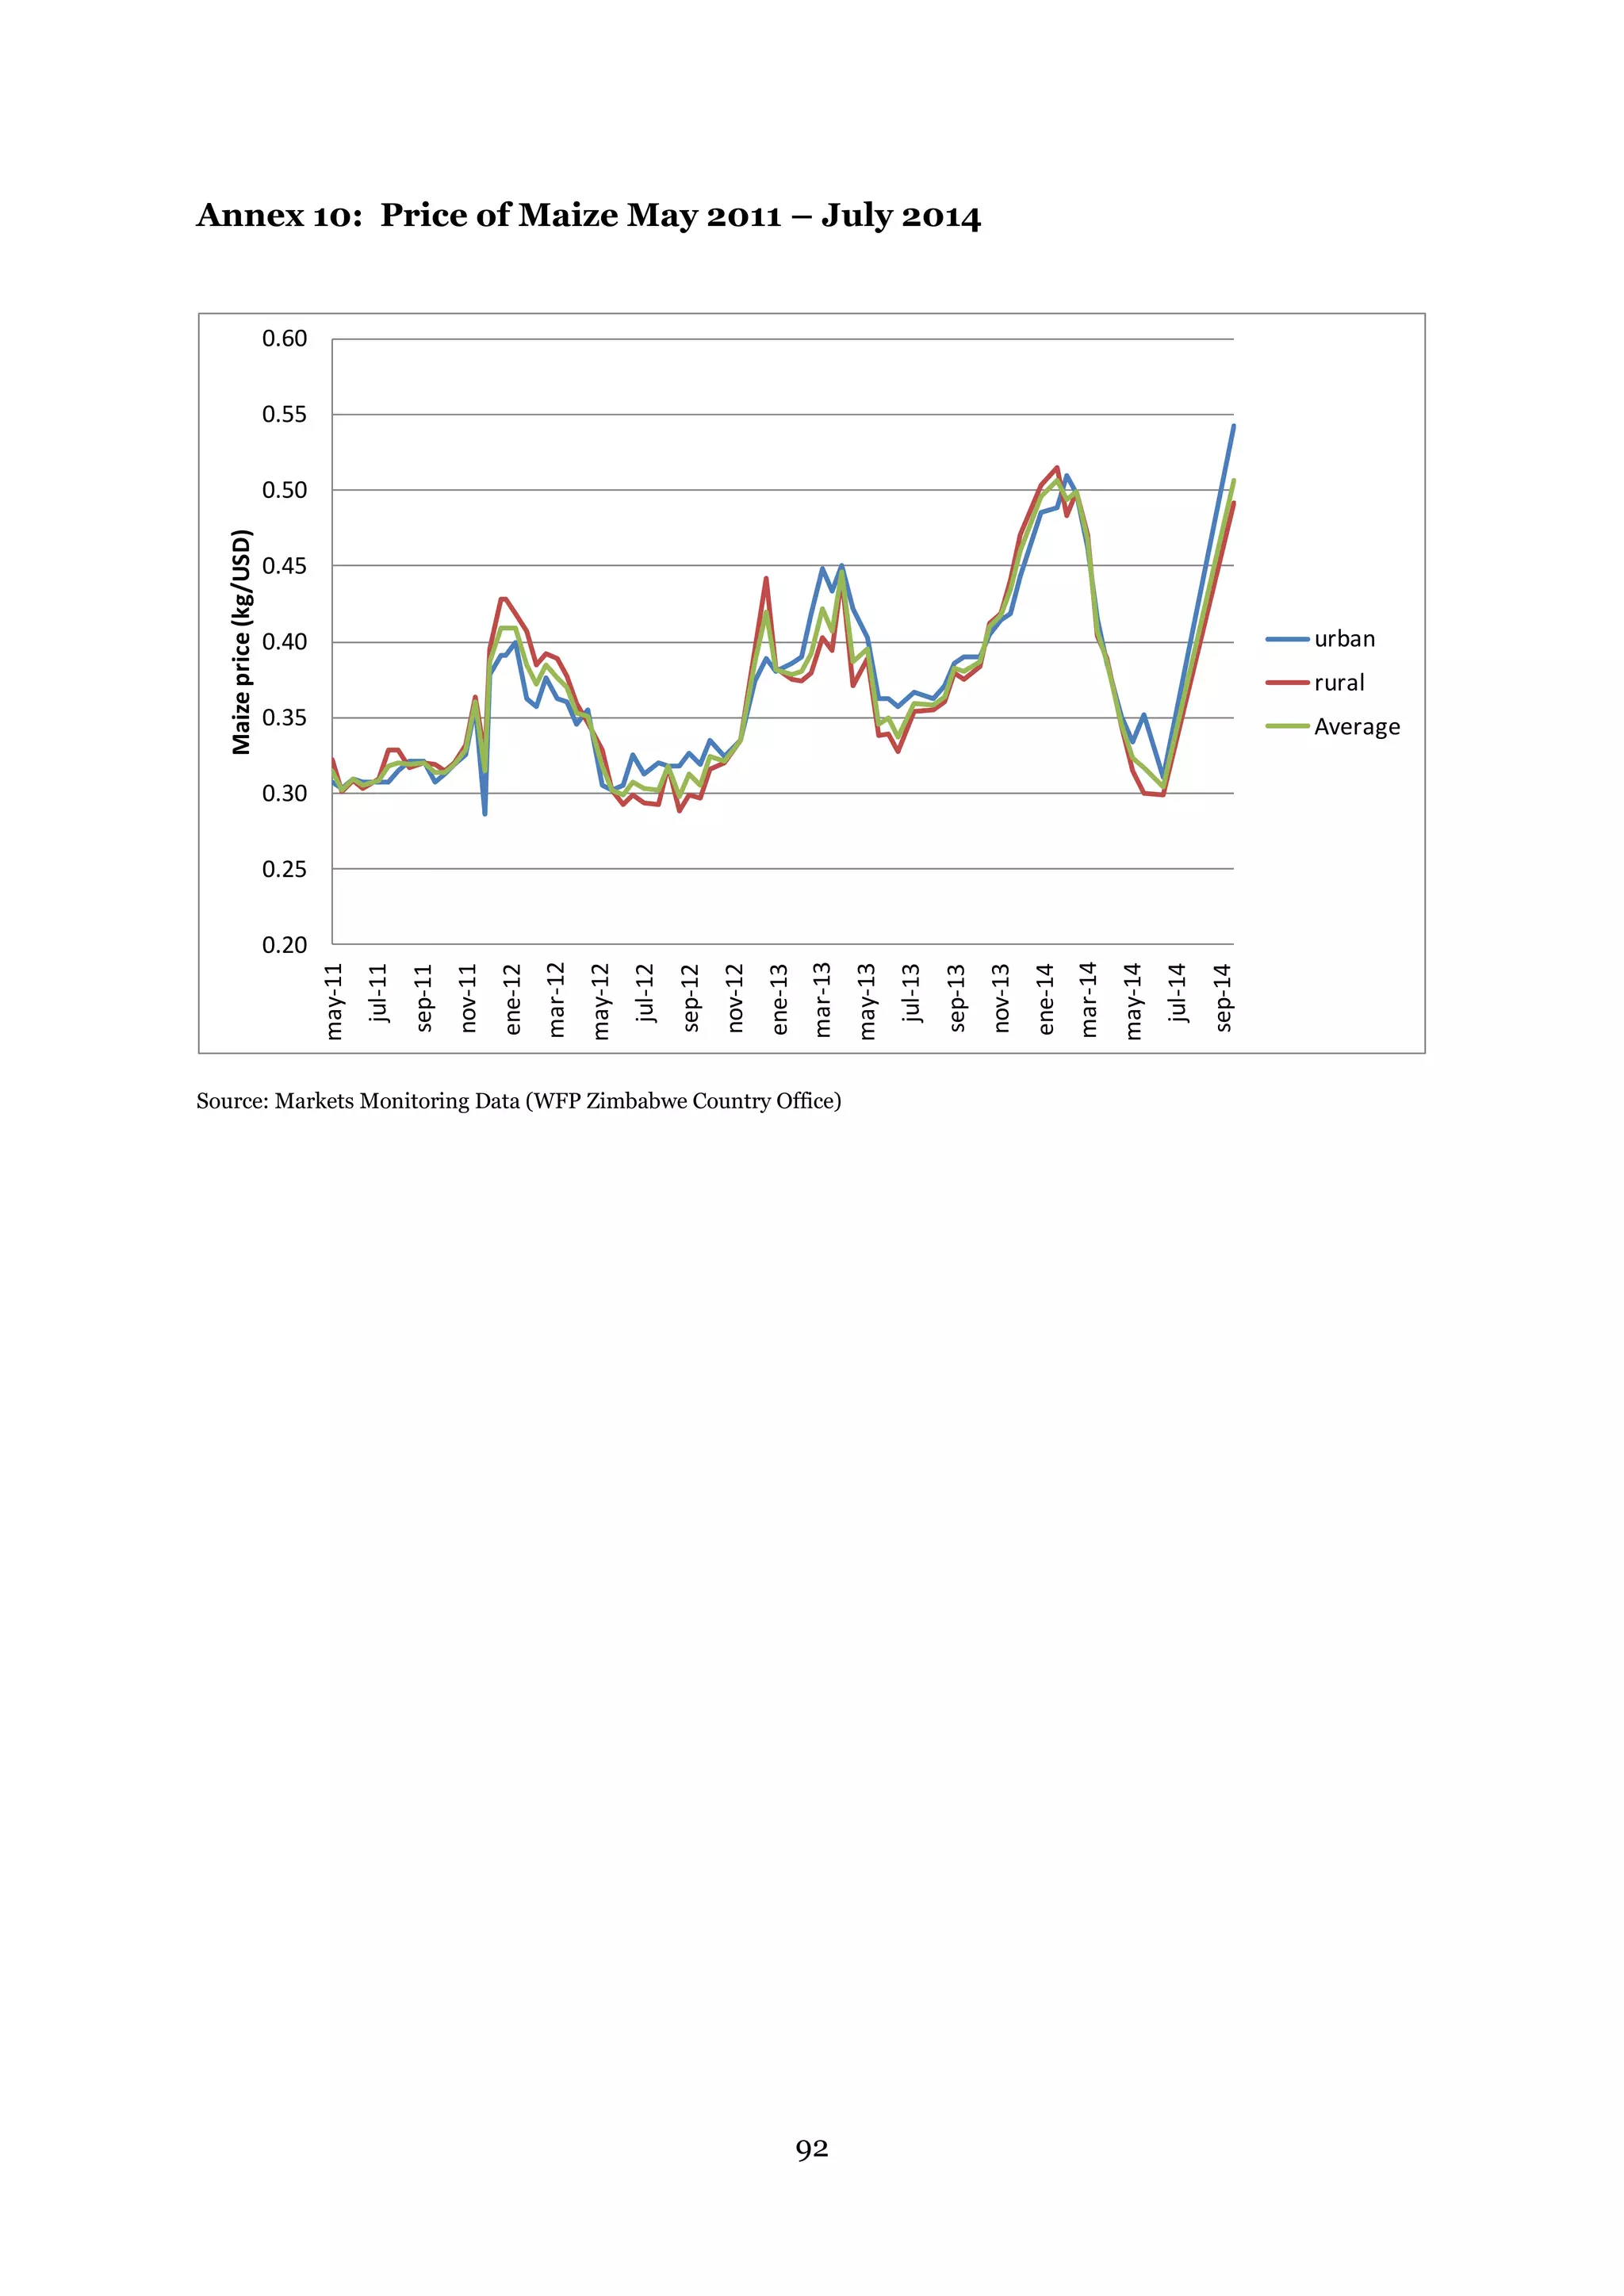
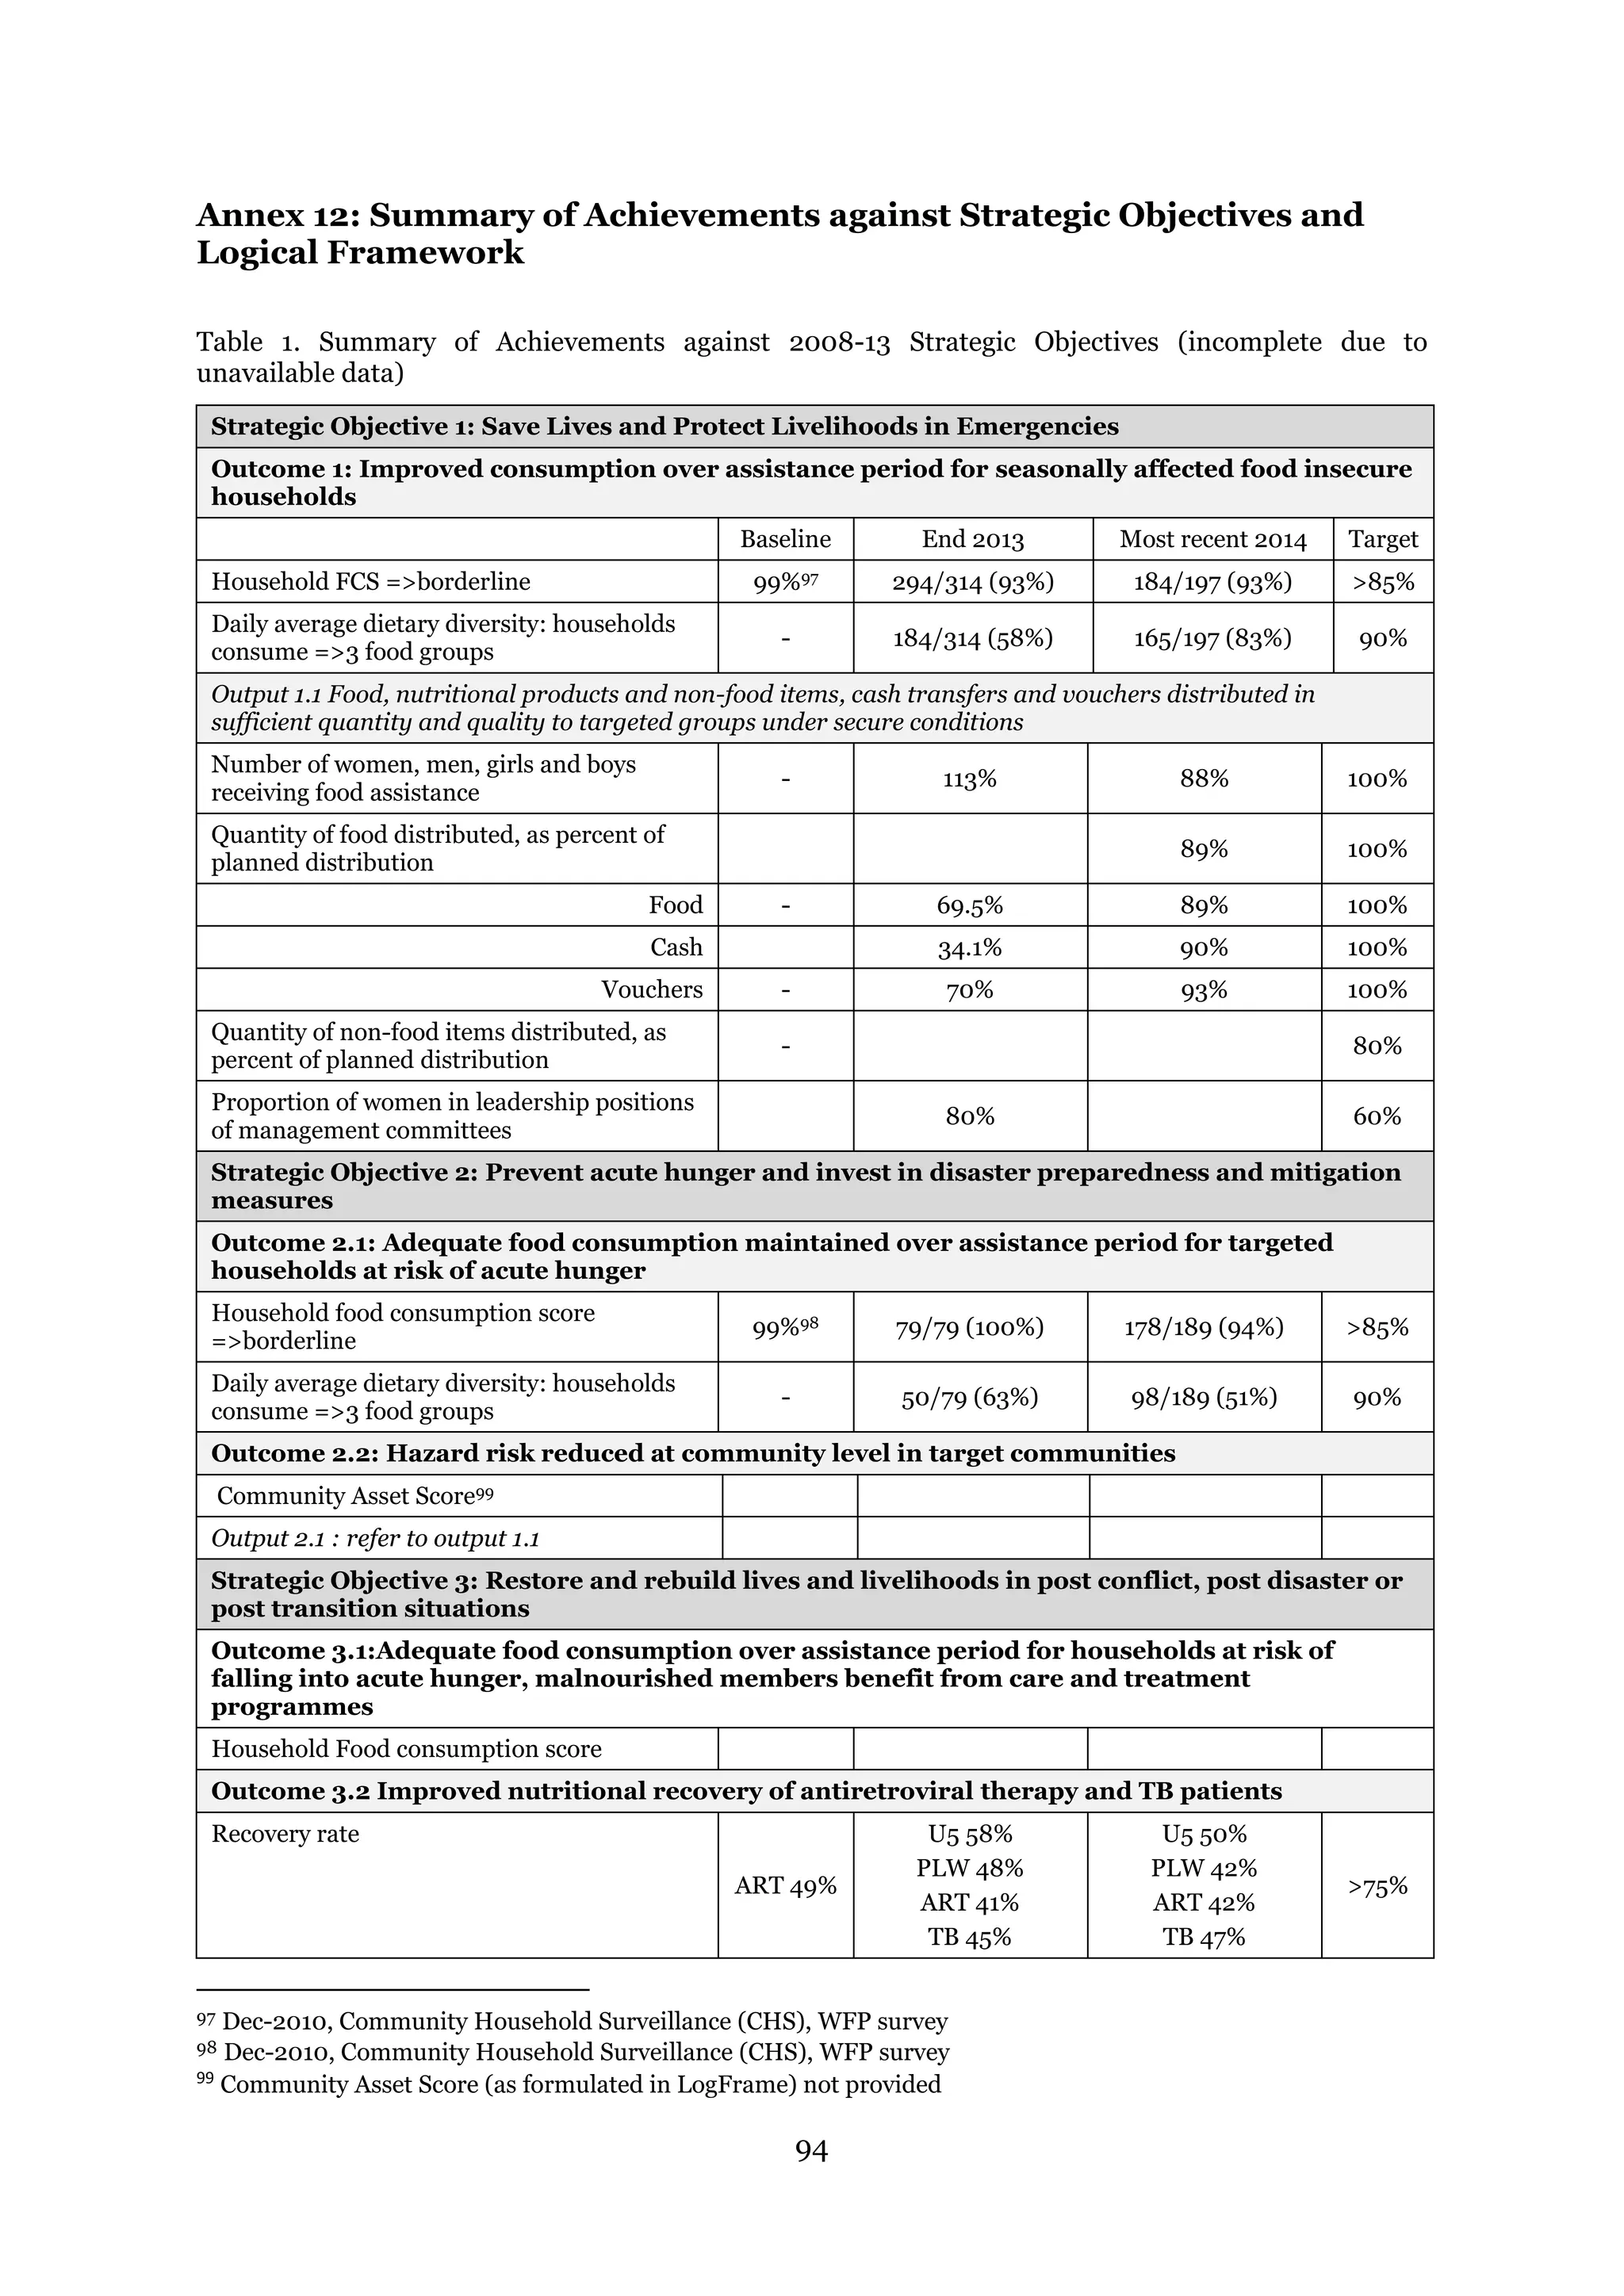
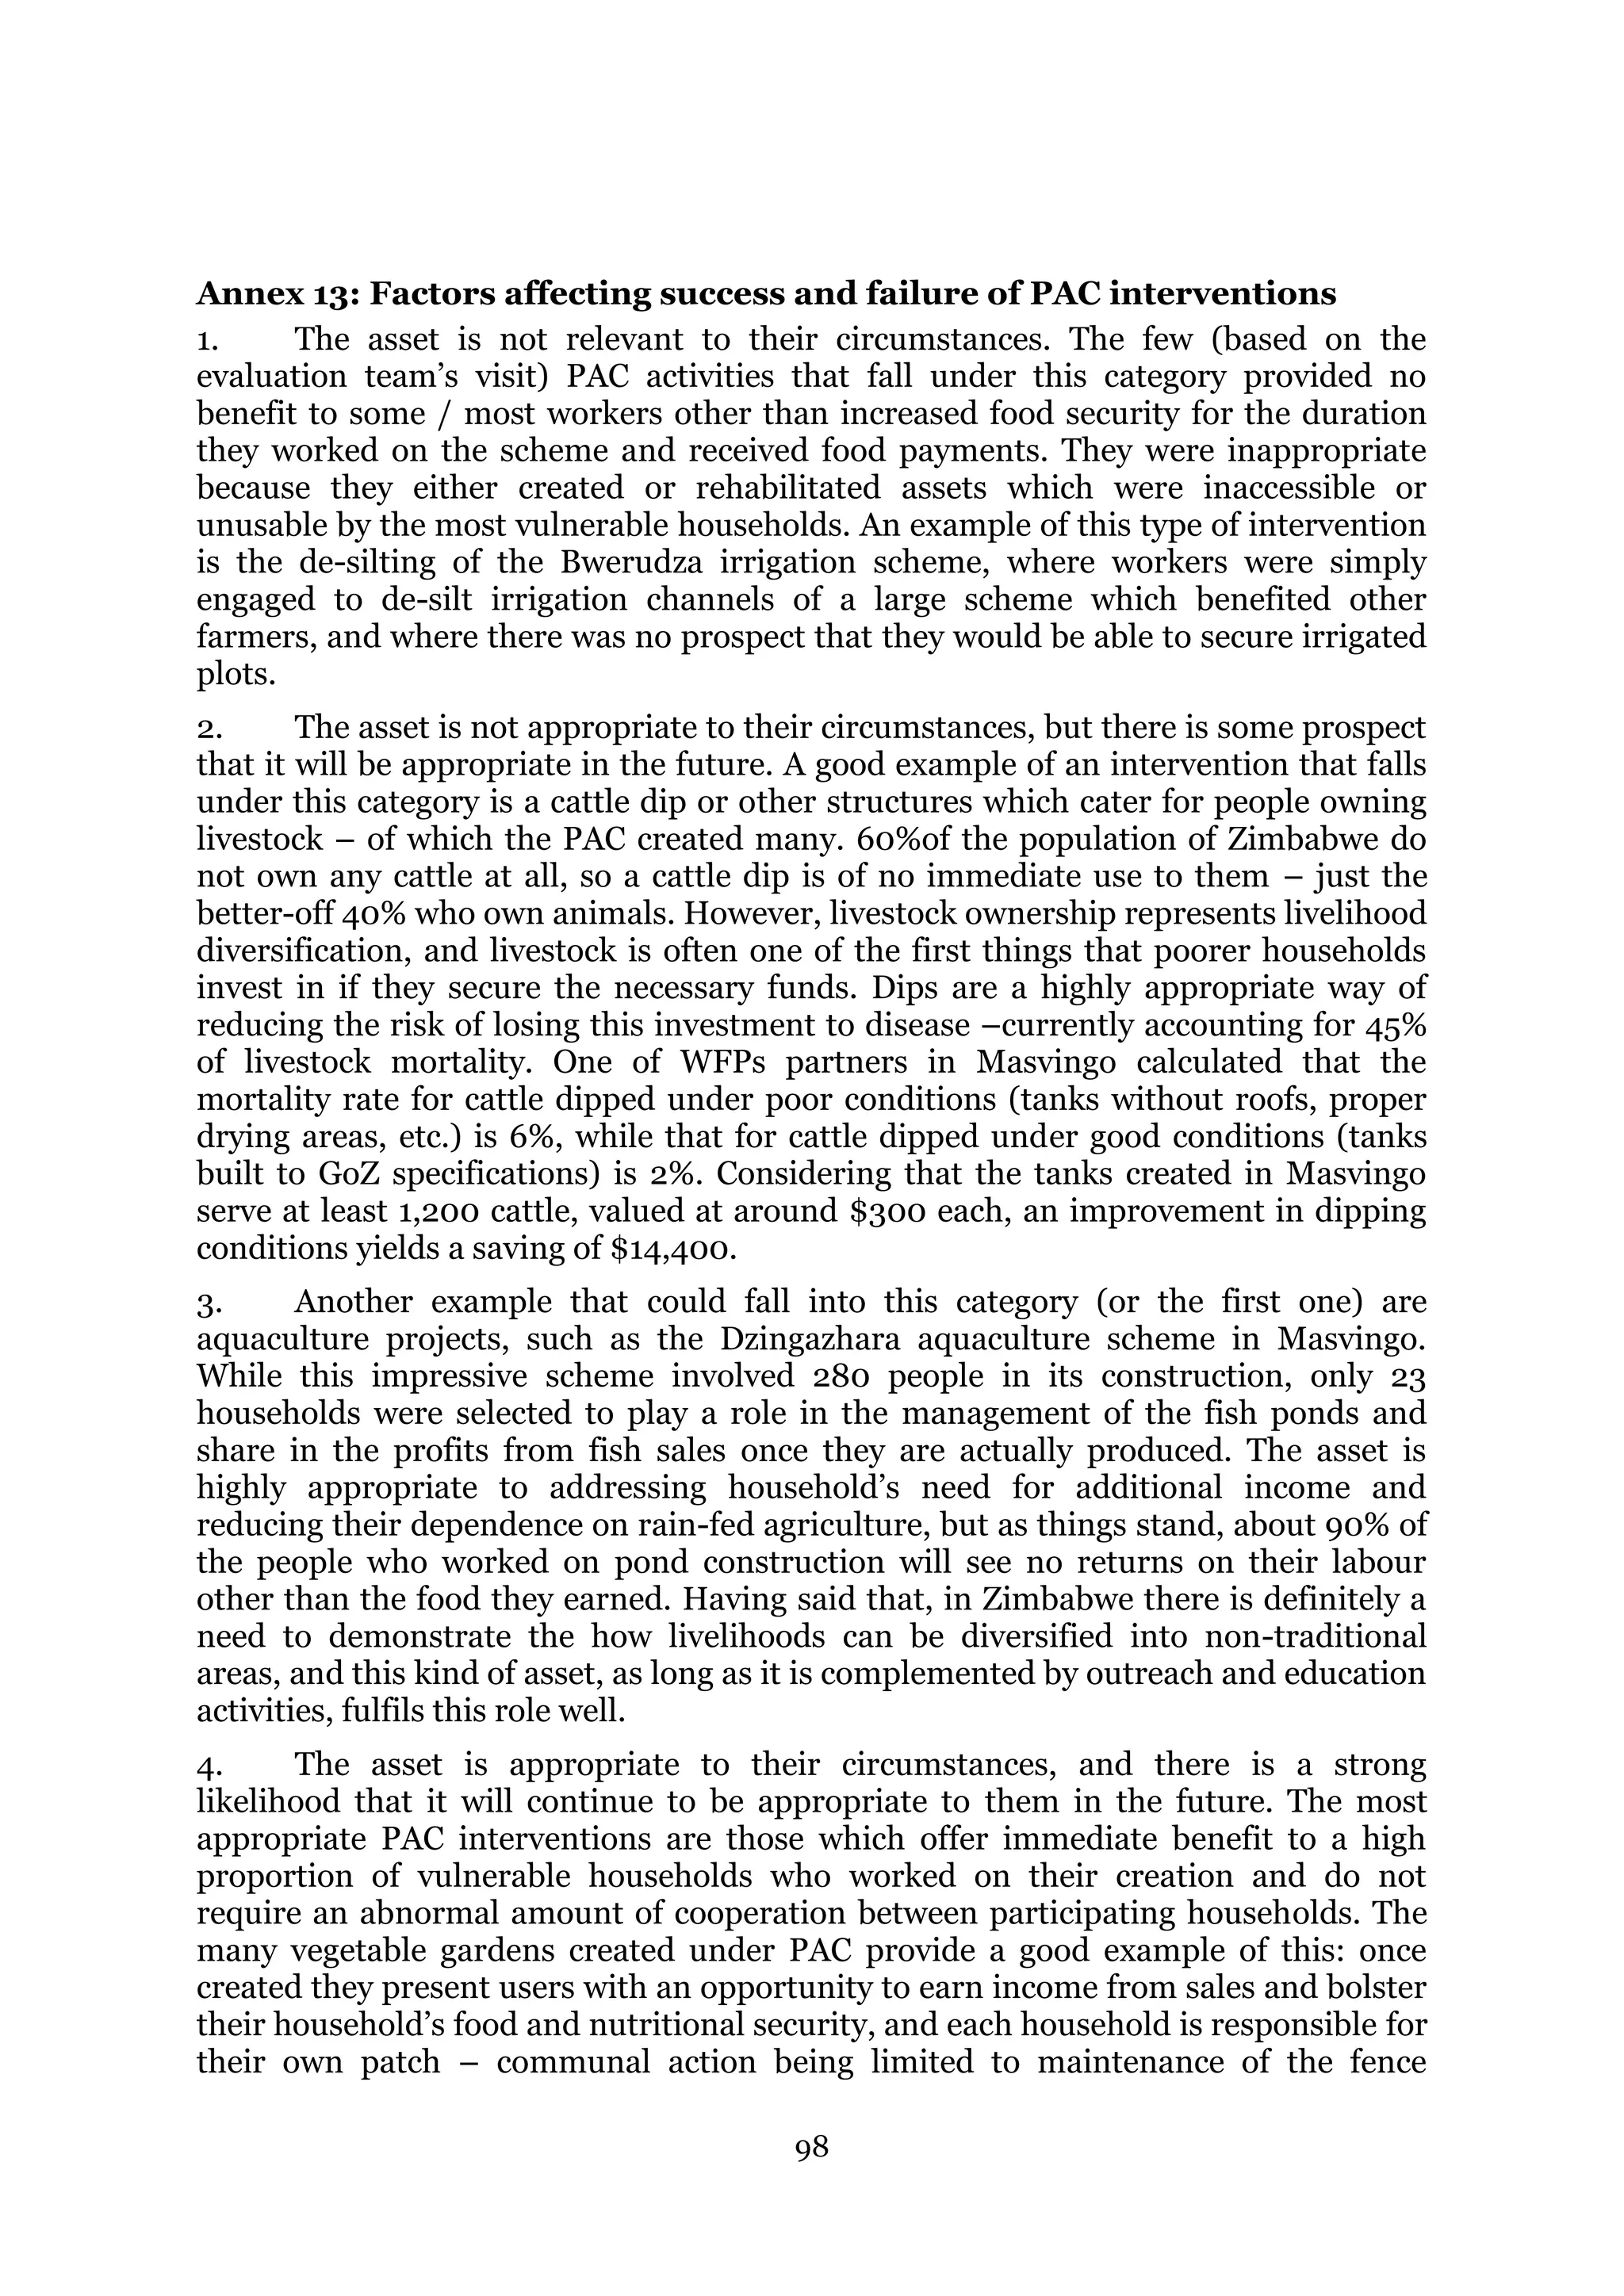
147. In Table 8 below, H&N related outcomes are displayed. Annex 12 shows all of
WFP’s planned and attained outcomes as reflected in the SPR 2013. In the table it
becomes clear, that recovery rates are very low, well below the corporate target of
75% (as reported in SPR 2013). Most of the recovery rates were found below 60%,
dropping even below 30%70. The children under 5 show the best recovery at 58%,
pregnant and lactating women slightly lower at 48% on average); ART and TB
patients perform worst (41% and 45%). The non-response rates are very high for all
four target groups, well above the targeted 15% with rates between 40% and 50%.
Table 8: Planned and attained nutrition related outcomes
70 According to WFP sub-office M&E data, under-5 recovery rate Bulawayo October 2013 27%; Masvingo December 2013 28%](https://image.slidesharecdn.com/bf1fb9fa-b81e-453e-8f3d-187e133a2a27-170124040005/75/wfp268240-48-2048.jpg)
![37
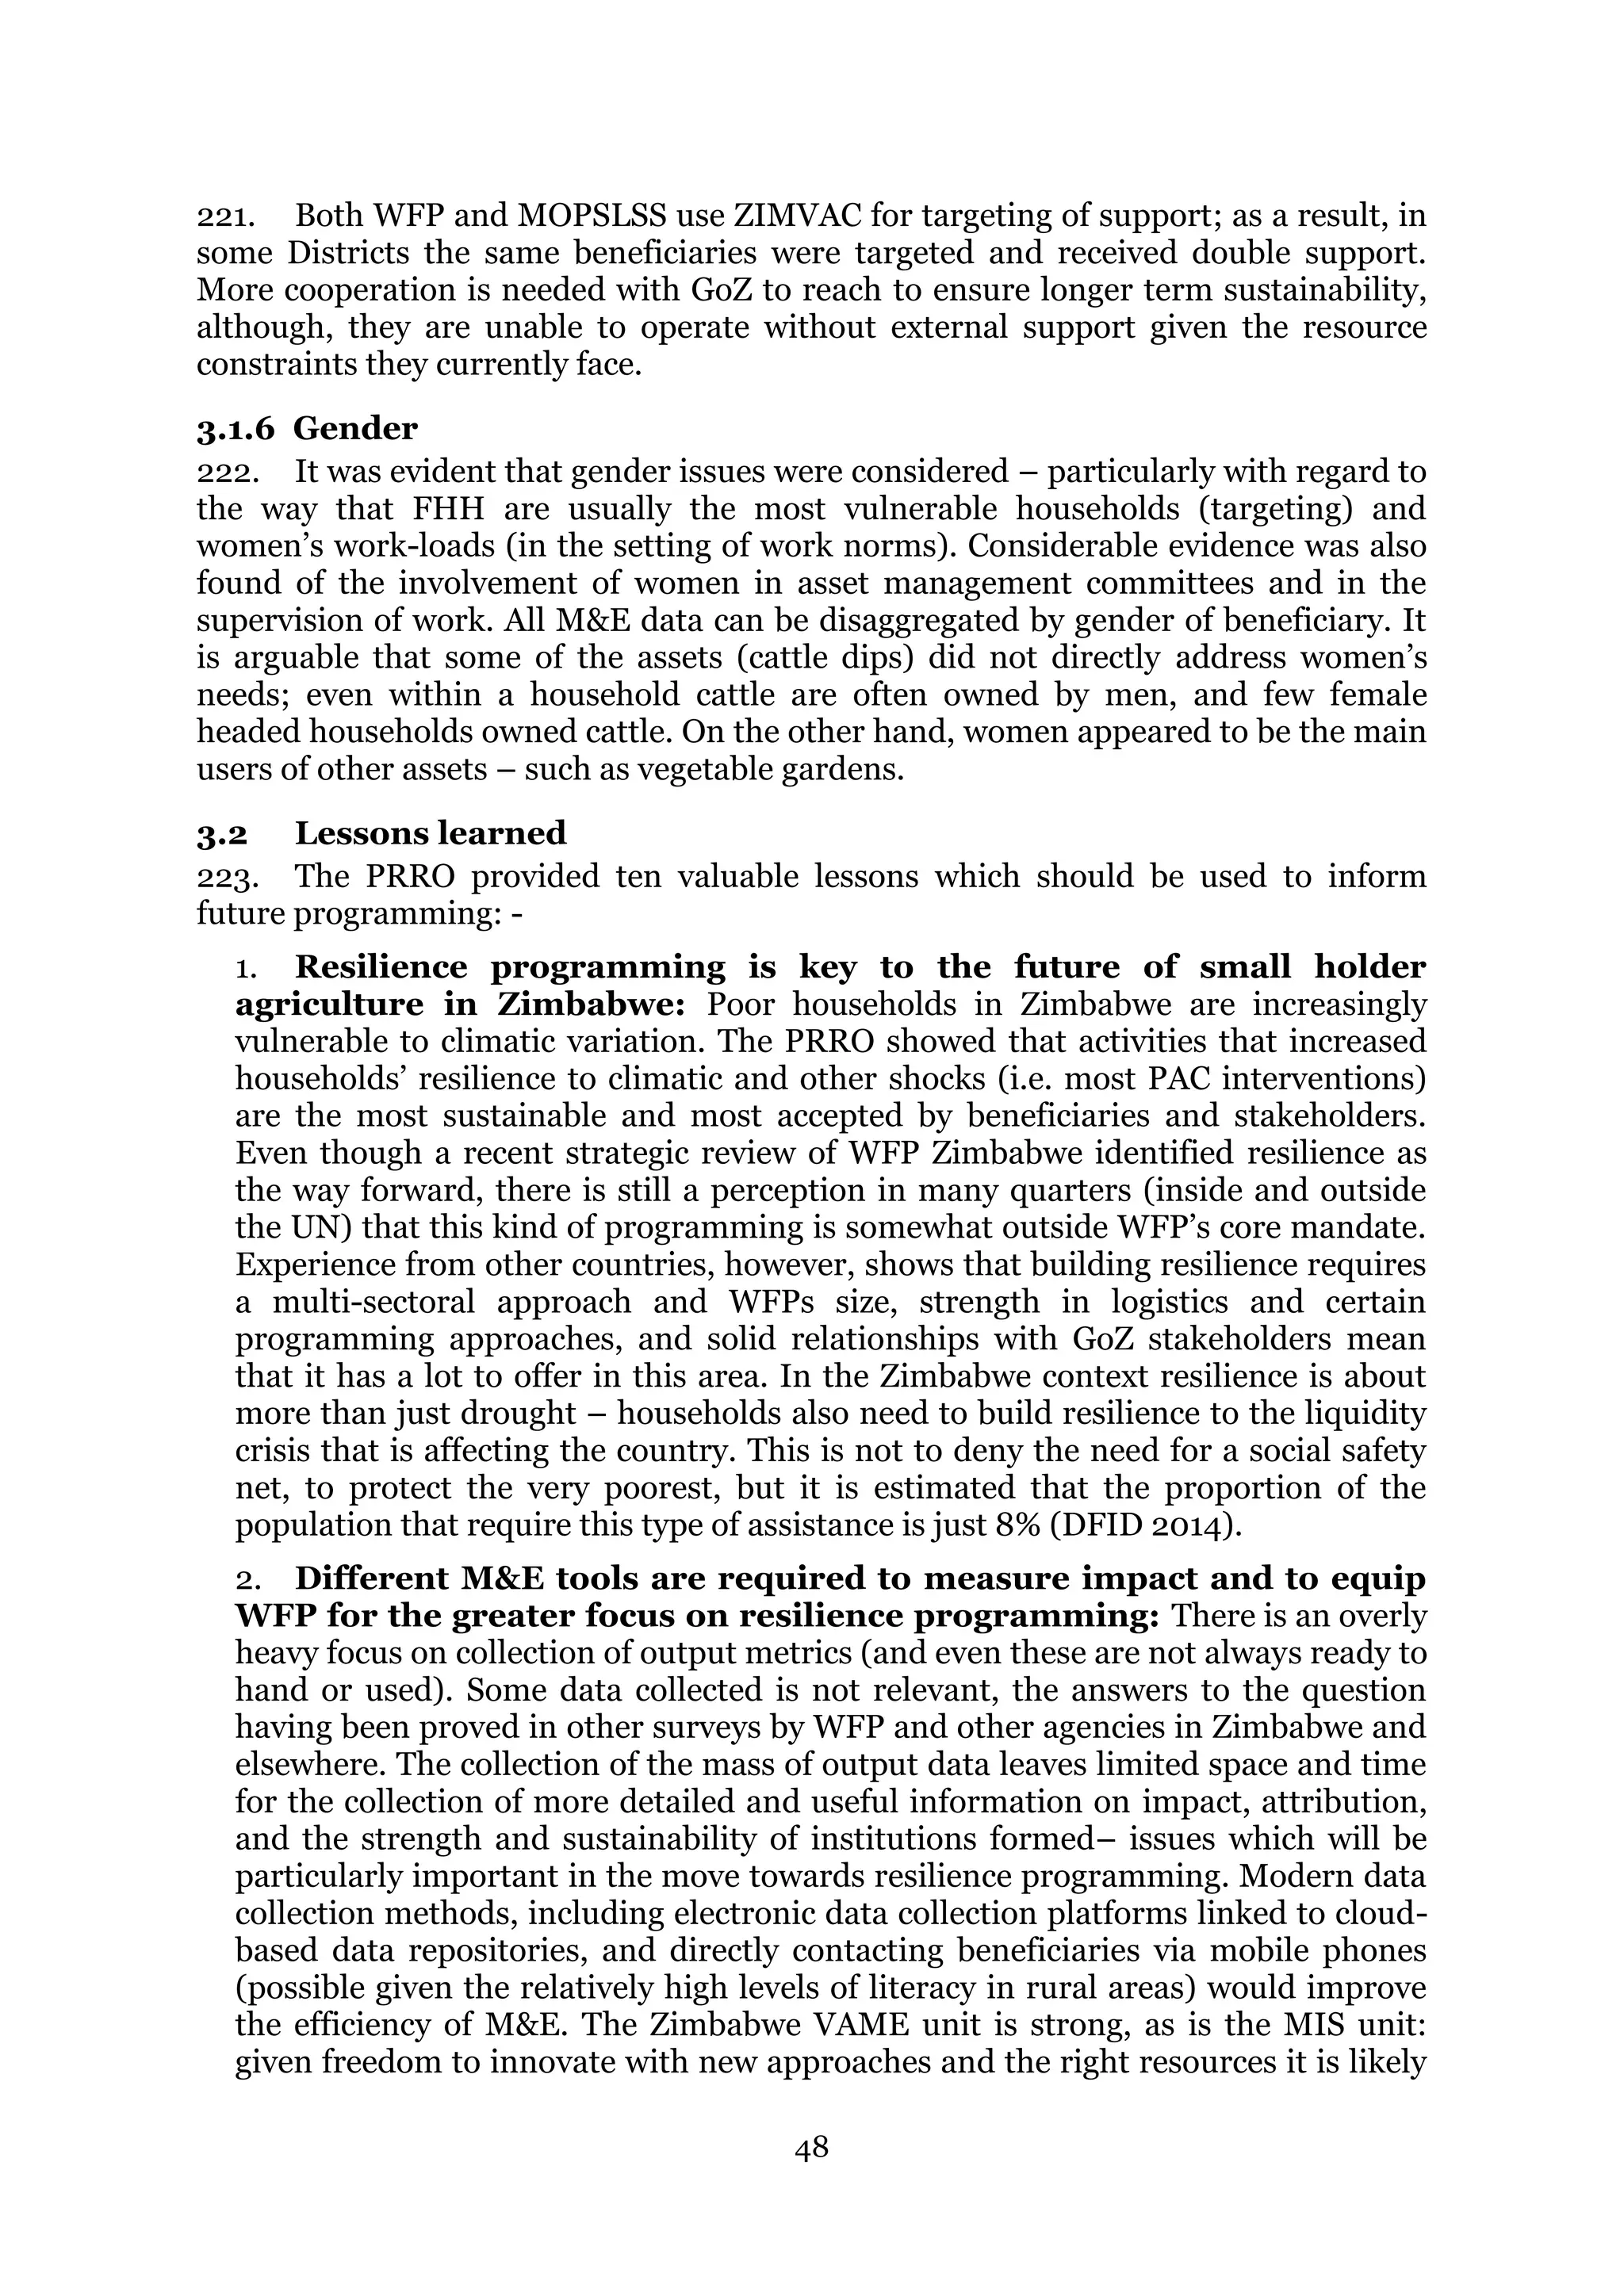
beneficiary circumstances, but may be in the future (e.g. cattle dips [only 40% of the
population own any cattle]); and those that are immediately relevant and
appropriate to beneficiaries’ needs (vegetable gardens, for example). Most of the
interventions fell into the latter two categories. Sustainability of the asset will depend
on a number of factors including: group cohesion, clear membership and use rules,
no requirement for a high level of communal action, effective asset management
structures, consideration of the difficult economic environment, good cooperating
partners and handover of a fully functioning asset.
STA distributed 31,774MT of food (43% of the programme target). 1,407,917
beneficiaries were assisted with food and cash. Funding constraints meant that only
$3.4m (38%) of a planned $8.8m in cash transfers to enable households to buy the
grain component of their transfer was distributed under the CFC system. While
beneficiaries were grateful for the food they received, it was in too small a quantity,
and for too short duration to make a quantifiable difference to household food
security. In many cases households resorted to traditional coping mechanisms such
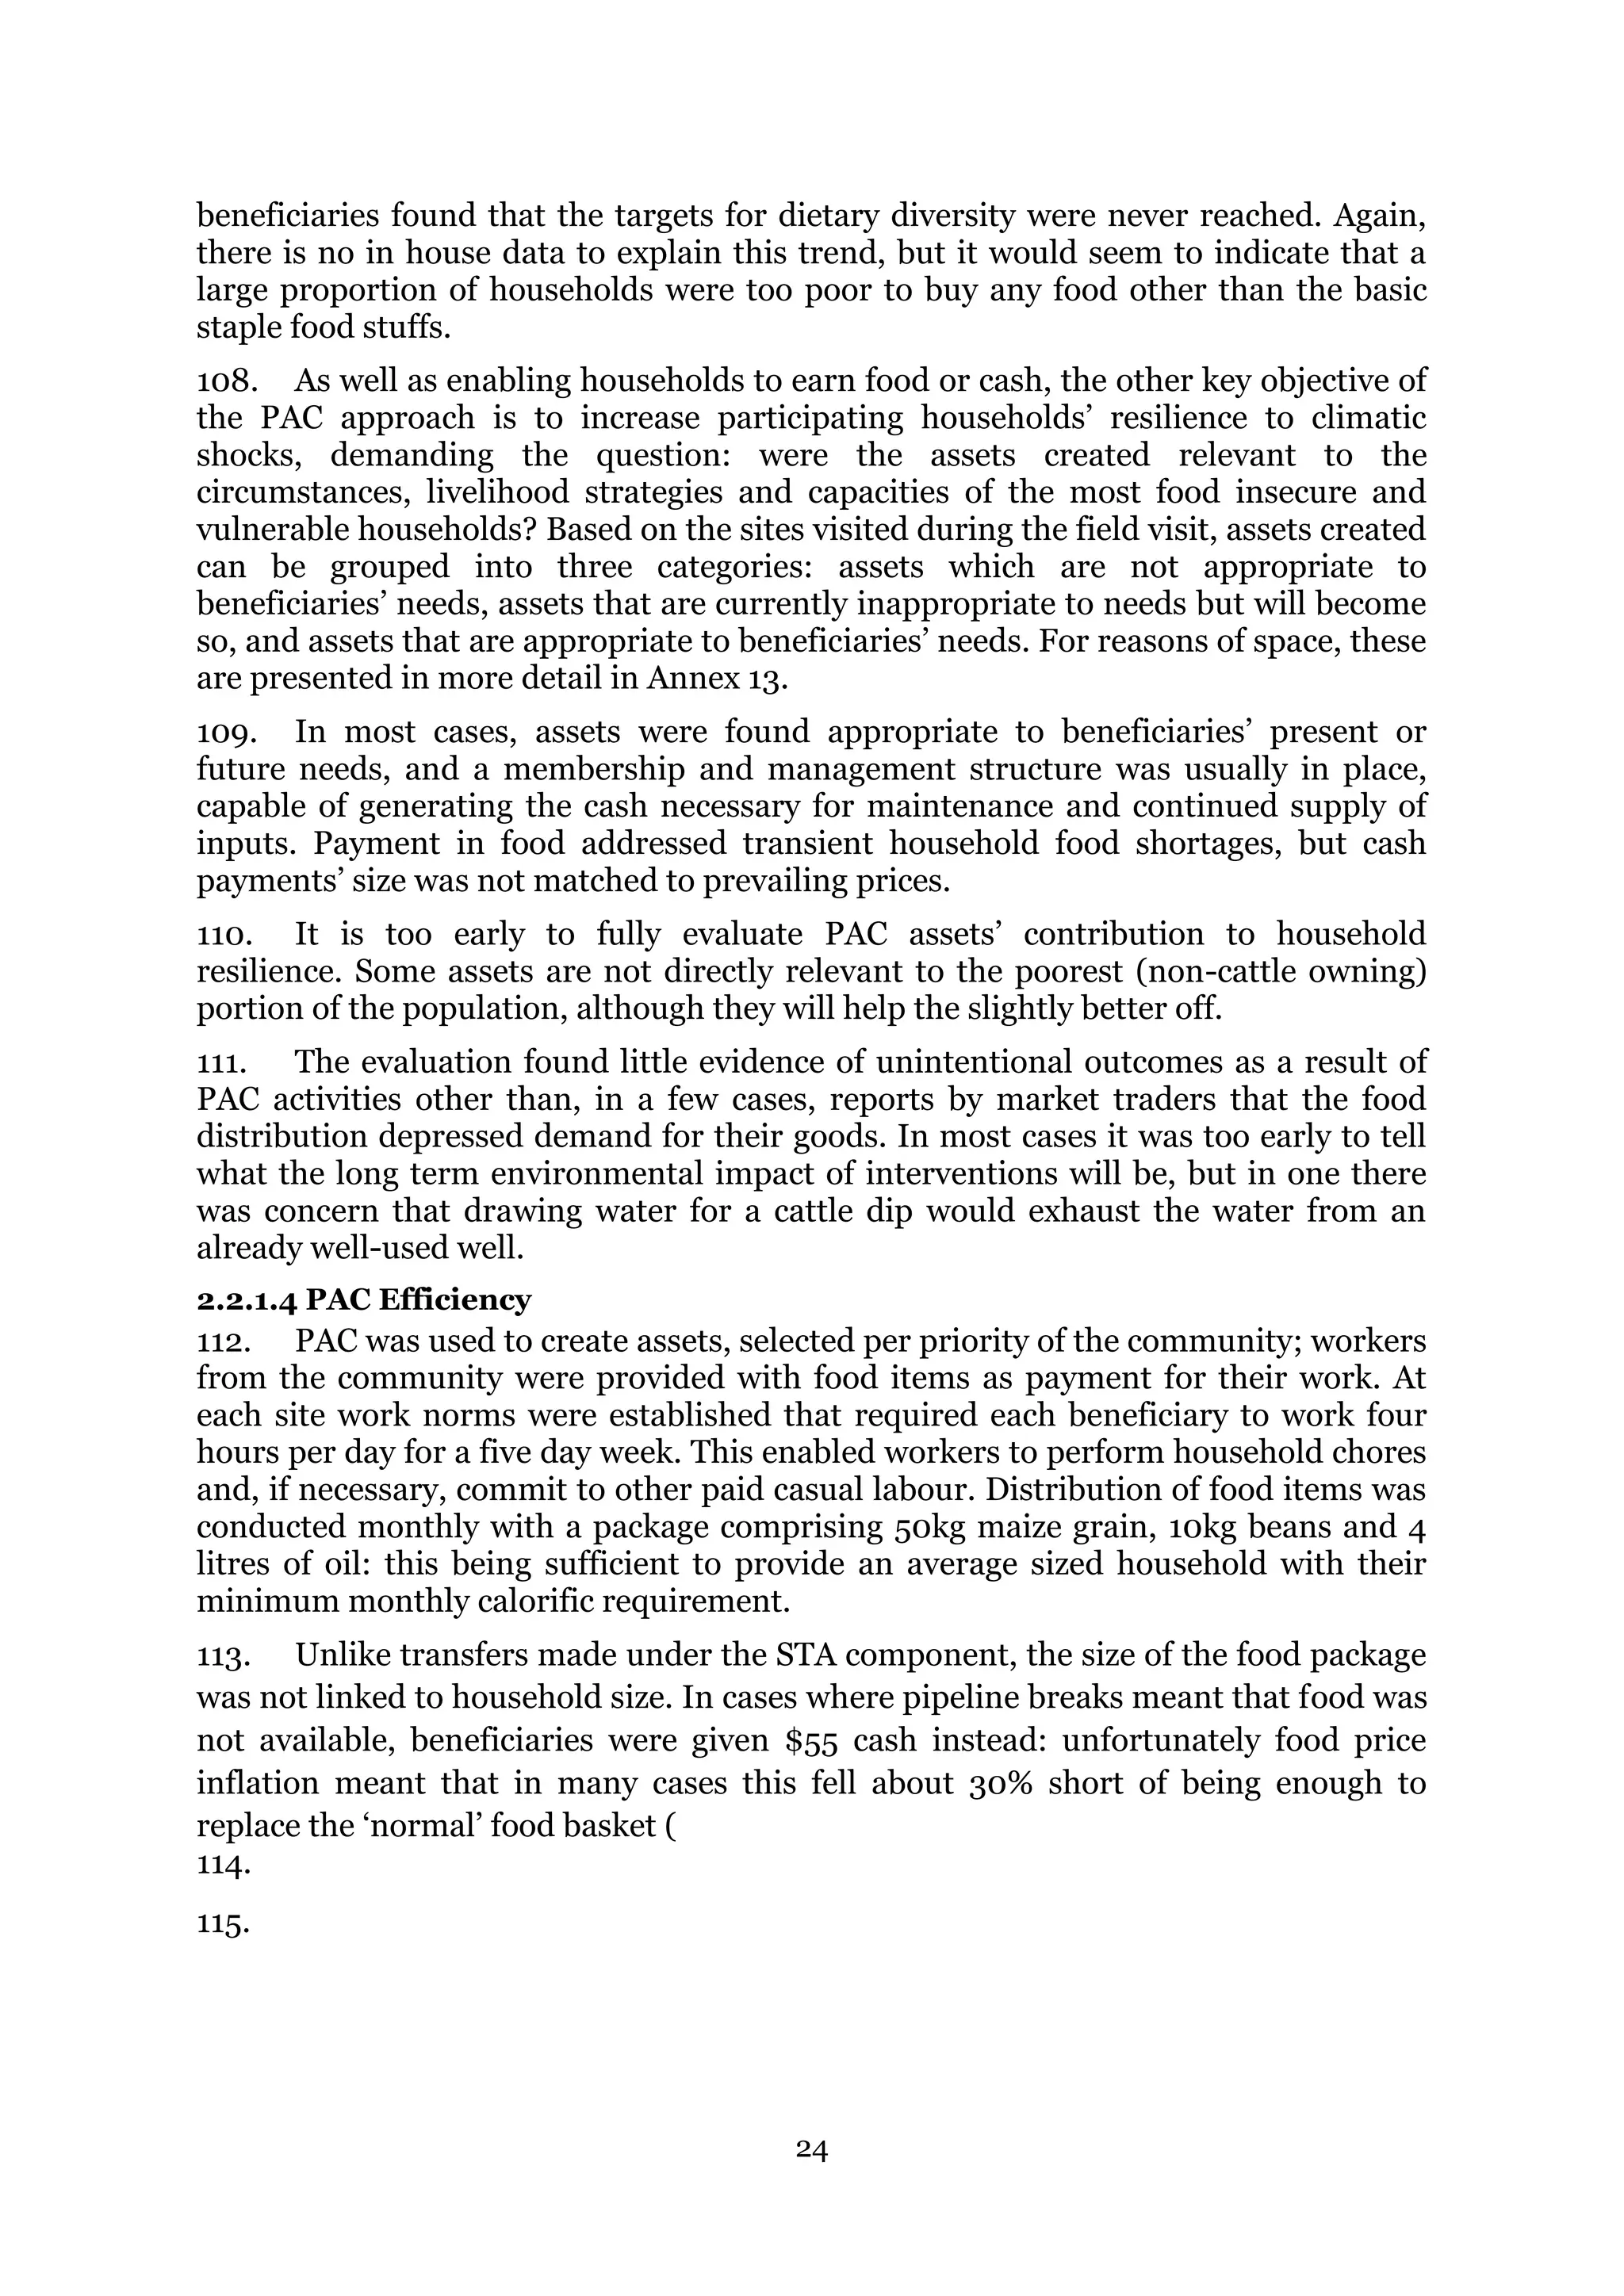
as piece work and eating wild foods to get them through the lean season. The fact
that a high number of STA beneficiaries reported engaging in casual labour as a
coping strategy is a strong signal that they could have been included in cash / food
for work schemes.
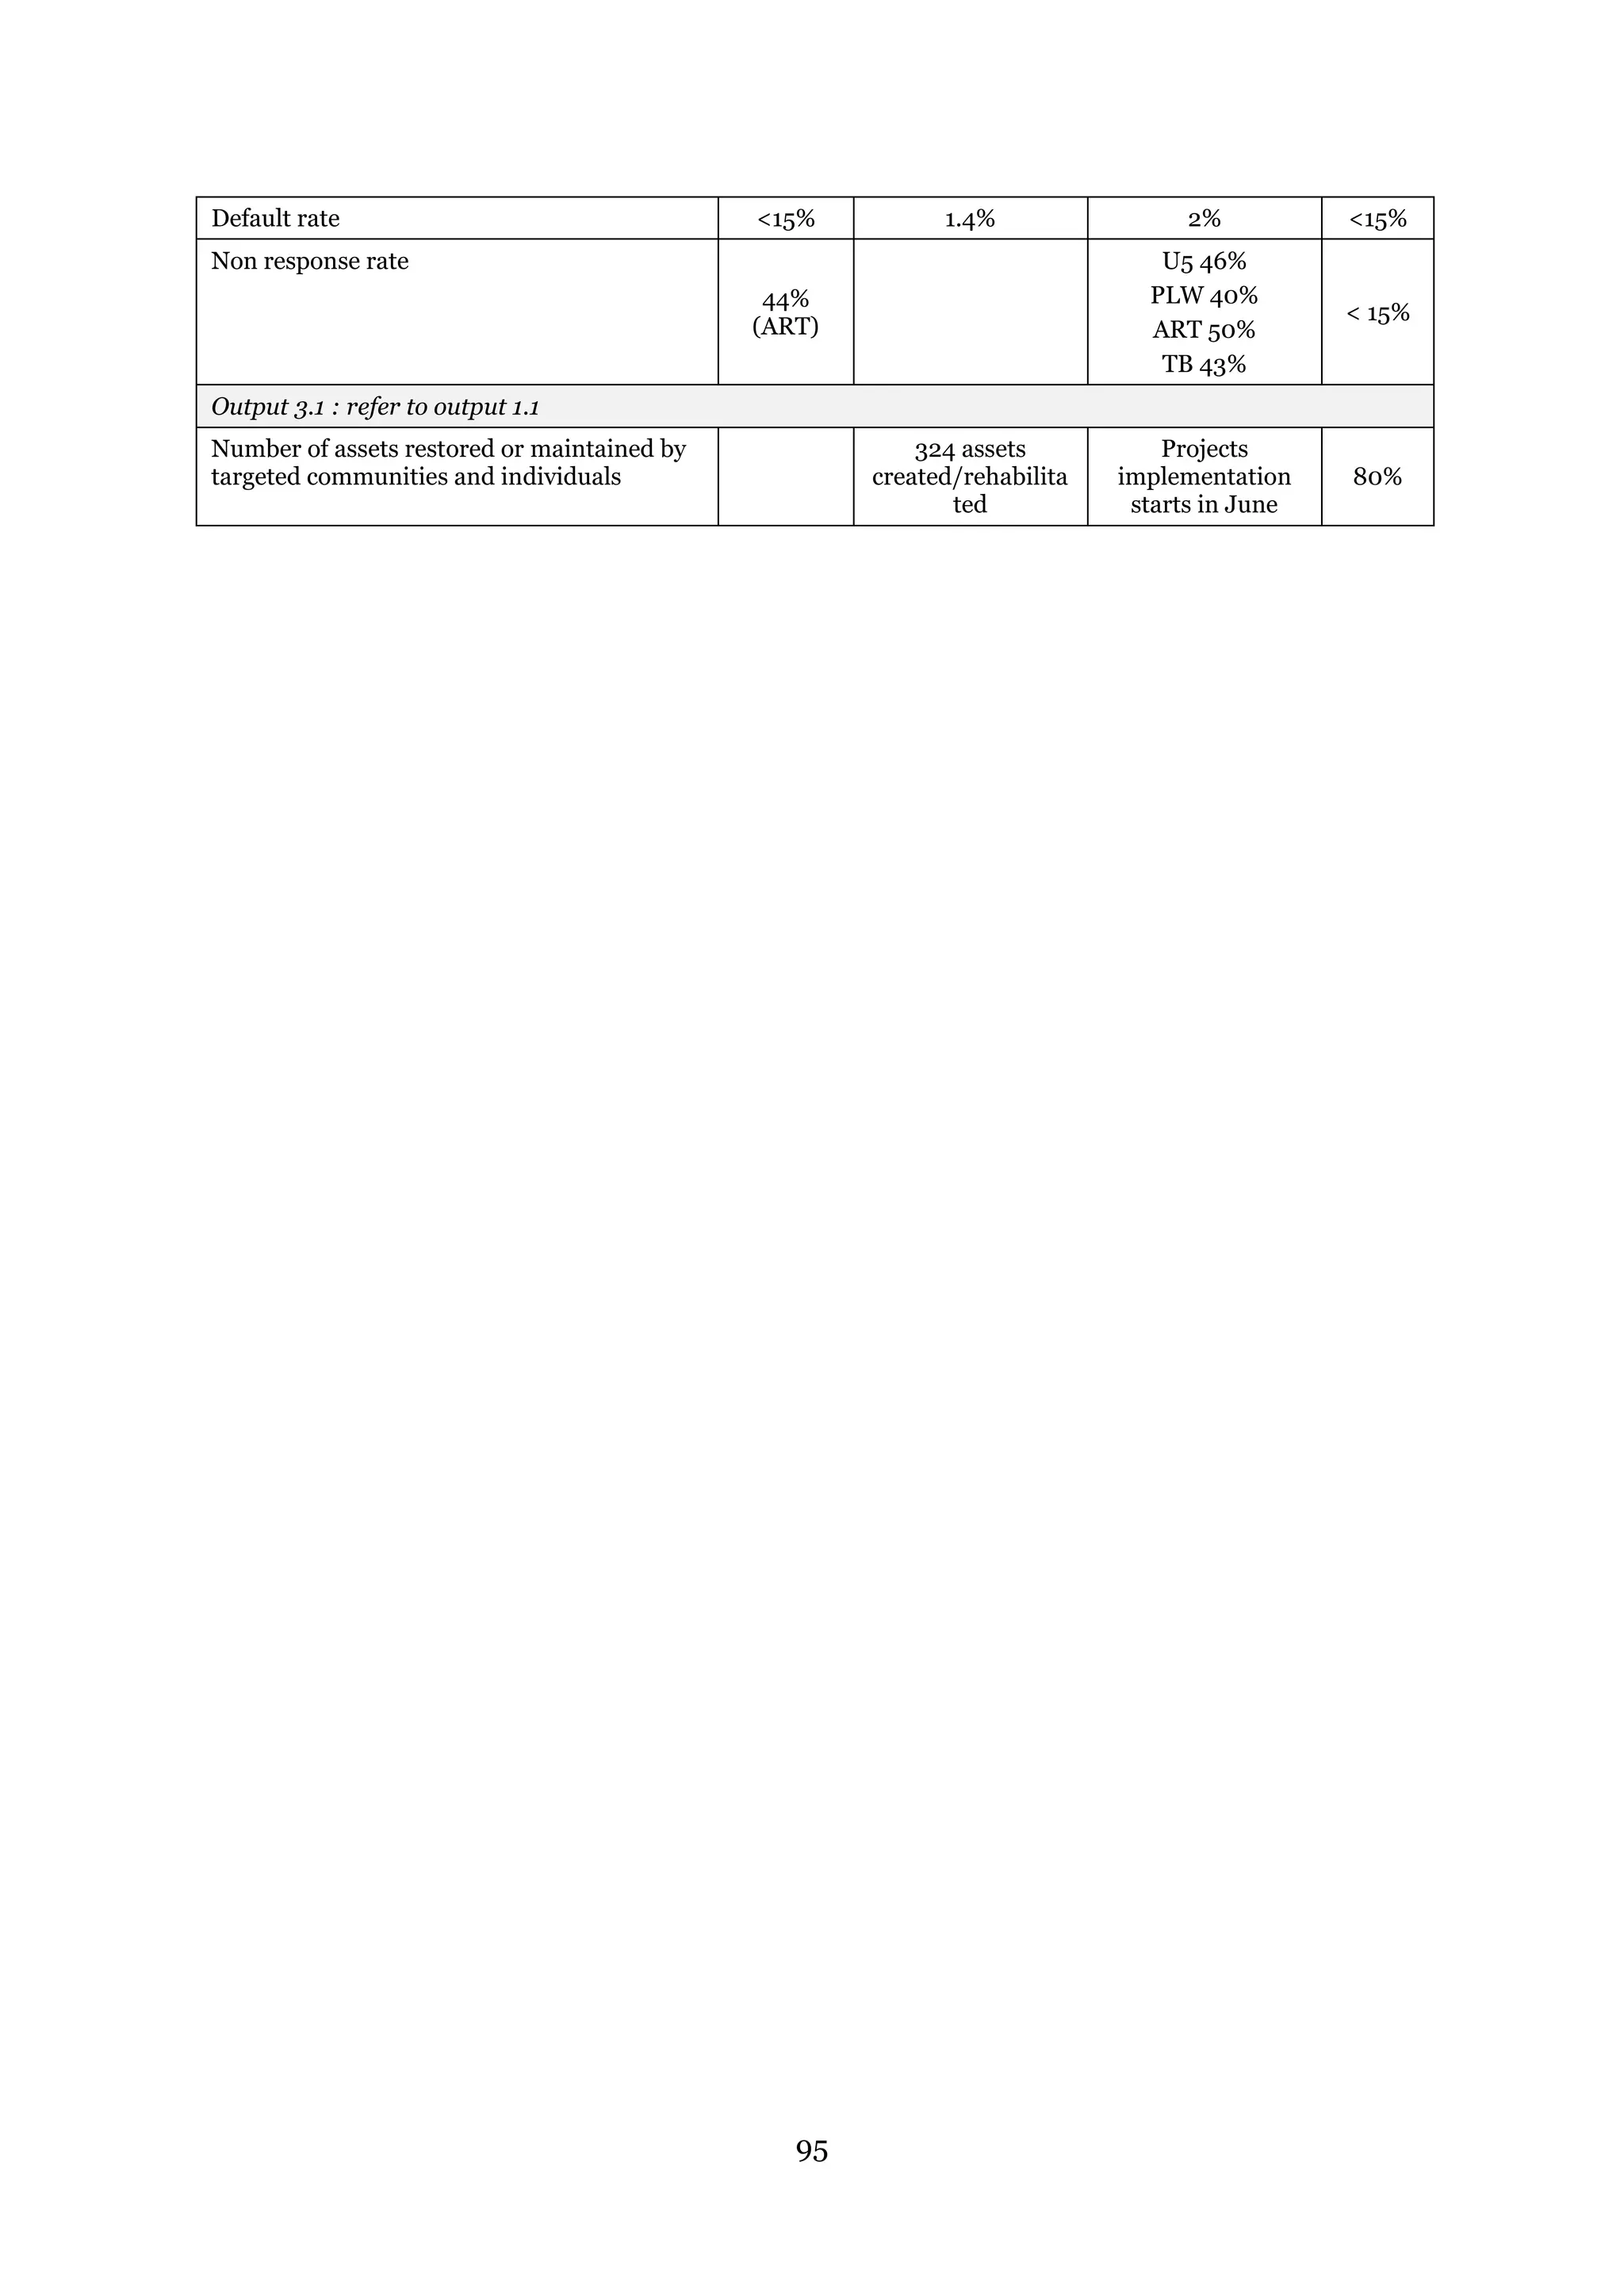
H&N programming distributed 17,068MT of food (90% of the target) and $3m worth
of vouchers (68% of the target). A total of 500,198 beneficiaries were assisted with
food or cash/voucher transfers, representing 110% of the target – an output made
possible by very high numbers of PLW and infants registered. Recovery rates were
considerably lower than the planned target of 75% because of lack of exit strategy,
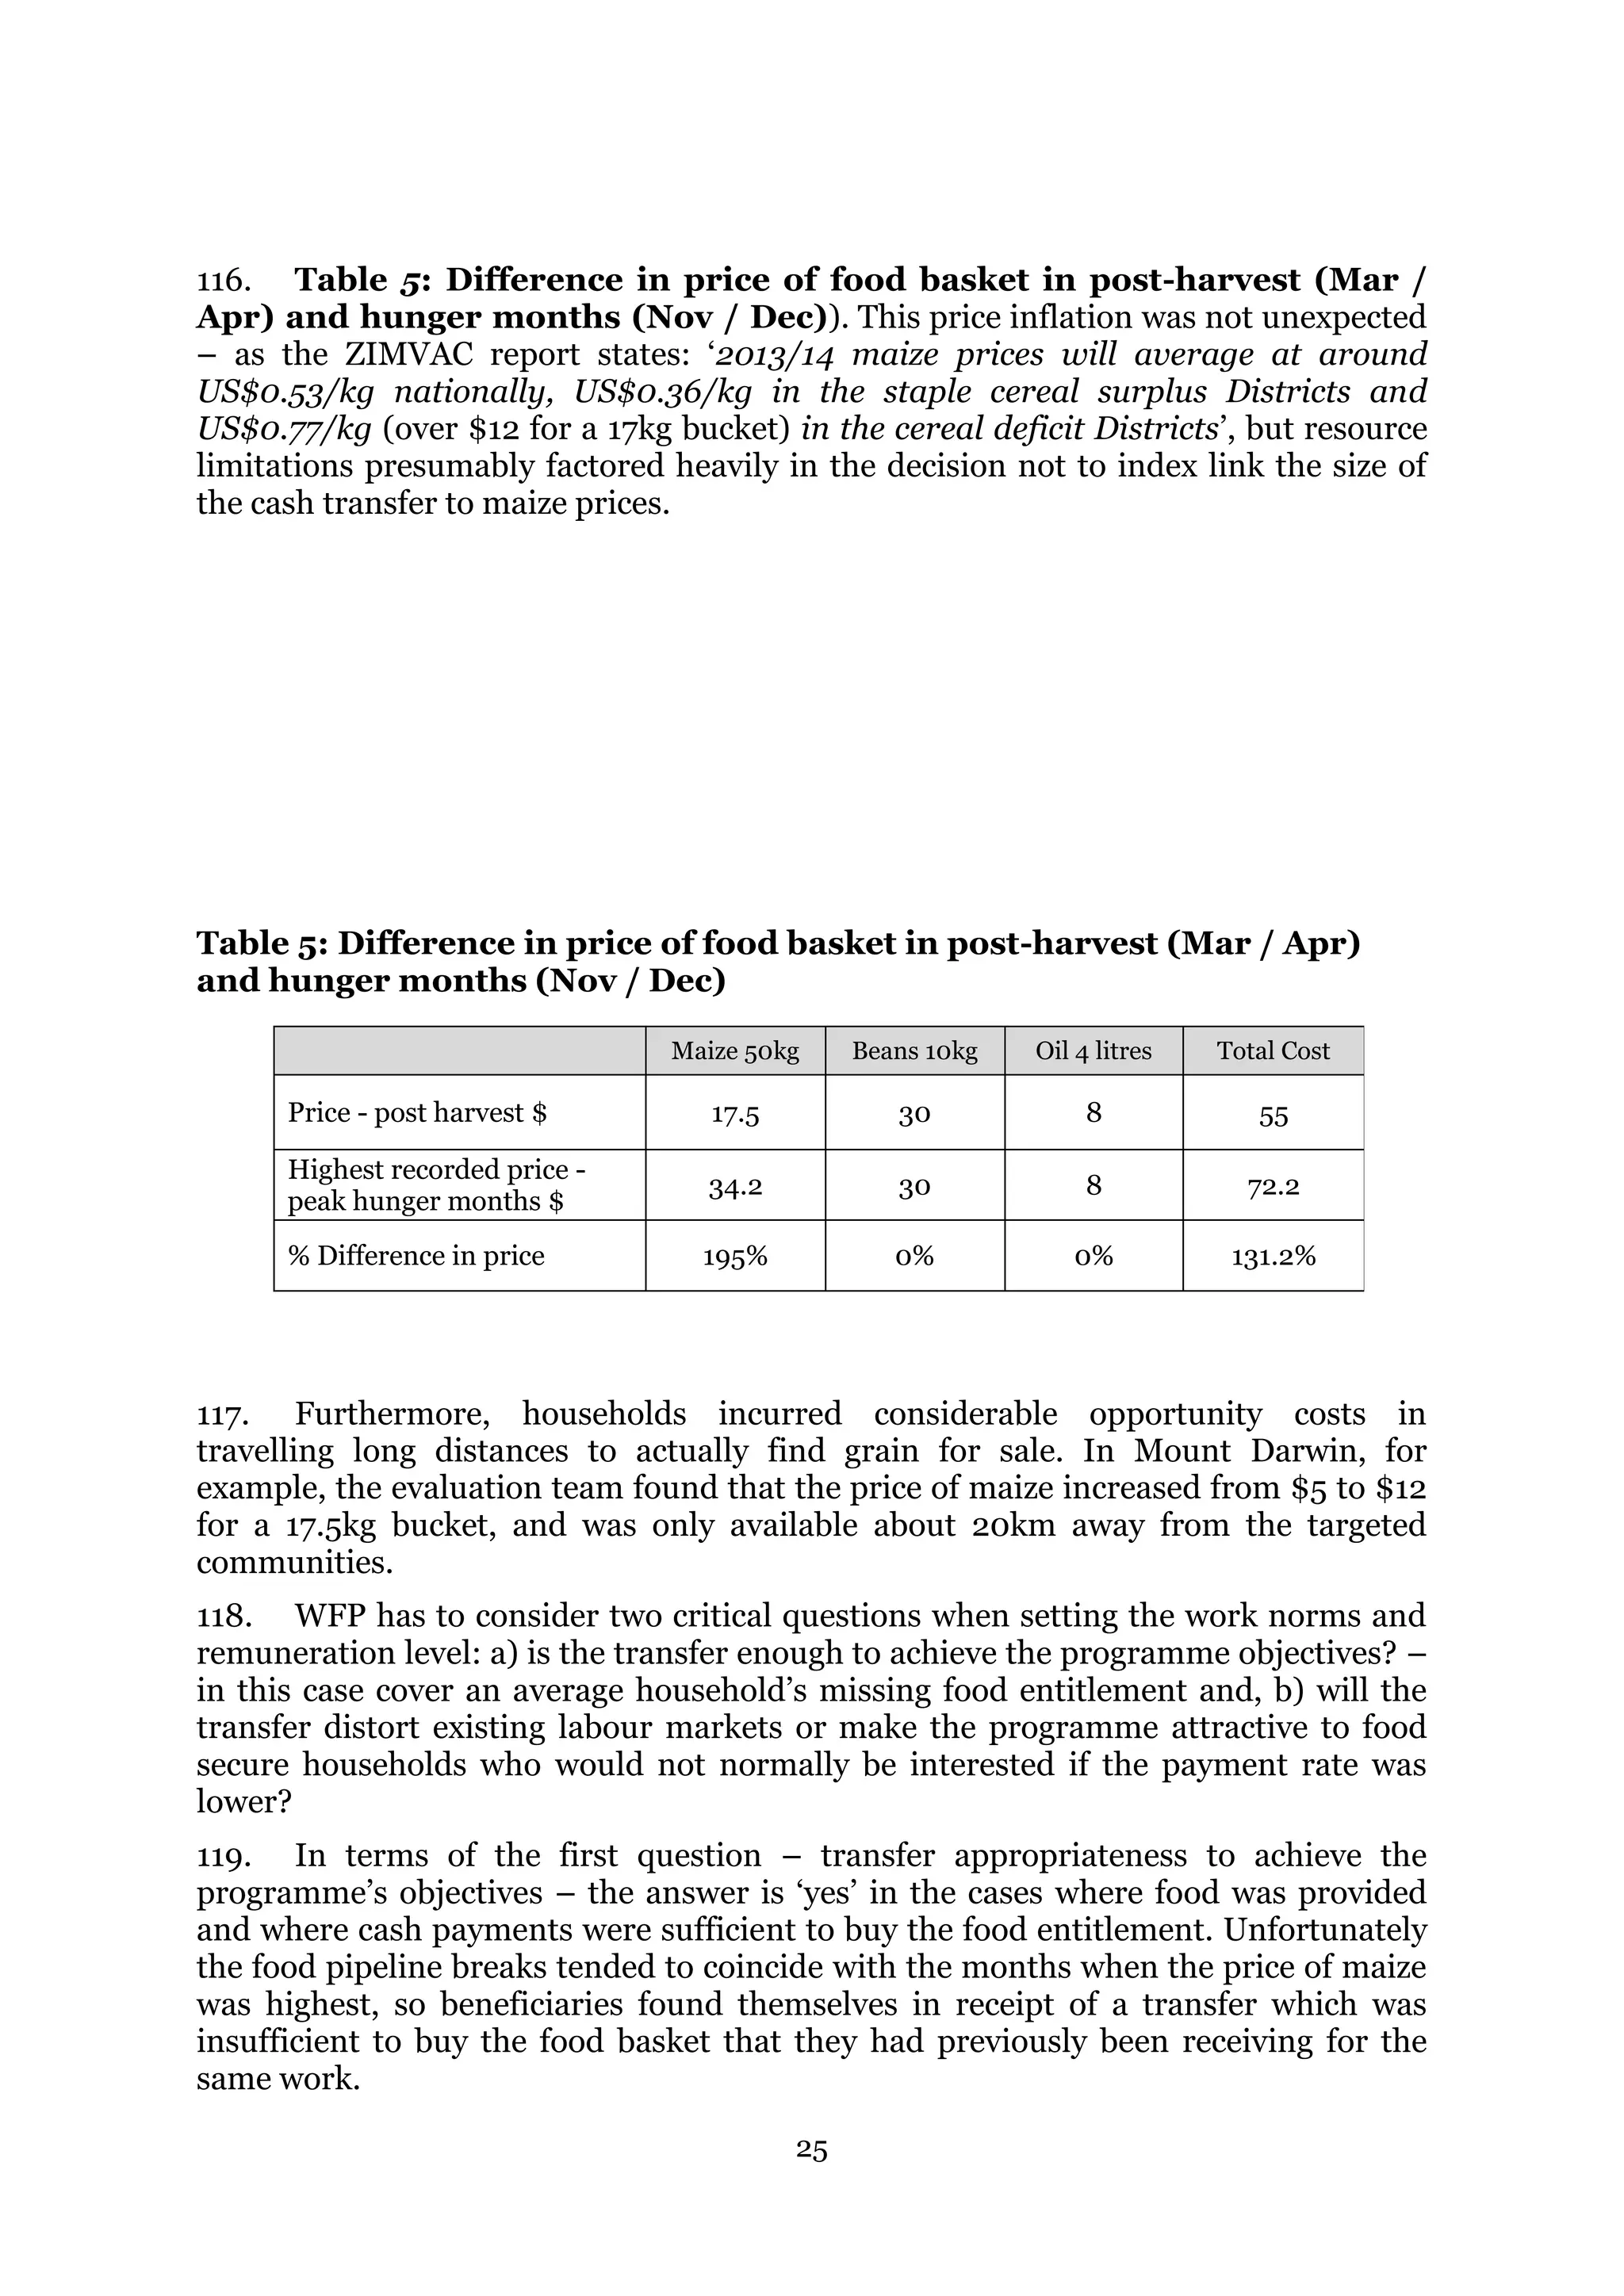
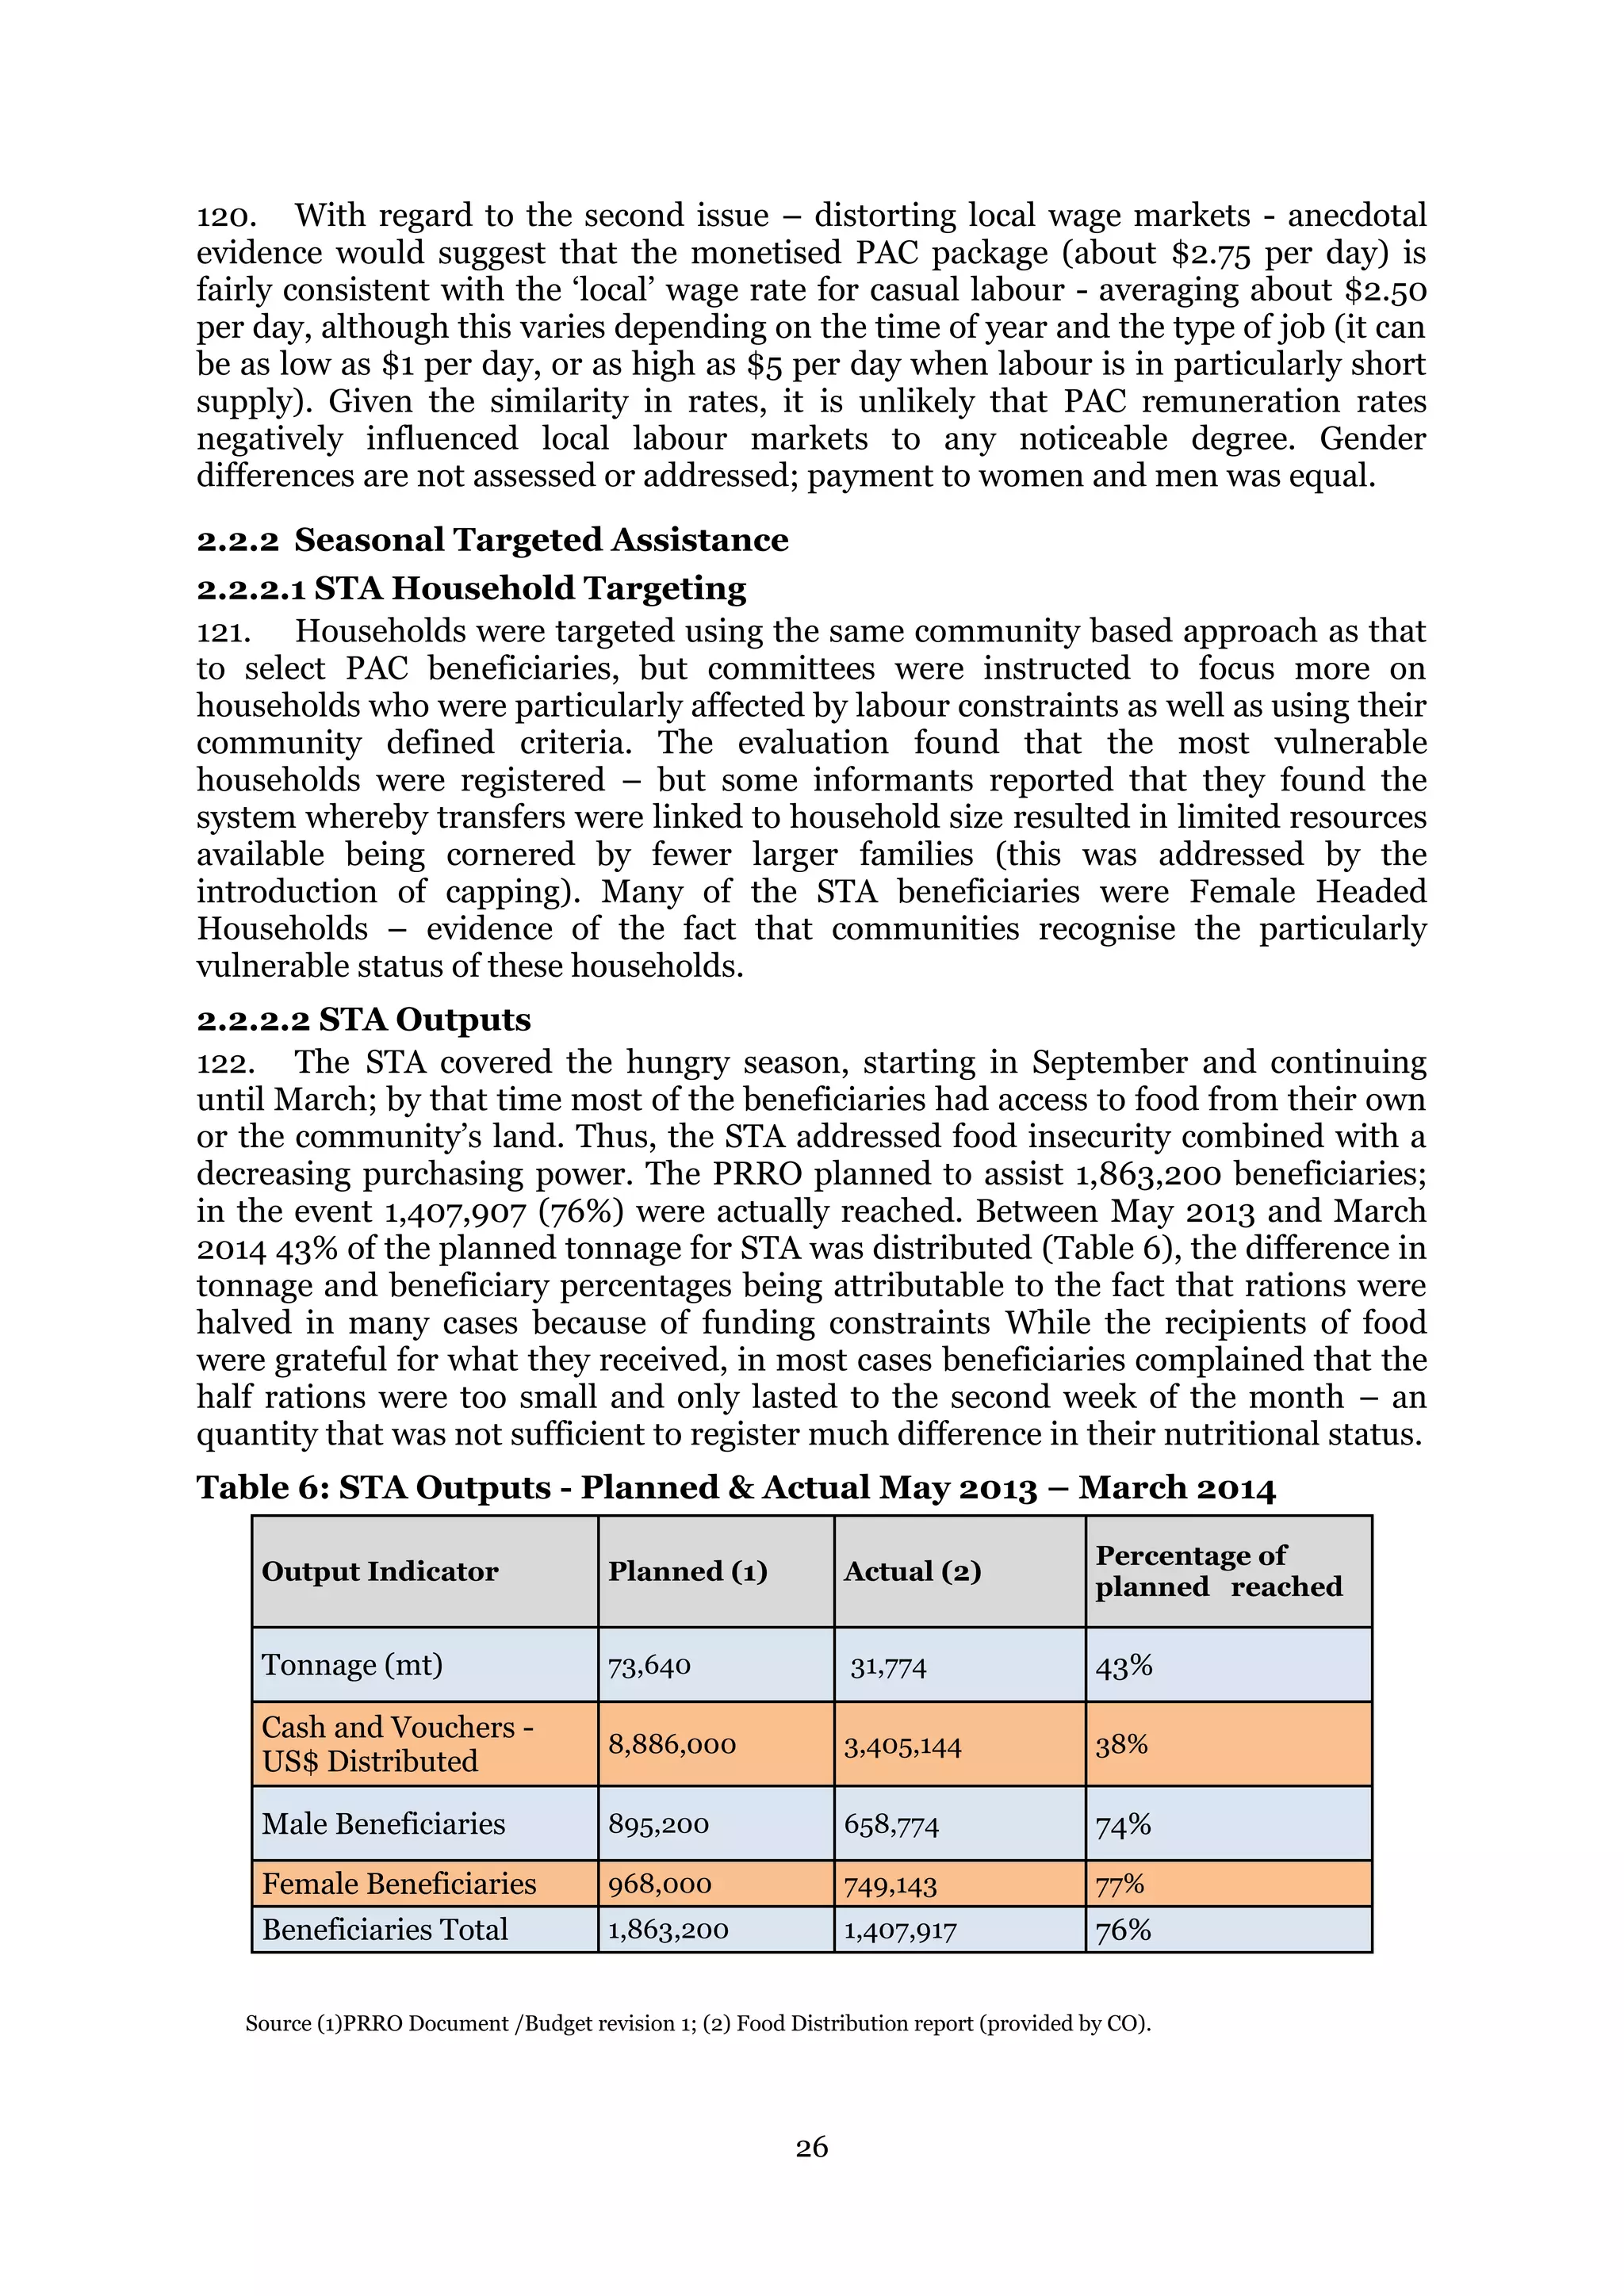
sudden end to the distribution and no interventions to address the other causes of
malnutrition.
The school feeding pilot did not take place.
2.3 Factors Affecting the Results
2.3.1 Internal Factors Affecting the Results
2.3.1.1 Size of Cash as a Transfer
167. As already mentioned, the fact that the cash transfers were not big enough to
purchase the quantity of cereal that households would have received had they been
given assistance in kind seriously affected impact. Pegging the size of the transfer at
the post-harvest price rather than the lean season price meant that households were
only able to purchase about half of their entitlement, hence reducing the impact. Of
course, the food they did buy was better than nothing, but the impact was less than
intended. In effect, all beneficiaries who were shifted from food to cash in the peak
hunger season took an enforced pay cut. Although there was little WFP could do
about it due to resource constraints, the switch to cash payments based on an
unrealistic calculation of the cost of the food basket at the height of the hunger
period was not appropriate to achieving the objectives of the PRRO.
2.3.1.2 Communication
168. There are two areas of communication that deserve mention. The first is WFPs
communication internally – from the main office to the Sub Offices. On a couple of
occasions the evaluation team detected a perception amongst staff in the sub-offices
that information tended to flow one way – from the bottom to the top – and the](https://image.slidesharecdn.com/bf1fb9fa-b81e-453e-8f3d-187e133a2a27-170124040005/75/wfp268240-53-2048.jpg)


![Terms of Reference
49
Annex 1: Terms of Reference
EVALUATION QUALITY ASSURANCE SYSTEM
Office Of Evaluation
Measuring Results, Sharing Lessons
[FINAL, 28/02/2014]
TERMS OF REFERENCE
OPERATION EVALUATION
ZIMBABWE PROTRACTED RELIEF AND RECOVERY OPERATION 200453
“RESPONDING TO HUMANITARIAN NEEDS AND STRENGTHENING
RESILIENCE TO FOOD INSECURITY”
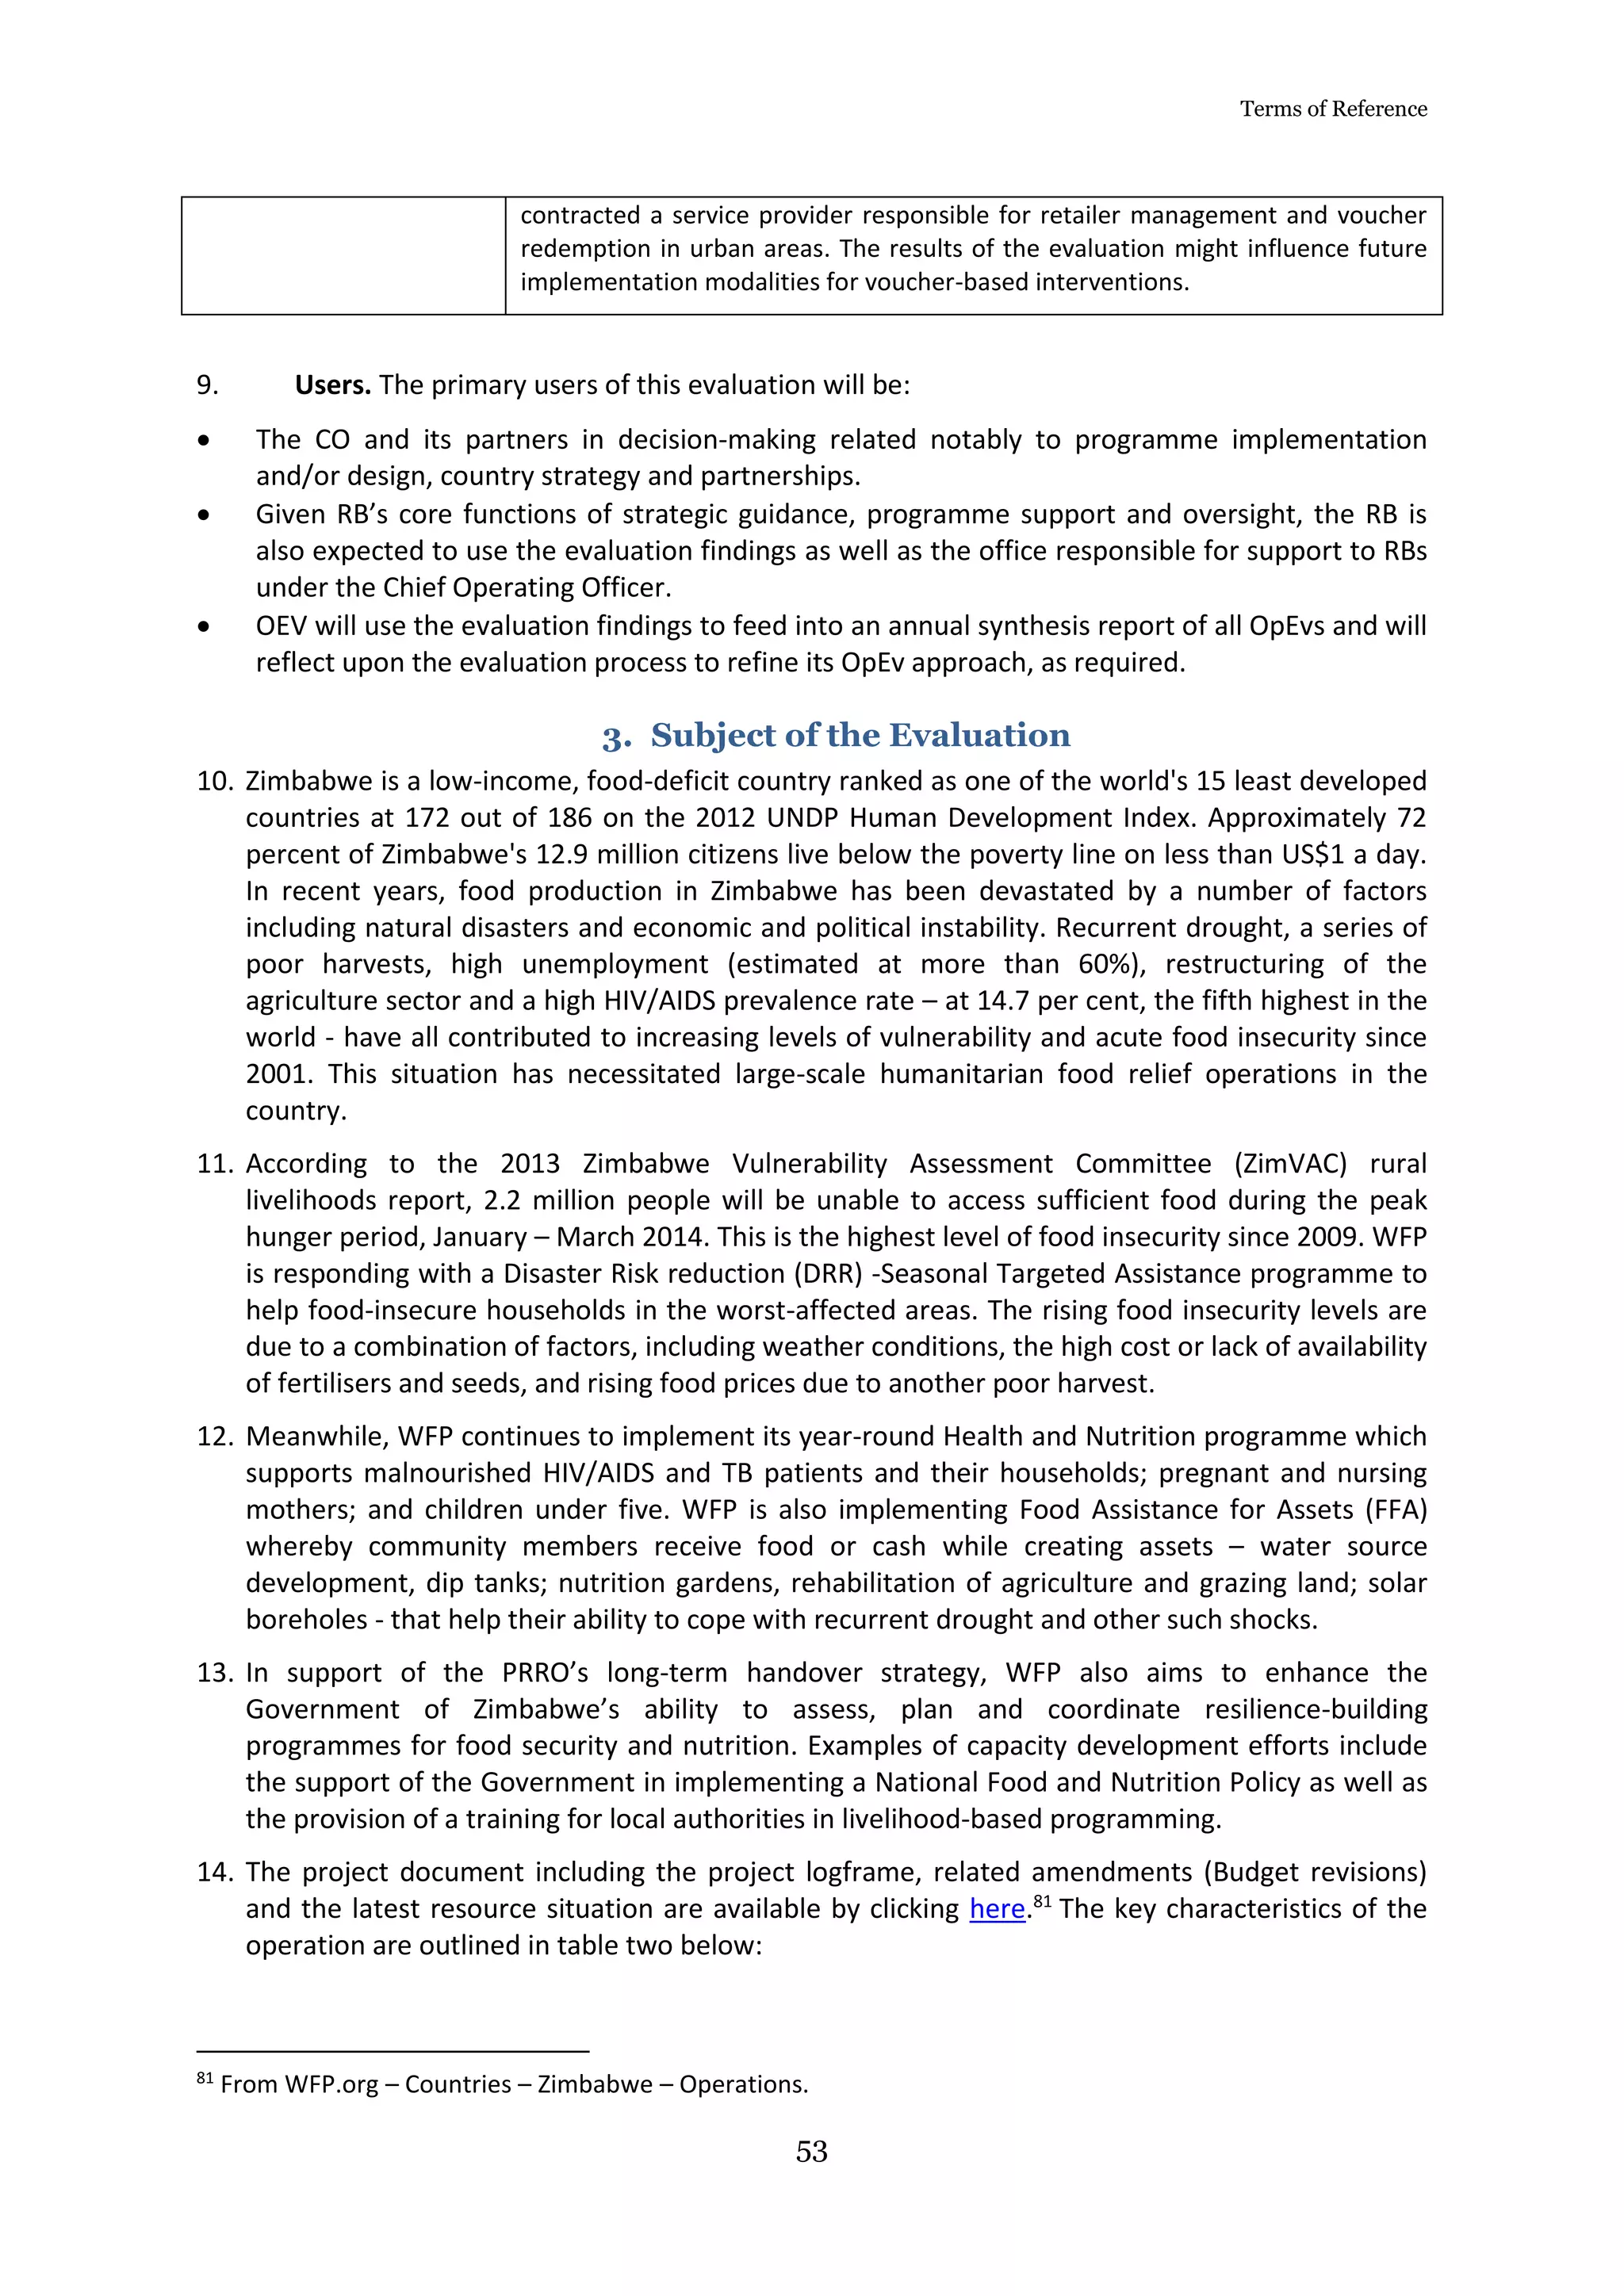
TABLE OF CONTENTS
1. Introduction......................................................................................................... 51
2. Reasons for the Evaluation.................................................................................. 51
2.1. Rationale.............................................................................................................. 51
2.2. Objectives............................................................................................................ 51
2.3. Stakeholders and Users ....................................................................................... 52
3. Subject of the Evaluation.....................................................................................53
4. Evaluation Approach ...........................................................................................56
4.1. Scope ................................................................................................................... 56
4.2. Evaluation Questions........................................................................................... 56
4.3 Evaluability Assessment ....................................................................................... 57
4.4. Methodology........................................................................................................ 58
4.5. Quality Assurance................................................................................................ 58
5. Phases and deliverables .......................................................................................59
6. Organization of the Evaluation............................................................................60
6.1 Outsourced approach......................................................................................... 60
6.2 Evaluation Management.................................................................................... 60
6.3 Evaluation Conduct ........................................................................................... 61
7. Roles and Responsibilities of WFP Stakeholders................................................62
8. Communication and budget ................................................................................63
8.1. Communication................................................................................................. 63
8.2. Budget............................................................................................................... 63
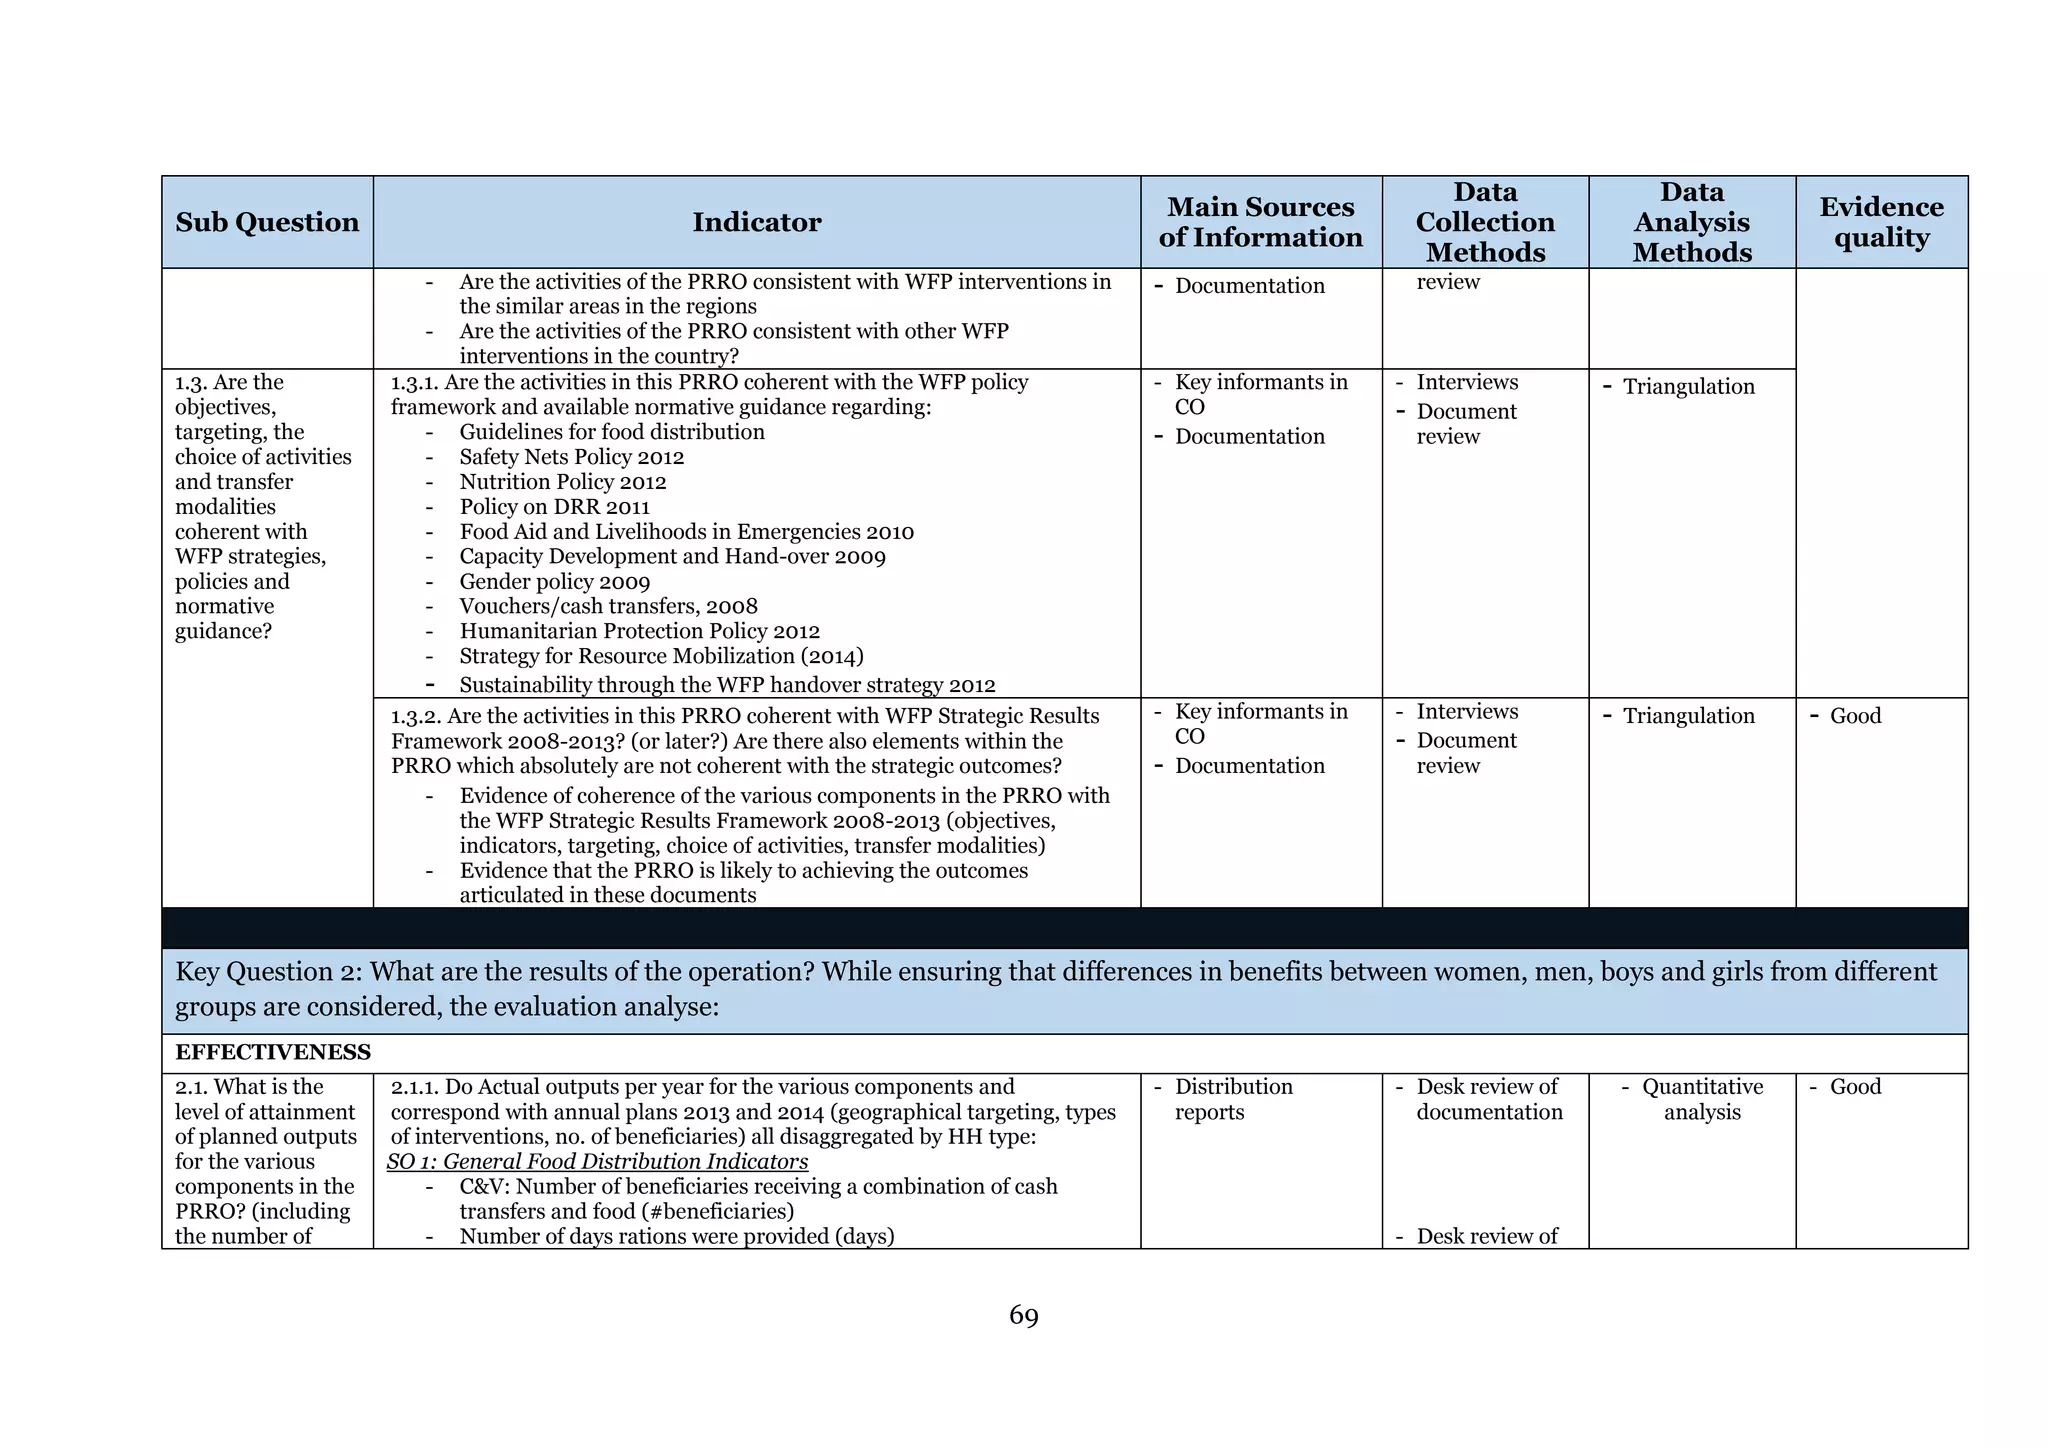
Annex 1: Map................................................................................................................63](https://image.slidesharecdn.com/bf1fb9fa-b81e-453e-8f3d-187e133a2a27-170124040005/75/wfp268240-70-2048.jpg)


![[USA & Canada] Sinclair, R. (2011). “To evaluate literacy and numeracy progra...](https://cdn.slidesharecdn.com/ss_thumbnails/2011sinclairrae-150401162706-conversion-gate01-thumbnail.jpg?width=640&height=640&fit=bounds)


