This document provides a comprehensive management plan for Utah Lake. It summarizes the lake's geographic setting and physical characteristics, including its sediments. It also examines the hydrology of the lake, including its sources of inflow such as streams and wastewater as well as outflow like evaporation. Additionally, it analyzes the water quality of the lake and its tributaries, factors influencing water quality like phosphorus levels, and sources of nonpoint pollution. The document also reviews past and current commercial, cultural, and recreational activities on and around the lake. Finally, it describes the biology of the lake, including groups like phytoplankton, macroinvertebrates, birds, fish, mammals, and wetland fl
![51
6.2 Recreation
Utah Lake has a long history of recreation and tourism that have been recently impacted
by public perceptions of the lake. This summary relies on available data and anecdotal literature
compiled from public records. A complete understanding of the current and projected use of the
resources requires collection of additional data from resource users, neighbors, and state, local
and associated businesses. Found here is a summary of the history of recreation and its decline
on Utah Lake, as well as data compiled by Utah State Parks on the use within the state park
portion of the lake.
6.2.1 Recreation History
Utah Lake, the largest freshwater lake west of the Mississippi, has been an important
source of recreation throughout the years, (Jackson and Stevens, 1981). In the mid 1800’s
Mormon settlers began using Utah Lake as a means of survival. Not too long after settling in the
area Utah Lake became a source of recreation and leisure; in fact, Anglo settlers ranked
recreation as the lake’s third most important use (Clean Lakes Program Application for Utah
Lake).
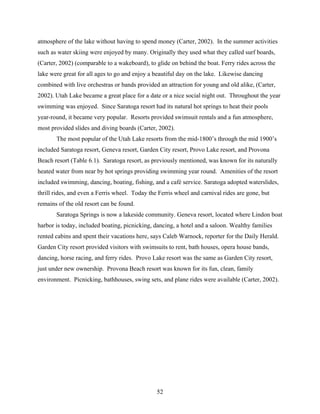
Toward the late 1800’s many recreational and leisure activities on and near the lake
began to develop (Carter, 2002). These activities included boat racing, horse races, waterskiing,
ferry rides across the lake, swimming, bonfires, fishing, dancing and live music, community
events, picnics, duck hunting, and opening of resorts (Carter, 2002). Boat racing started in the
1890’s, but because of the shallowness of the water the races were soon called off. In 1938,
however, races started again with Memorial Day boat racing. People came from all over the
nation to participate. This was a spectacular event among residents. These races lasted well into
the1970’s. Commenting on these races, Bill Loy, Jr., fourth generation Utah Lake commercial
fisherman says “Boat races, that was the big thing. There were more boat racers in Utah County
[than in any other county] in the United States. It had every class imaginable. What they call
skip jacks about 12 feet long…all the way up to unlimited hydroplanes” (Carter, 2002).
Horse racing was another exciting event. People from miles away came to enjoy the
thrill of a great race. Cabins provided a nice place for visitors to stay. Bonfires, wildlife
watching and other community events gave residents and others visiting the ability to soak in the](https://image.slidesharecdn.com/8a7f31fb-e1ff-4da1-93df-78b5133c2052-161201162116/85/10-1-1-129-7394-51-320.jpg)
![103
Bon, R.L. and Wakefield, S. 1999b. Large Mine Permits. [On-line]. Utah Geological Survey.
World Wide Web: http://geology.utah.gov/maps/georesmap/pdf/pi-67.pdf
Bosworth, W.R. III. 2003. Vertebrate information compiled by the Utah Natural Heritage
Program: A Progress Report. Department of Natural Resources Division of
Wildlife Resources - Utah Natural Heritage Program.
Boyd, A.E., and Cassel, M.D. 2005. Utah Lake TMDL Data Validation and Evaluation. Psomas
Engineering, Salt Lake City, Utah, 74 p.
Brimhall, W.H. 1972. Recent History of Utah Lake as Reflected in Its Sediments; A First Report.
Brigham Young University Geology Studies, Vol. 19, Part 2, pp. 121-126.
Brimhall, W.H., and Merritt, L.B. 1981. Geology of Utah Lake: Implementations for Resource
Management. Great Basin Naturalist Memoirs Number 5, Utah Lake Monograph.
Brigham Young University. pp 24-42.
Brotherson, J.D. 1981. Aquatic and Semiaquatic Vegetation of Utah Lake and its
Bays. Great Basin Naturalist Memoirs Number 5, Brigham Young University,
pp.68-84.
Bushman, J.R. 1980. The Rate of Sedimentation in Utah Lake and the use of Pollen as an
Indicator of Time in the Sediments. Geology Studies, Brigham Young University, Vol.
27, Part 3, pp. 35-43.
Campbell, N.A., and Reece, J.B. 2002. Biology. San Francisco, Benjamin Cummings.
Carter, R.D. 2002. Utah Lake: Legacy. June Sucker Recover Implementation Program, Utah. 165
pp.
Catala, P. 2003. Saratoga Springs goes back to its Resort Roots. The Daily Herald (April).
Central Utah Water Conservancy District. 2004a. Utah lake Drainage Basin Water delivery
System, Environmental Impact Statement Volume I. Orem, U.S. Department of the
Interior. 527 p.
Central Utah Water Conservancy District. 2004b. Utah Lake Drainage Basin Water Delivery
System Environmental Impact Statement: Draft Wildlife Resources and Habitat Technical
Report. Orem, U.S. Department of the Interior. 36 p.
Central Utah Water Conservancy District. 2004c. Utah Lake Drainage Basin Water Delivery
System Environmental Impact Statement: Draft Aquatic Resources Technical Report.
Orem, U.S. Department of the Interior. 165 p.](https://image.slidesharecdn.com/8a7f31fb-e1ff-4da1-93df-78b5133c2052-161201162116/85/10-1-1-129-7394-103-320.jpg)