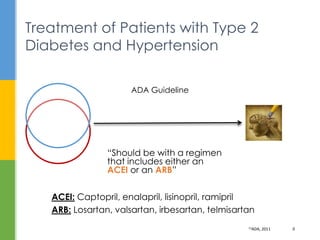
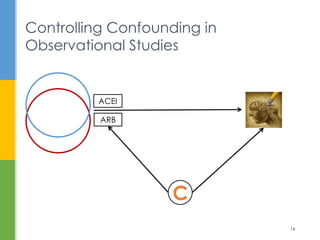
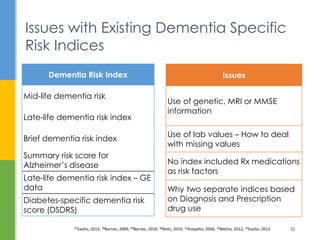
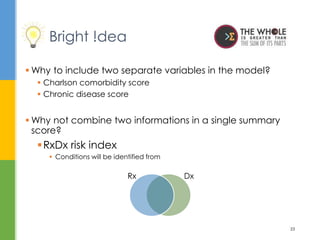
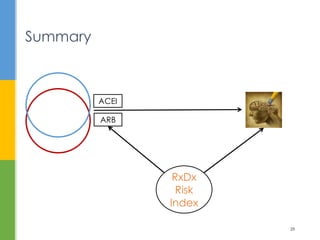
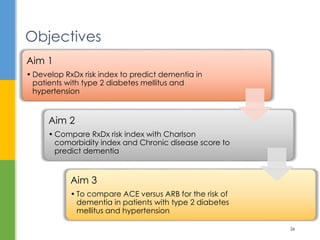
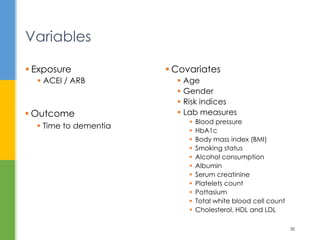
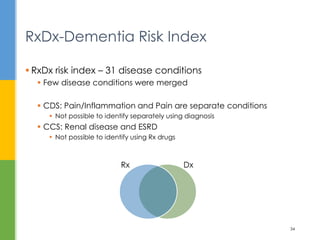
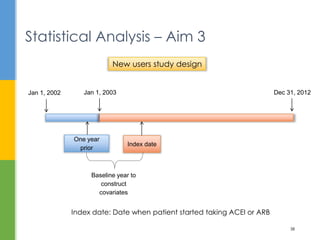
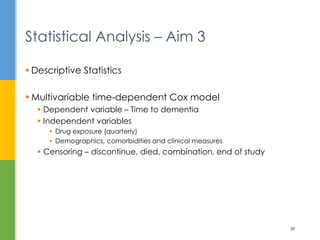
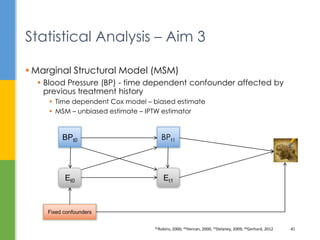
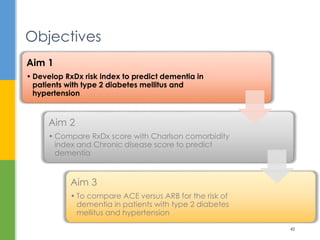
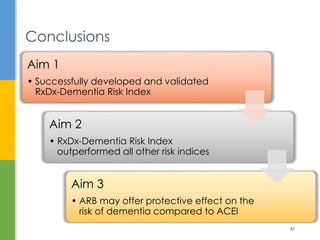
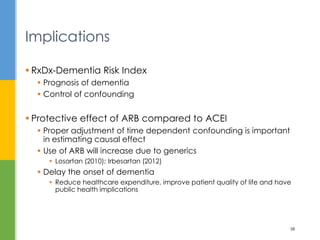
Hemalkumar B. Mehta, MS
PhD Candidate in Pharmaceutical Health Outcomes and Policy
Comparative Effectiveness of
ACEI and ARB for the Risk of Dementia in Elderly
Patients with Diabetes and Hypertension
1
Outline
2
Introduction
Objectives
Methods
Results
Conclusions
Why elderly patients with type 2 diabetes and hypertension?
Why dementia outcome?
Why compare ACEI and ARB?
How to properly account for confounding?
Introduction
3
HypertensionType 2 Diabetes
Two Major Public Health Problems
1 CDC, 2011; 2 Zhang, 2010; 3DIabetes Atlas, 2013; 4Wang, 2004; 5Yoon, 2012; 6Heidenreich, 2011
4
Prevalence
• Adults: 60%
• Elderly: 88%
Cost
• $131 billion (2010)
• $389 billion (2030)
Prevalence
• All age: 8.3%
• Elderly: 26.9%
Cost
• $198 billion (2010)
• $264 billion (2030)
1 + 1 = 3
7Deedwania, 2005 5
HypertensionType 2 Diabetes
Diabetes + Hypertension = “Deadly Duet”
Elderly Patients with “Deadly Duet”
Conditions are At High Risk of Dementia
8Plassman, 2007; 9Hendrie, 2007; 10Fillit, 2012; 11Cukierman, 2005 6
96% of dementia patients
≥65 years of age
Diabetes patients are twice
as likely to develop
dementia
Hypertension is an
independent risk factor for
dementia
Burden of Dementia
12Alzheimer's disease facts and figures, 2013 7
Treatment of Patients with Type 2
Diabetes and Hypertension
13ADA, 2011 8
ADA Guideline
“Should be with a regimen
that includes either an
ACEI or an ARB”
ACEI: Captopril, enalapril, lisinopril, ramipril
ARB: Losartan, valsartan, irbesartan, telmisartan
ACEI, ARB and Cognitive Function
14
9
 ONTARGET clinical trial
 ARB (Telmisartan) vs. ACE (Ramipril) - Secondary endpoints
 Cognitive impairment: OR = 0.90 (95%CI: 0.80-1.01)
 Epidemiological Studies
ACEI, ARB and the Risk of Dementia
15 Anderson, 2011; 16 Johnson, 2012; 17Li, 2010; 18 Davies, 2012; 19Yasar, 2013 10
Study Drug treatment HR, 95% CI
Johnson et al., 2012 ARB versus non-users 0.78 (0.71–0.85)
Li et al., 2010 ARB versus Lisinopril 0.81 (0.68-0.96)
Davies et al., 2011
ARB versus other antihypertensive
ACEI versus other antihypertensive
0.47 (0.37-0.58)
0.76 (0.69-0.84)
Yasar et al., 2013
ARB versus none
ACEI versus none
ARB versus ACEI
0.31 (0.14-0.68)
0.50 (0.29-0.83)
0.62 (0.27-1.40)
 Baby boomers
 By 2050, 88.5 million older Americans (20.2%) of total population
 ↑ Incidence of type 2 diabetes and hypertension
 Greater risk for dementia
 Treatment that can delay dementia onset by few years
 Major public health implication
 Blood Pressure – time varying confounder affected by
previous treatment history
 Prior studies did not properly account for it
Significance: CER of ACEI and ARB
11
CER of ACEI versus ARB for the Risk of
Dementia
12
ACEI
ARB
13
Controlling Confounding in
Observational Studies
14
ACEI
ARB
C
1. Categorical variables for comorbidities
2. Charlson comorbidity score (CCS) – 1987
 Diagnosis based score – 17 diseases
 Adaptation in administrative claims data – ICD-9-CM algorithms
3. Chronic disease score (CDS) – 1995
 Rx based score – 29 disease categories
 Drugs and drug classes - American Hospital Formulary system
How to Control for Confounding?
20Charlson, 1987; 21Clark, 1995; 22Austin, 2013 15
Including CCS and CDS Improves
Confounding Control
16
ACEI
ARB
CCS
CDS
Including CCS and CDS improves
Confounding Control
23Schneeweiss, 2001; 24Mehta, 2013; 25Mehta, 2013; 26Mcgregor, 2006 17
Including CCS and CDS improves
Confounding Control
18
Including CCS and CDS improves
Confounding Control
19
Including CCS and CDS improves
Confounding Control
20
Including CCS and CDS improves
Confounding Control
21
Issues with Existing Dementia Specific
Risk Indices
27Exalto, 2013; 28Barnes, 2009; 29Barnes, 2010; 30Reitz, 2010; 31Kivipelto, 2006; 32Mehta, 2012; 33Exalto, 2013 22
Issues
Use of genetic, MRI or MMSE
information
Use of lab values – How to deal
with missing values
No index included Rx medications
as risk factors
Why two separate indices based
on Diagnosis and Prescription
drug use
Dementia Risk Index
Mid-life dementia risk
Late-life dementia risk index
Brief dementia risk index
Summary risk score for
Alzheimer’s disease
Late-life dementia risk index – GE
data
Diabetes-specific dementia risk
score (DSDRS)
 Why to include two separate variables in the model?
 Charlson comorbidity score
 Chronic disease score
 Why not combine two informations in a single summary
score?
RxDx risk index
 Conditions will be identified from
Bright !dea
23
Rx Dx
 First study to combine diagnosis and prescription drug
information in one risk index
 Easily applicable to claims and EMR data
 Diagnosis
 Prescription
 New tool for confounding control
 Useful for identifying patients at risk
 Steps can be taken to target modifiable risk factors for dementia
Significance: RxDx Risk Index
24
Summary
25
ACEI
ARB
RxDx
Risk
Index
Objectives
26
Aim 1
• Develop RxDx risk index to predict dementia in
patients with type 2 diabetes mellitus and
hypertension
Aim 2
• Compare RxDx risk index with Charlson
comorbidity index and Chronic disease score to
predict dementia
Aim 3
• To compare ACE versus ARB for the risk of
dementia in patients with type 2 diabetes
mellitus and hypertension
Data Source
Study Cohort
Variables
Statistical Analysis
Methods
27
 Electronic medical record data, United Kingdom (UK)
 Information entered by general practitioner (GPs)
 12 million patients - 593 general practices
 Anonymized longitudinal clinical and prescribing information
 Clinical diagnoses are recorded using medcodes
 High validity (Median = 89%)
 Prescription information is well documented
 Computerized system generates each prescription
 Clinically Rich
 >450 lab measures
Clinical Practice
Research Data
34 Williams, 2012; 35Lewis, 2002 28
 Elderly (age ≥ 60 years)
 Diagnosed with type 2 diabetes
 Diagnosis or (abnormal lab value + oral hypoglycemic agent)
 Diagnosed with hypertension
 Diagnosis or (abnormal lab value + antihypertensive agent)
 Prevalent dementia cases were excluded
Study Cohort
29
 Covariates
 Age
 Gender
 Risk indices
 Lab measures
 Blood pressure
 HbA1c
 Body mass index (BMI)
 Smoking status
 Alcohol consumption
 Albumin
 Serum creatinine
 Platelets count
 Pottasium
 Total white blood cell count
 Cholesterol, HDL and LDL
 Exposure
 ACEI / ARB
Variables
30
 Outcome
 Time to dementia
 29 disease categories based
on Rx drug use
 Developed algorithm to map
CDS to multiples Rx coding
system
 Two sets of weights
Chronic disease score
 17 disease categories
 The CCS has been adapted to
CPRD data medcodes system
 Three sets of weights
Charlson comorbidity index
Risk Indices
20Charlson, 1987; 36Schneeweiss, 2003; 37Quan, 201; 21Clark, 1995; 38Johnson, 2006 31
 29 disease categories based
on Rx drug use
 Developed algorithm to map
CDS to multiples Rx coding
system
 Two sets of weights
Chronic disease score
 17 disease categories
 The CCS has been adapted to
CPRD data medcodes system
 Three sets of weights
Charlson comorbidity index
Risk Indices
32
 29 disease categories based
on Rx drug use
 Developed algorithm to map
CDS to multiples Rx coding
system
 Two sets of weights
Chronic disease score
 17 disease categories
 The CCS has been adapted to
CPRD data medcodes system
 Three sets of weights
Charlson comorbidity index
Risk Indices
33
 RxDx risk index – 31 disease conditions
 Few disease conditions were merged
 CDS: Pain/Inflammation and Pain are separate conditions
 Not possible to identify separately using diagnosis
 CCS: Renal disease and ESRD
 Not possible to identify using Rx drugs
RxDx-Dementia Risk Index
34
Rx Dx
Statistical Analysis – Aim 1
35
Jan 1, 2003
Index date
One year
prior
Jan 1, 2002 Dec 31, 2012
Baseline year to
construct risk index
Index date: Date when patient was diagnosed with
type 2 diabetes mellitus and hypertension
 Cox proportional hazards regression
 Dependent variable – Time to dementia
 Independent variables
 Age and gender
 RxDx disease conditions
 Censoring – discontinue, died, combination, end of study
 Weights were assigned based on beta coefficient
 Rule: Beta * 10  round it to the nearest integer
 Discrimination: c-statistics
 Validation: 10 cross-fold validation
 Calibration: Hosmer-Lemeshow calibration
Statistical Analysis – Aim 1
39Harrell, 2001 36
 Discrimination
 C-statistics (0.7-0.8 = acceptable; 0.8-0.9 = excellent)
 Net reclassification index (NRI)
 Assesses risk reclassification and is the sum of improvement in
cases and in controls
 Positive NRI indicates “new” model is better compared to “old”
 Integrated discrimination index (IDI)
 Difference in discrimination slopes between two models
 Positive IDI indicates “new” model is better compared to “old”
Statistical Analysis – Aim 2
39Harrell, 2001; 40Cook, 2009 37
Statistical Analysis – Aim 3
38
Jan 1, 2003
Index date
One year
prior
Jan 1, 2002 Dec 31, 2012
Baseline year to
construct
covariates
Index date: Date when patient started taking ACEI or ARB
New users study design
 Descriptive Statistics
 Multivariable time-dependent Cox model
 Dependent variable – Time to dementia
 Independent variables
 Drug exposure (quarterly)
 Demographics, comorbidities and clinical measures
 Censoring – discontinue, died, combination, end of study
Statistical Analysis – Aim 3
39
 Marginal Structural Model (MSM)
 Blood Pressure (BP) - time dependent confounder affected by
previous treatment history
 Time dependent Cox model – biased estimate
 MSM – unbiased estimate – IPTW estimator
Statistical Analysis – Aim 3
41Robins, 2000; 42Hernan, 2000; 43Delaney, 2009; 44Gerhard, 2012 40
BPt0 BPt1
Et0 Et1
Fixed confounders
Results | Discussion
41
Objectives
42
Aim 1
• Develop RxDx risk index to predict dementia in
patients with type 2 diabetes mellitus and
hypertension
Aim 2
• Compare RxDx score with Charlson comorbidity
index and Chronic disease score to predict
dementia
Aim 3
• To compare ACE versus ARB for the risk of
dementia in patients with type 2 diabetes
mellitus and hypertension
 Cohort included 133,176 patients
 Means age = 72.12 years (SD =8.04)
 52% of patients were male
 Incidence of dementia = 3.42%
Aim 1: Descriptive Statistics
43
Disease categories
identified using
diagnosis
n, (%)
Disease categories
identified using
prescription drug
use (n, %)
Disease categories
identified using
diagnosis or
prescription drug
use (n, %)
Chronic pulmonary
disease
3,501 (2.63) 27,154 (20.39) 27,583 (20.71)
Rheumatologic disease 1,443 (1.08) 13,154 (9.88) 13,426 (10.08)
Peptic ulcer disease 332 (0.25) 42,474 (31.89) 42,521 (31.93)
Aim 1 - Deriving Points for RxDX
Conditions
44
Beta Estimates
(p-value)
Hazard Ratio
(95% CI)
Points
Myocardial infarction -0.16 (0.21) 0.85 (0.65-1.10) -2
Congestive heart failure -0.07 (0.02) 0.93 (0.87-0.99) -1
Coronary and peripheral
vascular disease
0.15 (<0.001) 1.16 (1.07-1.26) 1
Cerebrovascular disease 0.36 (<0.001) 1.43 (1.23-1.67) 4
Epilepsy 0.33 (<0.001) 1.39 (1.22-1.58) 3
Hyperlipidemia 0.11 (<0.001) 1.11 (1.05-1.19) 1
Parkinson’s disease 0.78 (<0.001) 2.19 (1.81-2.64) 8
Depression 0.61 (<0.001) 1.84 (1.71-1.97) 6
Psychotic illness 0.63 (<0.001) 1.88 (1.71-2.06) 6
CalibrationCross - Validation
Aim 1: Cross-Validation | Calibration
45
RxDx-Dementia
Risk Index
C-statistics 0.806 (0.798 – 0.814)
Ten-fold
cross-validation
C-statistics
0.806 (0.800 – 0.813)
1 2 3 4 5 6 7 8 9 10PercentageofDementiacases
RxDx risk index deciles
Observed % Expectd %
* Likelihood-ratio Chi-square (df = 9) = 217.65;
P-value = <0.0001
 First study to combine diagnosis and prescription
information in a single summary risk index
 RxDx-Dementia Risk Index
 Control confounding in observational studies
 Prognostic tool
 Identify patients who are at high risk
 Interventions can be focused on modifiable risk factors for dementia
 Can be used in EMR as well as claims data
 Diagnosis and prescription data are available
 No issue of missing values
Discussion for RxDx-Dementia
46
Objectives
47
Aim 1
• Develop RxDx risk index to predict dementia in
patients with type 2 diabetes mellitus and
hypertension
Aim 2
• Compare RxDx score with Charlson comorbidity
index and Chronic disease score to predict
dementia
Aim 3
• To compare ACE versus ARB for the risk of
dementia in patients with type 2 diabetes
mellitus and hypertension
Aim 2: RxDX-Dementia Risk Index Performance
Model Risk Index C-Statistics (95% CI) NRI, % (P-value) IDI, % (P-value)
1 Baseline model (Age + Gender) 0.779 (0.773-0.786) 5.63 (<0.001) 1.93 (0.52)
RxDx-Dementia risk index
2 RxDx-Dementia risk index 0.806 (0.798-0.814)
Reference
(New Model)
Reference
(New Model)
3 RxDx risk index categorical* 0.807 (0.801-0.813) 0.21 (0.38) -0.06 (0.95)
Charlson comorbidity score (CCS)
4 Charlson original 0.782 (0.775-0.788) 6.47 (<0.001) 1.91 (0.52)
5 Charlson/Schneeweiss 0.782 (0.776-0.788) 6.50 (<0.001) 1.92 (0.52)
6 Charlson/Quan 0.781 (0.775-0.788) 5.63 (<0.001) 1.93 (0.52)
7 Charlson categorical† 0.783 (0.777-0.789) 6.13 (<0.001) 1.84 (0.53)
Chronic disease Score (CDS)
8 CDS original 0.789 (0.782-0.795) 5.90 (<0.001) 1.67 (0.56)
9 CDS/RxRisk – V 0.787 (0.779-0.794) 6.59 (<0.001) 1.80 (0.54)
10 CDS categorical‡ 0.805 (0.798-0.812) 0.86 (0.02) 0.09 (0.96)
Model Risk Index C-Statistics (95% CI) NRI, % (P-value) IDI, % (P-value)
RxDx-Dementia risk index
2 RxDx-Dementia risk index 0.806 (0.798-0.814) Reference Reference
3 RxDx risk index categorical* 0.807 (0.801-0.813) 0.21 (0.38) -0.06 (0.95)
Combined comorbidity score
(CCS+CDS)
12
Charlson original + CDS
original
0.789 (0.783-0.795) 5.88 (<0.001) 1.67 (0.56)
13
Charlson/Schneeweiss + CDS
original
0.789 (0.783-0.795) 5.94 (<0.001) 1.67 (0.56)
14 Charlson/Quan + CDS original 0.789 (0.782-0.796) 5.98 (<0.001) 1.68 (0.56)
15
Charlson original + CDS/RxRisk
– V
0.787 (0.781-0.793) 6.06 (<0.001) 1.79 (0.54)
16
Charlson/Schneeweiss + CDS/
RxRisk-V
0.787 (0.780-0.794) 6.11 (<0.001) 1.79 (0.54)
17
Charlson/Quan + CDS/RxRisk –
V
0.787 (0.781-0.793) 6.44 (<0.001) 1.80 (0.54)
Aim 2: RxDX-Dementia Risk Index Performance
 Performed superior
compared to CCS, CDS or
CCS + CDS
 Performance is superior or
comparable to existing
dementia-specific risk
indices
 Future studies
 RxDxClin-Risk Index
Risk Index C-Stat
RxDx – Dementia 0.81
Mid-life dementia risk 0.75
Late-life dementia risk index 0.81
Brief dementia risk index 0.77
Summary risk score for
Alzheimer’s disease
0.79
Late-life dementia risk index –
GE data
0.72
Diabetes-specific dementia
risk score (DSDRS)
0.75
Discussion for RxDX-Dementia
Performance
27Exalto, 2013; 28Barnes, 2009; 29Barnes, 2010; 30Reitz, 2010; 31Kivipelto, 2006; 32Mehta, 2012; 33Exalto, 2013 50
Objectives
51
Aim 1
• Develop RxDx risk index to predict dementia in
patients with type 2 diabetes mellitus and
hypertension
Aim 2
• Compare RxDx score with Charlson comorbidity
index and Chronic disease score to predict
dementia
Aim 3
• To compare ACE versus ARB for the risk of
dementia in patients with type 2 diabetes
mellitus and hypertension
Aim 3: Descriptive Statistics
52
Characteristics
Total*
n = 32,856; n (%)
ACE users
n = 28,562; n
(%)
ARB Users
n =3,943; n (%)
P-value
Age, mean (SD) 71.55 (7.86) 71.52 (7.88) 71.79 (7.77) 0.04
Age Categories
60-64 years 7,490 (22.80) 6,572 (23.01) 836 (21.20) 0.03
65-69 years 7,220 (21.97) 6,275 (21.97) 878 (22.27)
70-74 years 6,891 (20.97) 5,986 (20.96) 821 (20.82)
75-79 years 5,517 (16.79) 4,730 (16.56) 721 (18.29)
80-84 years 3,515 (10.70) 3,047 (10.67) 431 (10.93)
>85 years 2,223 (6.77) 1,952 (6.83) 256 (6.49)
Male, n (%) 17,600 (53.57) 15,642 (54.77) 1,810 (45.90) <0.0001
RxDx-Dementia risk
index
0.71 (3.74) 0.72 (3.75) 0.66 (3.67) 0.31
Aim 3: CER of ACEI and ARB
53
Treatment Risk Ratio
95% Confidence
Interval
ARB vs. ACEI
Unadjusted 0.86 0.73 – 1.01
Time-dependent Cox
regression
0.88 0.75 – 1.04
Marginal structural Cox
model
0.61 0.50 – 0.77
 Current study
 ARB offers 39% reduction in the risk of dementia
 Previous epidemiological studies
 Estimates ranged from 19% to 69%
 What is the true estimate?
 Prior studies showed MSM estimates ~ true estimates
 All prior studies
 Standard regression methods
 Shorter follow-up
 Time varying effect of blood pressure not considered
Discussion for CER of ARB versus ACEI
41Robins, 2000; 42Hernan, 2000; 43Delaney, 2009 54
Strengths | Limitations
55
- Created new RxDx-Dementia risk
index
- 10 years of longitudinal follow-up
- Causal effect of ACEI and ARB on
dementia (use of MSM)
- Cannot ascertain that
prescriptions are always filled or
taken by patients
- Missing data imputation
Conclusions
56
Conclusions
57
Aim 1
• Successfully developed and validated
RxDx-Dementia Risk Index
Aim 2
• RxDx-Dementia Risk Index
outperformed all other risk indices
Aim 3
• ARB may offer protective effect on the
risk of dementia compared to ACEI
 RxDx-Dementia Risk Index
 Prognosis of dementia
 Control of confounding
 Protective effect of ARB compared to ACEI
 Proper adjustment of time dependent confounding is important
in estimating causal effect
 Use of ARB will increase due to generics
 Losartan (2010); Irbesartan (2012)
 Delay the onset of dementia
 Reduce healthcare expenditure, improve patient quality of life and have
public health implications
Implications
58
59
60

PhD Dissertation Powerpoint

  • 1.
    Hemalkumar B. Mehta,MS PhD Candidate in Pharmaceutical Health Outcomes and Policy Comparative Effectiveness of ACEI and ARB for the Risk of Dementia in Elderly Patients with Diabetes and Hypertension 1
  • 2.
  • 3.
    Why elderly patientswith type 2 diabetes and hypertension? Why dementia outcome? Why compare ACEI and ARB? How to properly account for confounding? Introduction 3
  • 4.
    HypertensionType 2 Diabetes TwoMajor Public Health Problems 1 CDC, 2011; 2 Zhang, 2010; 3DIabetes Atlas, 2013; 4Wang, 2004; 5Yoon, 2012; 6Heidenreich, 2011 4 Prevalence • Adults: 60% • Elderly: 88% Cost • $131 billion (2010) • $389 billion (2030) Prevalence • All age: 8.3% • Elderly: 26.9% Cost • $198 billion (2010) • $264 billion (2030)
  • 5.
    1 + 1= 3 7Deedwania, 2005 5 HypertensionType 2 Diabetes Diabetes + Hypertension = “Deadly Duet”
  • 6.
    Elderly Patients with“Deadly Duet” Conditions are At High Risk of Dementia 8Plassman, 2007; 9Hendrie, 2007; 10Fillit, 2012; 11Cukierman, 2005 6 96% of dementia patients ≥65 years of age Diabetes patients are twice as likely to develop dementia Hypertension is an independent risk factor for dementia
  • 7.
    Burden of Dementia 12Alzheimer'sdisease facts and figures, 2013 7
  • 8.
    Treatment of Patientswith Type 2 Diabetes and Hypertension 13ADA, 2011 8 ADA Guideline “Should be with a regimen that includes either an ACEI or an ARB” ACEI: Captopril, enalapril, lisinopril, ramipril ARB: Losartan, valsartan, irbesartan, telmisartan
  • 9.
    ACEI, ARB andCognitive Function 14 9
  • 10.
     ONTARGET clinicaltrial  ARB (Telmisartan) vs. ACE (Ramipril) - Secondary endpoints  Cognitive impairment: OR = 0.90 (95%CI: 0.80-1.01)  Epidemiological Studies ACEI, ARB and the Risk of Dementia 15 Anderson, 2011; 16 Johnson, 2012; 17Li, 2010; 18 Davies, 2012; 19Yasar, 2013 10 Study Drug treatment HR, 95% CI Johnson et al., 2012 ARB versus non-users 0.78 (0.71–0.85) Li et al., 2010 ARB versus Lisinopril 0.81 (0.68-0.96) Davies et al., 2011 ARB versus other antihypertensive ACEI versus other antihypertensive 0.47 (0.37-0.58) 0.76 (0.69-0.84) Yasar et al., 2013 ARB versus none ACEI versus none ARB versus ACEI 0.31 (0.14-0.68) 0.50 (0.29-0.83) 0.62 (0.27-1.40)
  • 11.
     Baby boomers By 2050, 88.5 million older Americans (20.2%) of total population  ↑ Incidence of type 2 diabetes and hypertension  Greater risk for dementia  Treatment that can delay dementia onset by few years  Major public health implication  Blood Pressure – time varying confounder affected by previous treatment history  Prior studies did not properly account for it Significance: CER of ACEI and ARB 11
  • 12.
    CER of ACEIversus ARB for the Risk of Dementia 12 ACEI ARB
  • 13.
  • 14.
  • 15.
    1. Categorical variablesfor comorbidities 2. Charlson comorbidity score (CCS) – 1987  Diagnosis based score – 17 diseases  Adaptation in administrative claims data – ICD-9-CM algorithms 3. Chronic disease score (CDS) – 1995  Rx based score – 29 disease categories  Drugs and drug classes - American Hospital Formulary system How to Control for Confounding? 20Charlson, 1987; 21Clark, 1995; 22Austin, 2013 15
  • 16.
    Including CCS andCDS Improves Confounding Control 16 ACEI ARB CCS CDS
  • 17.
    Including CCS andCDS improves Confounding Control 23Schneeweiss, 2001; 24Mehta, 2013; 25Mehta, 2013; 26Mcgregor, 2006 17
  • 18.
    Including CCS andCDS improves Confounding Control 18
  • 19.
    Including CCS andCDS improves Confounding Control 19
  • 20.
    Including CCS andCDS improves Confounding Control 20
  • 21.
    Including CCS andCDS improves Confounding Control 21
  • 22.
    Issues with ExistingDementia Specific Risk Indices 27Exalto, 2013; 28Barnes, 2009; 29Barnes, 2010; 30Reitz, 2010; 31Kivipelto, 2006; 32Mehta, 2012; 33Exalto, 2013 22 Issues Use of genetic, MRI or MMSE information Use of lab values – How to deal with missing values No index included Rx medications as risk factors Why two separate indices based on Diagnosis and Prescription drug use Dementia Risk Index Mid-life dementia risk Late-life dementia risk index Brief dementia risk index Summary risk score for Alzheimer’s disease Late-life dementia risk index – GE data Diabetes-specific dementia risk score (DSDRS)
  • 23.
     Why toinclude two separate variables in the model?  Charlson comorbidity score  Chronic disease score  Why not combine two informations in a single summary score? RxDx risk index  Conditions will be identified from Bright !dea 23 Rx Dx
  • 24.
     First studyto combine diagnosis and prescription drug information in one risk index  Easily applicable to claims and EMR data  Diagnosis  Prescription  New tool for confounding control  Useful for identifying patients at risk  Steps can be taken to target modifiable risk factors for dementia Significance: RxDx Risk Index 24
  • 25.
  • 26.
    Objectives 26 Aim 1 • DevelopRxDx risk index to predict dementia in patients with type 2 diabetes mellitus and hypertension Aim 2 • Compare RxDx risk index with Charlson comorbidity index and Chronic disease score to predict dementia Aim 3 • To compare ACE versus ARB for the risk of dementia in patients with type 2 diabetes mellitus and hypertension
  • 27.
  • 28.
     Electronic medicalrecord data, United Kingdom (UK)  Information entered by general practitioner (GPs)  12 million patients - 593 general practices  Anonymized longitudinal clinical and prescribing information  Clinical diagnoses are recorded using medcodes  High validity (Median = 89%)  Prescription information is well documented  Computerized system generates each prescription  Clinically Rich  >450 lab measures Clinical Practice Research Data 34 Williams, 2012; 35Lewis, 2002 28
  • 29.
     Elderly (age≥ 60 years)  Diagnosed with type 2 diabetes  Diagnosis or (abnormal lab value + oral hypoglycemic agent)  Diagnosed with hypertension  Diagnosis or (abnormal lab value + antihypertensive agent)  Prevalent dementia cases were excluded Study Cohort 29
  • 30.
     Covariates  Age Gender  Risk indices  Lab measures  Blood pressure  HbA1c  Body mass index (BMI)  Smoking status  Alcohol consumption  Albumin  Serum creatinine  Platelets count  Pottasium  Total white blood cell count  Cholesterol, HDL and LDL  Exposure  ACEI / ARB Variables 30  Outcome  Time to dementia
  • 31.
     29 diseasecategories based on Rx drug use  Developed algorithm to map CDS to multiples Rx coding system  Two sets of weights Chronic disease score  17 disease categories  The CCS has been adapted to CPRD data medcodes system  Three sets of weights Charlson comorbidity index Risk Indices 20Charlson, 1987; 36Schneeweiss, 2003; 37Quan, 201; 21Clark, 1995; 38Johnson, 2006 31
  • 32.
     29 diseasecategories based on Rx drug use  Developed algorithm to map CDS to multiples Rx coding system  Two sets of weights Chronic disease score  17 disease categories  The CCS has been adapted to CPRD data medcodes system  Three sets of weights Charlson comorbidity index Risk Indices 32
  • 33.
     29 diseasecategories based on Rx drug use  Developed algorithm to map CDS to multiples Rx coding system  Two sets of weights Chronic disease score  17 disease categories  The CCS has been adapted to CPRD data medcodes system  Three sets of weights Charlson comorbidity index Risk Indices 33
  • 34.
     RxDx riskindex – 31 disease conditions  Few disease conditions were merged  CDS: Pain/Inflammation and Pain are separate conditions  Not possible to identify separately using diagnosis  CCS: Renal disease and ESRD  Not possible to identify using Rx drugs RxDx-Dementia Risk Index 34 Rx Dx
  • 35.
    Statistical Analysis –Aim 1 35 Jan 1, 2003 Index date One year prior Jan 1, 2002 Dec 31, 2012 Baseline year to construct risk index Index date: Date when patient was diagnosed with type 2 diabetes mellitus and hypertension
  • 36.
     Cox proportionalhazards regression  Dependent variable – Time to dementia  Independent variables  Age and gender  RxDx disease conditions  Censoring – discontinue, died, combination, end of study  Weights were assigned based on beta coefficient  Rule: Beta * 10  round it to the nearest integer  Discrimination: c-statistics  Validation: 10 cross-fold validation  Calibration: Hosmer-Lemeshow calibration Statistical Analysis – Aim 1 39Harrell, 2001 36
  • 37.
     Discrimination  C-statistics(0.7-0.8 = acceptable; 0.8-0.9 = excellent)  Net reclassification index (NRI)  Assesses risk reclassification and is the sum of improvement in cases and in controls  Positive NRI indicates “new” model is better compared to “old”  Integrated discrimination index (IDI)  Difference in discrimination slopes between two models  Positive IDI indicates “new” model is better compared to “old” Statistical Analysis – Aim 2 39Harrell, 2001; 40Cook, 2009 37
  • 38.
    Statistical Analysis –Aim 3 38 Jan 1, 2003 Index date One year prior Jan 1, 2002 Dec 31, 2012 Baseline year to construct covariates Index date: Date when patient started taking ACEI or ARB New users study design
  • 39.
     Descriptive Statistics Multivariable time-dependent Cox model  Dependent variable – Time to dementia  Independent variables  Drug exposure (quarterly)  Demographics, comorbidities and clinical measures  Censoring – discontinue, died, combination, end of study Statistical Analysis – Aim 3 39
  • 40.
     Marginal StructuralModel (MSM)  Blood Pressure (BP) - time dependent confounder affected by previous treatment history  Time dependent Cox model – biased estimate  MSM – unbiased estimate – IPTW estimator Statistical Analysis – Aim 3 41Robins, 2000; 42Hernan, 2000; 43Delaney, 2009; 44Gerhard, 2012 40 BPt0 BPt1 Et0 Et1 Fixed confounders
  • 41.
  • 42.
    Objectives 42 Aim 1 • DevelopRxDx risk index to predict dementia in patients with type 2 diabetes mellitus and hypertension Aim 2 • Compare RxDx score with Charlson comorbidity index and Chronic disease score to predict dementia Aim 3 • To compare ACE versus ARB for the risk of dementia in patients with type 2 diabetes mellitus and hypertension
  • 43.
     Cohort included133,176 patients  Means age = 72.12 years (SD =8.04)  52% of patients were male  Incidence of dementia = 3.42% Aim 1: Descriptive Statistics 43 Disease categories identified using diagnosis n, (%) Disease categories identified using prescription drug use (n, %) Disease categories identified using diagnosis or prescription drug use (n, %) Chronic pulmonary disease 3,501 (2.63) 27,154 (20.39) 27,583 (20.71) Rheumatologic disease 1,443 (1.08) 13,154 (9.88) 13,426 (10.08) Peptic ulcer disease 332 (0.25) 42,474 (31.89) 42,521 (31.93)
  • 44.
    Aim 1 -Deriving Points for RxDX Conditions 44 Beta Estimates (p-value) Hazard Ratio (95% CI) Points Myocardial infarction -0.16 (0.21) 0.85 (0.65-1.10) -2 Congestive heart failure -0.07 (0.02) 0.93 (0.87-0.99) -1 Coronary and peripheral vascular disease 0.15 (<0.001) 1.16 (1.07-1.26) 1 Cerebrovascular disease 0.36 (<0.001) 1.43 (1.23-1.67) 4 Epilepsy 0.33 (<0.001) 1.39 (1.22-1.58) 3 Hyperlipidemia 0.11 (<0.001) 1.11 (1.05-1.19) 1 Parkinson’s disease 0.78 (<0.001) 2.19 (1.81-2.64) 8 Depression 0.61 (<0.001) 1.84 (1.71-1.97) 6 Psychotic illness 0.63 (<0.001) 1.88 (1.71-2.06) 6
  • 45.
    CalibrationCross - Validation Aim1: Cross-Validation | Calibration 45 RxDx-Dementia Risk Index C-statistics 0.806 (0.798 – 0.814) Ten-fold cross-validation C-statistics 0.806 (0.800 – 0.813) 1 2 3 4 5 6 7 8 9 10PercentageofDementiacases RxDx risk index deciles Observed % Expectd % * Likelihood-ratio Chi-square (df = 9) = 217.65; P-value = <0.0001
  • 46.
     First studyto combine diagnosis and prescription information in a single summary risk index  RxDx-Dementia Risk Index  Control confounding in observational studies  Prognostic tool  Identify patients who are at high risk  Interventions can be focused on modifiable risk factors for dementia  Can be used in EMR as well as claims data  Diagnosis and prescription data are available  No issue of missing values Discussion for RxDx-Dementia 46
  • 47.
    Objectives 47 Aim 1 • DevelopRxDx risk index to predict dementia in patients with type 2 diabetes mellitus and hypertension Aim 2 • Compare RxDx score with Charlson comorbidity index and Chronic disease score to predict dementia Aim 3 • To compare ACE versus ARB for the risk of dementia in patients with type 2 diabetes mellitus and hypertension
  • 48.
    Aim 2: RxDX-DementiaRisk Index Performance Model Risk Index C-Statistics (95% CI) NRI, % (P-value) IDI, % (P-value) 1 Baseline model (Age + Gender) 0.779 (0.773-0.786) 5.63 (<0.001) 1.93 (0.52) RxDx-Dementia risk index 2 RxDx-Dementia risk index 0.806 (0.798-0.814) Reference (New Model) Reference (New Model) 3 RxDx risk index categorical* 0.807 (0.801-0.813) 0.21 (0.38) -0.06 (0.95) Charlson comorbidity score (CCS) 4 Charlson original 0.782 (0.775-0.788) 6.47 (<0.001) 1.91 (0.52) 5 Charlson/Schneeweiss 0.782 (0.776-0.788) 6.50 (<0.001) 1.92 (0.52) 6 Charlson/Quan 0.781 (0.775-0.788) 5.63 (<0.001) 1.93 (0.52) 7 Charlson categorical† 0.783 (0.777-0.789) 6.13 (<0.001) 1.84 (0.53) Chronic disease Score (CDS) 8 CDS original 0.789 (0.782-0.795) 5.90 (<0.001) 1.67 (0.56) 9 CDS/RxRisk – V 0.787 (0.779-0.794) 6.59 (<0.001) 1.80 (0.54) 10 CDS categorical‡ 0.805 (0.798-0.812) 0.86 (0.02) 0.09 (0.96)
  • 49.
    Model Risk IndexC-Statistics (95% CI) NRI, % (P-value) IDI, % (P-value) RxDx-Dementia risk index 2 RxDx-Dementia risk index 0.806 (0.798-0.814) Reference Reference 3 RxDx risk index categorical* 0.807 (0.801-0.813) 0.21 (0.38) -0.06 (0.95) Combined comorbidity score (CCS+CDS) 12 Charlson original + CDS original 0.789 (0.783-0.795) 5.88 (<0.001) 1.67 (0.56) 13 Charlson/Schneeweiss + CDS original 0.789 (0.783-0.795) 5.94 (<0.001) 1.67 (0.56) 14 Charlson/Quan + CDS original 0.789 (0.782-0.796) 5.98 (<0.001) 1.68 (0.56) 15 Charlson original + CDS/RxRisk – V 0.787 (0.781-0.793) 6.06 (<0.001) 1.79 (0.54) 16 Charlson/Schneeweiss + CDS/ RxRisk-V 0.787 (0.780-0.794) 6.11 (<0.001) 1.79 (0.54) 17 Charlson/Quan + CDS/RxRisk – V 0.787 (0.781-0.793) 6.44 (<0.001) 1.80 (0.54) Aim 2: RxDX-Dementia Risk Index Performance
  • 50.
     Performed superior comparedto CCS, CDS or CCS + CDS  Performance is superior or comparable to existing dementia-specific risk indices  Future studies  RxDxClin-Risk Index Risk Index C-Stat RxDx – Dementia 0.81 Mid-life dementia risk 0.75 Late-life dementia risk index 0.81 Brief dementia risk index 0.77 Summary risk score for Alzheimer’s disease 0.79 Late-life dementia risk index – GE data 0.72 Diabetes-specific dementia risk score (DSDRS) 0.75 Discussion for RxDX-Dementia Performance 27Exalto, 2013; 28Barnes, 2009; 29Barnes, 2010; 30Reitz, 2010; 31Kivipelto, 2006; 32Mehta, 2012; 33Exalto, 2013 50
  • 51.
    Objectives 51 Aim 1 • DevelopRxDx risk index to predict dementia in patients with type 2 diabetes mellitus and hypertension Aim 2 • Compare RxDx score with Charlson comorbidity index and Chronic disease score to predict dementia Aim 3 • To compare ACE versus ARB for the risk of dementia in patients with type 2 diabetes mellitus and hypertension
  • 52.
    Aim 3: DescriptiveStatistics 52 Characteristics Total* n = 32,856; n (%) ACE users n = 28,562; n (%) ARB Users n =3,943; n (%) P-value Age, mean (SD) 71.55 (7.86) 71.52 (7.88) 71.79 (7.77) 0.04 Age Categories 60-64 years 7,490 (22.80) 6,572 (23.01) 836 (21.20) 0.03 65-69 years 7,220 (21.97) 6,275 (21.97) 878 (22.27) 70-74 years 6,891 (20.97) 5,986 (20.96) 821 (20.82) 75-79 years 5,517 (16.79) 4,730 (16.56) 721 (18.29) 80-84 years 3,515 (10.70) 3,047 (10.67) 431 (10.93) >85 years 2,223 (6.77) 1,952 (6.83) 256 (6.49) Male, n (%) 17,600 (53.57) 15,642 (54.77) 1,810 (45.90) <0.0001 RxDx-Dementia risk index 0.71 (3.74) 0.72 (3.75) 0.66 (3.67) 0.31
  • 53.
    Aim 3: CERof ACEI and ARB 53 Treatment Risk Ratio 95% Confidence Interval ARB vs. ACEI Unadjusted 0.86 0.73 – 1.01 Time-dependent Cox regression 0.88 0.75 – 1.04 Marginal structural Cox model 0.61 0.50 – 0.77
  • 54.
     Current study ARB offers 39% reduction in the risk of dementia  Previous epidemiological studies  Estimates ranged from 19% to 69%  What is the true estimate?  Prior studies showed MSM estimates ~ true estimates  All prior studies  Standard regression methods  Shorter follow-up  Time varying effect of blood pressure not considered Discussion for CER of ARB versus ACEI 41Robins, 2000; 42Hernan, 2000; 43Delaney, 2009 54
  • 55.
    Strengths | Limitations 55 -Created new RxDx-Dementia risk index - 10 years of longitudinal follow-up - Causal effect of ACEI and ARB on dementia (use of MSM) - Cannot ascertain that prescriptions are always filled or taken by patients - Missing data imputation
  • 56.
  • 57.
    Conclusions 57 Aim 1 • Successfullydeveloped and validated RxDx-Dementia Risk Index Aim 2 • RxDx-Dementia Risk Index outperformed all other risk indices Aim 3 • ARB may offer protective effect on the risk of dementia compared to ACEI
  • 58.
     RxDx-Dementia RiskIndex  Prognosis of dementia  Control of confounding  Protective effect of ARB compared to ACEI  Proper adjustment of time dependent confounding is important in estimating causal effect  Use of ARB will increase due to generics  Losartan (2010); Irbesartan (2012)  Delay the onset of dementia  Reduce healthcare expenditure, improve patient quality of life and have public health implications Implications 58
  • 59.
  • 60.