Downloaded 94 times


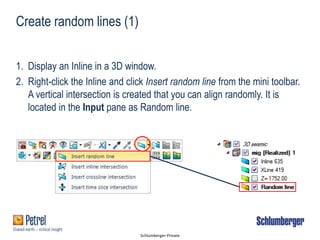
![Schlumberger-Private
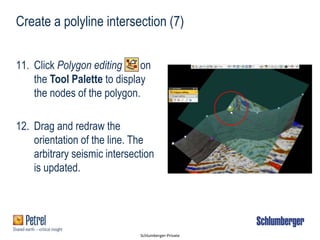
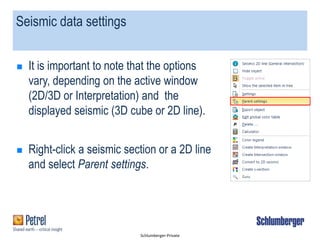
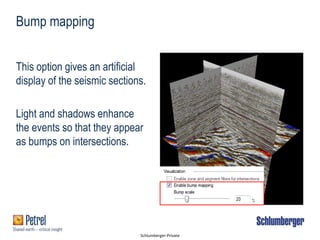
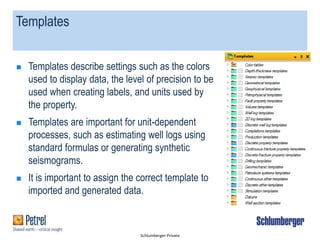
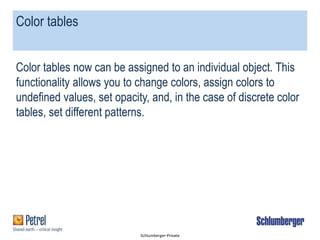
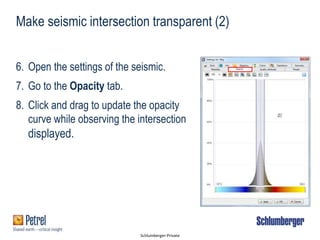
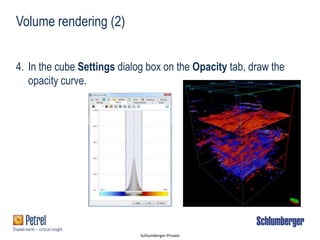
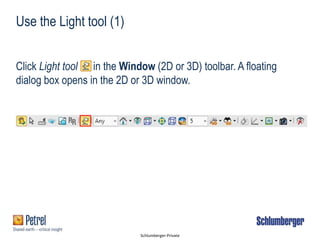
1. On the Window toolbar, click Track this cursor . To see the
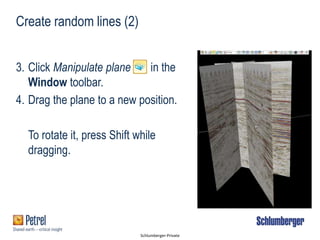
cursor position in all windows, change to Select [P] mode.
You also can select Track all cursors to track cursors in all
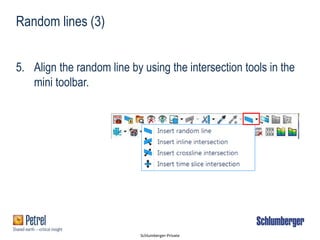
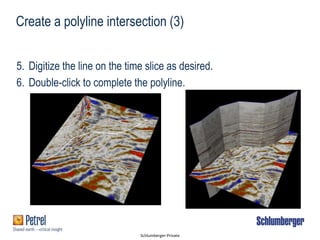
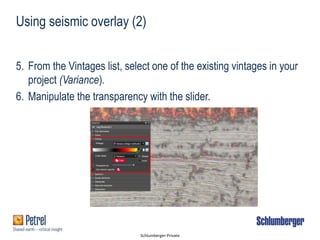
windows.
2. To deactivate cursor tracking, click Don’t track any cursors.
Cursor tracking](https://image.slidesharecdn.com/f3seismicintersectionsanddatamanipulation2018v1-190829113411/85/Petrel-F-3-seismic-intersections-and-data-manipulation-2018-v1-1-24-320.jpg)
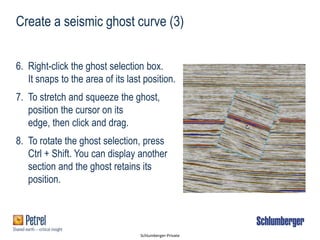
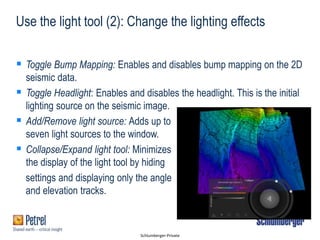
![Schlumberger-Private
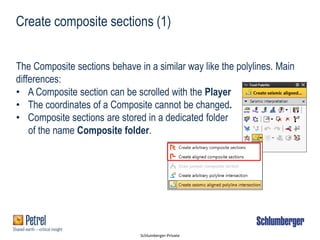
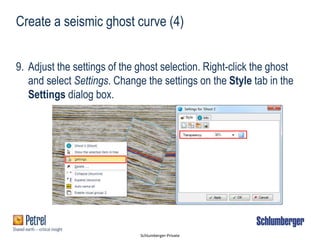
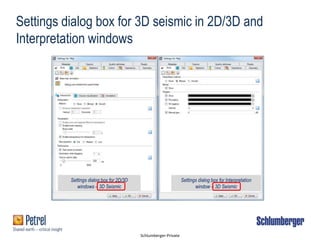
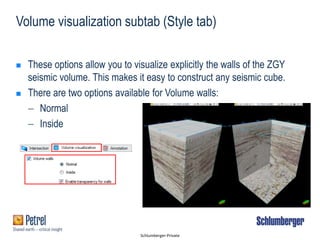
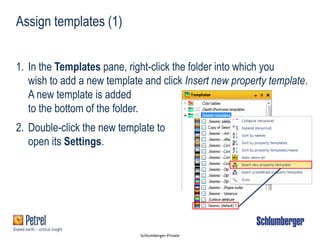
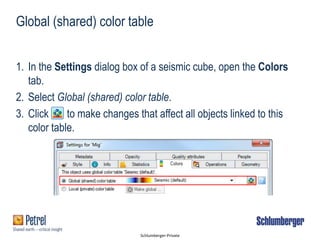
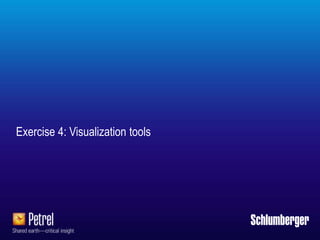
1. In an Interpretation window, display a seismic section.
2. From the Quick Access toolbar, click Inspector .
3. Change to Select [P] mode in the Window toolbar and click the
seismic section.
4. Expand the Overlay subtab.
5. Select the Vintage check box.
Using seismic overlay (1)](https://image.slidesharecdn.com/f3seismicintersectionsanddatamanipulation2018v1-190829113411/85/Petrel-F-3-seismic-intersections-and-data-manipulation-2018-v1-1-34-320.jpg)
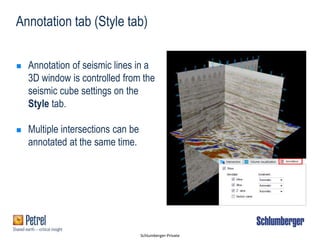
![Schlumberger-Private
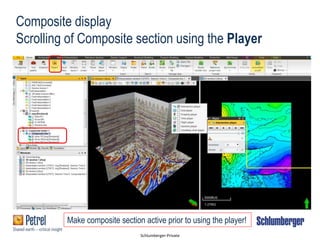
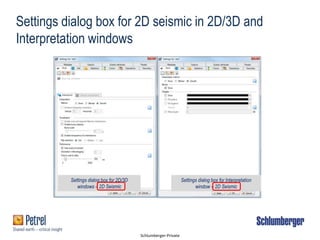
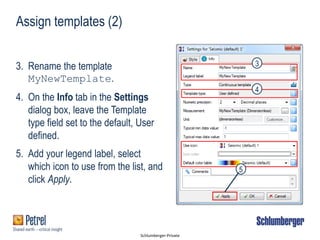
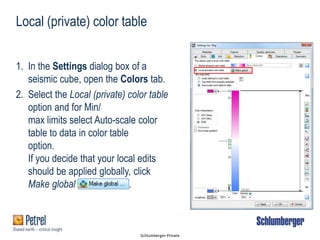
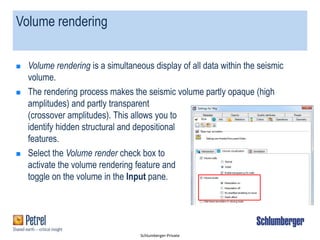
Make seismic intersection transparent (1)
1. In the Quick Access toolbar, click Inspector .
2. Change to Select [P] mode in the Window toolbar and click the seismic
to populate the Inspector.
3. Expand the Color subtab
4. Select the checkbox next to Transparency.
5. Move the slider to change the opacity of
the intersections.](https://image.slidesharecdn.com/f3seismicintersectionsanddatamanipulation2018v1-190829113411/85/Petrel-F-3-seismic-intersections-and-data-manipulation-2018-v1-1-56-320.jpg)

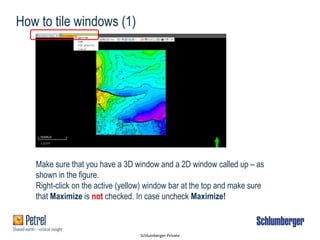
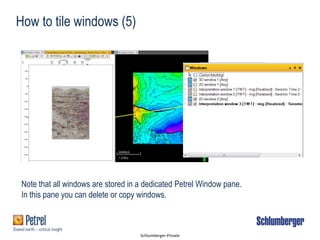
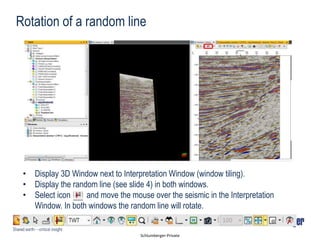
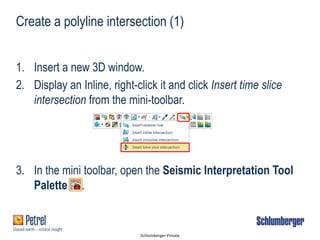
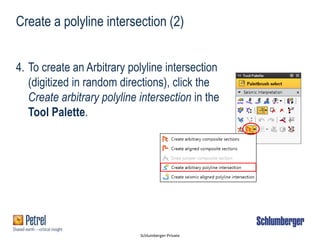
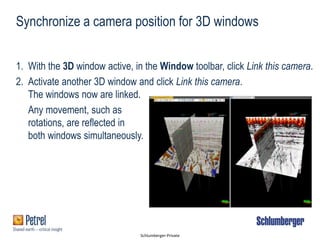
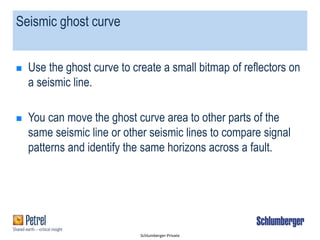
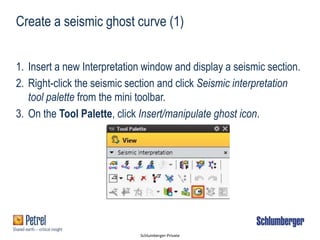
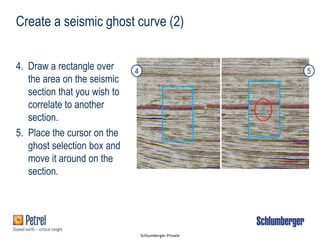
The document discusses various techniques for visualizing and manipulating seismic data in Petrel, including: - Inserting random lines and polyline intersections to create arbitrary seismic intersections - Tiling windows and linking cameras between windows to synchronize views - Using ghost curves to compare seismic signal patterns across faults - Overlaying seismic attributes and vintages to aid interpretation - Adjusting settings like transparency and annotation to control seismic data display - Browsing and managing seismic surveys using the Survey manager tool.


