Perhitungan Variogram, Histogram, Gaussian Model, Isotropic Variogram dan Anisotropic Variogram
•
2 likes•1,188 views

Perhitungan Variogram, Histogram, Gaussian Model, Isotropic Variogram dan Anisotropic Variogram Untuk Gaussian Model masih perlu dikembangkan lagi karena fungsi tersebut masih terdapat kesalahan.

Recommended
More Related Content
What's hot
What's hot (20)
Similar to Perhitungan Variogram, Histogram, Gaussian Model, Isotropic Variogram dan Anisotropic Variogram
Similar to Perhitungan Variogram, Histogram, Gaussian Model, Isotropic Variogram dan Anisotropic Variogram (20)
More from National Cheng Kung University
More from National Cheng Kung University (20)
Recently uploaded
Recently uploaded (20)
Perhitungan Variogram, Histogram, Gaussian Model, Isotropic Variogram dan Anisotropic Variogram
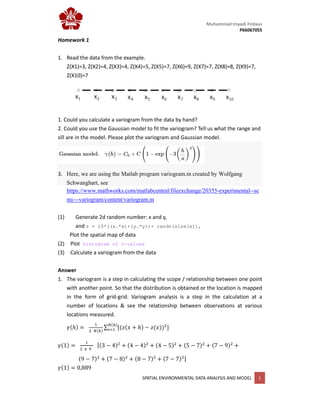
- 1. Muhammad Irsyadi Firdaus P66067055 SPATIAL ENVIRONMENTAL DATA ANALYSIS AND MODEL 1 Homework 1 1. Read the data from the example. Z(X1)=3, Z(X2)=4, Z(X3)=4, Z(X4)=5, Z(X5)=7, Z(X6)=9, Z(X7)=7, Z(X8)=8, Z(X9)=7, Z(X10)=7 1. Could you calculate a variogram from the data by hand? 2. Could you use the Gaussian model to fit the variogram? Tell us what the range and sill are in the model. Please plot the variogram and Gaussian model. 3. Here, we are using the Matlab program variogram.m created by Wolfgang Schwanghart, see https://www.mathworks.com/matlabcentral/fileexchange/20355-experimental--se mi---variogram/content/variogram.m (1) Generate 2d random number: x and y, and z = 10*((x.*x)+(y.*y))+ randn(size(x)), Plot the spatial map of data (2) Plot histogram of z-values (3) Calculate a variogram from the data Answer 1. The variogram is a step in calculating the scope / relationship between one point with another point. So that the distribution is obtained or the location is mapped in the form of grid‐grid. Variogram analysis is a step in the calculation at a number of locations & see the relationship between observations at various locations measured. ∑ 1 3 4 4 4 4 5 5 7 7 9 9 7 7 8 8 7 7 7 1 0,889
- 2. Muhammad Irsyadi Firdaus P66067055 SPATIAL ENVIRONMENTAL DATA ANALYSIS AND MODEL 2 2 3 4 4 5 4 7 5 9 7 7 9 8 7 7 8 7 2 1,8125 3 3 5 4 7 4 9 5 7 7 8 9 7 7 7 3 3,3571 4 3 7 4 9 4 7 5 8 7 7 9 7 4 5,25 5 3 9 4 7 4 8 5 7 7 7 5 6,5 6 3 7 4 8 4 7 5 7 6 5,625 7 3 8 4 7 4 7 7 7,167 8 3 7 4 7 8 6,25 9 3 7 9 8
- 3. Muhammad Irsyadi Firdaus P66067055 SPATIAL ENVIRONMENTAL DATA ANALYSIS AND MODEL 3 2. Gaussian Model The Gaussian model, with its parabolic behavior at the origin, represents very smoothly varying properties. (However, using the Gaussian model alone without a nugget effect can lead to numerical instabilities in the kriging process.) 1 exp 3 Function in MATLAB 0 1 2 3 4 5 6 7 8 9 3 4 4 5 7 9 7 8 7 V(h) h (m) Variogram
- 4. Muhammad Irsyadi Firdaus P66067055 SPATIAL ENVIRONMENTAL DATA ANALYSIS AND MODEL 4 3. The Matlab program variogram (1) Plot the spatial map of data
- 5. Muhammad Irsyadi Firdaus P66067055 SPATIAL ENVIRONMENTAL DATA ANALYSIS AND MODEL 5 (2) Plot histogram of z‐values (3) Calculate a variogram from the data Function in MATLAB