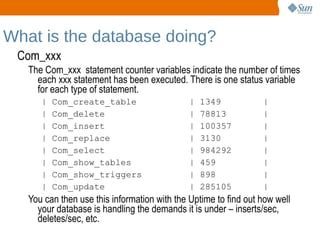
Performance Tuning the MySQL Server Ligaya Turmelle MySQL Support Engineer [email_address]
MySQL is the world's most popular open source database software, with over 100 million copies of its software downloaded or distributed throughout its history.
a key part of LAMP (Linux, Apache, MySQL, PHP / Perl / Python), the fast-growing open source enterprise software stack.
Site:  http://www.mysql.com/
Download: http://dev.mysql.com/downloads/
Online Manual: http://dev.mysql.com/doc/refman/5.1/en/index.html MySQL
Before Before you start tweaking the server: Your single biggest gain in server performance will be from optimizing your queries EXPLAIN
Indexes strategies
Database design Optimize the underlying server systems OS
File system
Network
Storage
How MySQL uses memory MySQL uses memory in 2 ways  – Global buffers and per connection buffers.
Generally speaking global memory is allocated once when the server starts *
Per connection memory allocations are for each connection - generally speaking on an “as needed” basis. These buffers should be “small” Global memory + (max_connections * session buffers)
* some of the Global buffers grow to their size like the table and thread caches
Where to get information mysql> SHOW GLOBAL VARIABLES; This command will show us what the current settings of the server are.
+---------------------------------+-----------------------------------------------------------------------------------------------+
| Variable_name  | Value  |
+---------------------------------+-----------------------------------------------------------------------------------------------+
| auto_increment_increment  | 1  |
| auto_increment_offset  | 1  |
| automatic_sp_privileges  | ON  |
| back_log  | 50  |
| basedir  | /Users/ligaya/mysql_installs/mysql-enterprise-gpl-5.0.50sp1-osx10.5-x86/  |
| binlog_cache_size  | 32768  |
| bulk_insert_buffer_size  | 8388608  |
| character_set_client  | latin1
....
Where to get information (con't) my.cnf file This file can also contain information not found in the global variables Server information How much RAM on the machine?
Is the machine dedicated to MySQL?
64 bit processor?
64 bit MySQL server binary?
Where to get information (con't) mysql> SHOW GLOBAL STATUS; This command will give you information on what the server has been doing.

Performance Tuning

  • 1.
    Performance Tuning theMySQL Server Ligaya Turmelle MySQL Support Engineer [email_address]
  • 2.
    MySQL is theworld's most popular open source database software, with over 100 million copies of its software downloaded or distributed throughout its history.
  • 3.
    a key partof LAMP (Linux, Apache, MySQL, PHP / Perl / Python), the fast-growing open source enterprise software stack.
  • 4.
  • 5.
  • 6.
  • 7.
    Before Before youstart tweaking the server: Your single biggest gain in server performance will be from optimizing your queries EXPLAIN
  • 8.
  • 9.
    Database design Optimizethe underlying server systems OS
  • 10.
  • 11.
  • 12.
  • 13.
    How MySQL usesmemory MySQL uses memory in 2 ways – Global buffers and per connection buffers.
  • 14.
    Generally speaking globalmemory is allocated once when the server starts *
  • 15.
    Per connection memoryallocations are for each connection - generally speaking on an “as needed” basis. These buffers should be “small” Global memory + (max_connections * session buffers)
  • 16.
    * some ofthe Global buffers grow to their size like the table and thread caches
  • 17.
    Where to getinformation mysql> SHOW GLOBAL VARIABLES; This command will show us what the current settings of the server are.
  • 18.
  • 19.
  • 20.
  • 21.
  • 22.
  • 23.
  • 24.
  • 25.
    | basedir | /Users/ligaya/mysql_installs/mysql-enterprise-gpl-5.0.50sp1-osx10.5-x86/ |
  • 26.
  • 27.
  • 28.
  • 29.
  • 30.
    Where to getinformation (con't) my.cnf file This file can also contain information not found in the global variables Server information How much RAM on the machine?
  • 31.
    Is the machinededicated to MySQL?
  • 32.
  • 33.
    64 bit MySQLserver binary?
  • 34.
    Where to getinformation (con't) mysql> SHOW GLOBAL STATUS; This command will give you information on what the server has been doing.
  • 35.
    You will wantto issue this command twice with some time in between so you can see the change in the information over time mysql> SHOW GLOBAL STATUS;
  • 36.
  • 37.
    mysql> SHOW GLOBALSTATUS; Sample Output:
  • 38.
    Where to getinformation (con't) +-----------------------------------+-------------+ | Variable_name | Value | +-----------------------------------+-------------+ | Aborted_clients | 6618 | | Aborted_connects | 3957 | | Binlog_cache_disk_use | 0 | | Binlog_cache_use | 0 | | Bytes_received | 1320510015 | | Bytes_sent | 2978960756 | | Com_admin_commands | 32124 | .... | Threads_cached | 0 | | Threads_connected | 1 | | Threads_created | 316771 | | Threads_running | 1 | | Uptime | 1722523 | | Uptime_since_flush_status | 1722523 | +-----------------------------------+-------------+
  • 39.
    Where to getinformation (con't) Uptime This information is taken from the status information and is given in number of seconds. Ex: 1086122 seconds = ~19.9 days = 478.5 hrs This helps you calculate the values in a given time frame and since we have 2 Global status outputs we can see what the change in the values are for a given time under specific circumstances (high load, low load). Ex: (bytes received[2] – bytes received[1])/ (Uptime[2] – Uptime[1])
  • 40.
    (1320582719 - 1320510015)/(1722729 - 1722523) =
  • 41.
    72704 bytes/ 206sec = 352.9 bytes/sec
  • 42.
    What is thedatabase doing? Com_xxx The Com_xxx statement counter variables indicate the number of times each xxx statement has been executed. There is one status variable for each type of statement. | Com_create_table | 1349 |
  • 43.
    | Com_delete | 78813 |
  • 44.
    | Com_insert | 100357 |
  • 45.
  • 46.
    | Com_select | 984292 |
  • 47.
  • 48.
  • 49.
    | Com_update | 285105 | You can then use this information with the Uptime to find out how well your database is handling the demands it is under – inserts/sec, deletes/sec, etc.
  • 50.
    What is thedatabase doing? (con't) Handler_* These are various internal counters. The ones below indicate how well the indexes on your queries are working. Handler_read_first: number of times the first entry was read from an index.
  • 51.
    value is high,it suggests that the server is doing a lot of full index scans . Handler_read_key: number of requests to read a row based on a key.
  • 52.
    value is high,it is a good indication that your tables are properly indexed for your queries. Handler_read_next: number of requests to read the next row in key order.
  • 53.
    value is incrementedif you are querying an index column with a range constraint or if you are doing an index scan .
  • 54.
    What is thedatabase doing? (con't) Handler_* (con't) Handler_read_prev: number of requests to read the previous row in key order.
  • 55.
    mainly used to optimize ORDER BY ... DESC . Handler_read_rnd: number of requests to read a row based on a fixed position.
  • 56.
    value is highif you are doing a lot of queries that require sorting of the result .
  • 57.
    probably have alot of queries that require MySQL to scan entire tables or you have joins that don't use keys properly. Handler_read_rnd_next: number of requests to read the next row in the data file.
  • 58.
    value is highif you are doing a lot of table scans.
  • 59.
    suggests that your tables are not properly indexed or your queries are not written to take advantage of the indexes you have.
  • 60.
    What is thedatabase doing? (con't) Innodb_* This has various information on how the InnoDB tablespace is doing.
  • 61.
    Some of theinformation available: Innodb_buffer_pool_pages_data: number of pages containing data (dirty or clean). Innodb_buffer_pool_pages_free: number of free pages. Innodb_buffer_pool_pages_total: The total size of the buffer pool, in pages.
  • 62.
    What is thedatabase doing? (con't) Key_* This provides you with information on how your key buffer is doing. (MyISAM) Key_blocks_unused: number of unused blocks in the key cache.
  • 63.
    use this valueto determine how much of the key cache is in use Key_blocks_used: number of used blocks in the key cache.
  • 64.
    a high-water markthat indicates the maximum number of blocks that have ever been in use at one time.
  • 65.
    What is thedatabase doing? (con't) Key_* This provides you with information on how your key buffer is doing. (MyISAM) (con't) Key_read_requests: number of requests to read a key block from the cache.
  • 66.
    a cache hitKey_reads: number of physical reads of a key block from disk.
  • 67.
  • 68.
    If large, thenyour key_buffer_size value is probably too small . cache miss rate = Key_reads/Key_read_requests.
  • 69.
    Key buffer efficiency : 1 – cache miss rate
  • 70.
    What is thedatabase doing? (con't) Qcache_* These counters provide you with information on how the query cache is doing. Qcache_free_blocks: number of free memory blocks
  • 71.
    Qcache_hits: numberof query cache hits.
  • 72.
    Qcache_inserts: numberof queries added to the query cache.
  • 73.
    Qcache_lowmem_prunes: numberof queries that were deleted from the query cache because of low memory.
  • 74.
    Qcache_not_cached: numberof non-cached queries (not cacheable, or not cached due to the query_cache_type setting).
  • 75.
    Qcache_queries_in_cache: numberof queries registered in the query cache.
  • 76.
    Qcache_total_blocks: totalnumber of blocks in the query cache.
  • 77.
    What is thedatabase doing? (con't) Qcache_* One quick and easy way to determine if you benefit from using the query cache – Query Cache Hit Rate QC Hit Rate = Qcache_hits/(Qcache_hits+Com_select) Also check to see how often you are invalidating the queries in the cache. Qcache_inserts vs Com_select Want Qcache_inserts << Com_select - bigger the difference, the better Note: keep in mind warming up the cache
  • 78.
    What is thedatabase doing? (con't) Just a few general information statuses on what the database is doing Connections: number of connection attempts (successful or not) to the MySQL server.
  • 79.
    Queries: number ofstatements executed by the server. This variable includes statements executed within stored programs, unlike the Questions variable. This variable was added in MySQL 5.0.76.
  • 80.
    Questions: The numberof statements executed by the server. As of MySQL 5.0.72, this includes only statements sent to the server by clients and no longer includes statements executed within stored programs, unlike the Queries variable.
  • 81.
    Slow_queries: The numberof queries that have taken more than long_query_time seconds.
  • 82.
    What is thedatabase doing? (con't) General information statuses (con't) Sort_merge_passes: number of merge passes that the sort algorithm has had to do. If this value is large, you should consider increasing the value of the sort_buffer_size system variable.
  • 83.
    Table_locks_immediate: number oftimes a table lock was granted immediately. Typically associate with MyISAM.
  • 84.
    Table_locks_waited: number oftimes we had to wait to get a table lock. Typically associate with MyISAM. If high you may need to consider changing storage engines. Threads_cached: number of threads in the thread cache.
  • 85.
    Threads_connected: number ofcurrently open connections.
  • 86.
    Threads_created: number ofthreads created to handle connections. If Threads_created is big, you may want to increase the thread_cache_size value.
  • 87.
    The cache missrate can be calculated as Threads_created/Connections.
  • 88.
    What is thedatabase doing? (con't) More information on JOINS Select_full_join: number of joins that perform table scans because they do not use indexes. If this value is not 0, you should carefully check the indexes of your tables. Select_range_check: number of joins without keys that check for key usage after each row. If this is not 0, you should carefully check the indexes of your tables. Select_full_range_join: number of joins that used a range search on a reference table. Select_scan: number of joins that did a full scan of the first table. Select_range: number of joins that used ranges on the first table.
  • 89.
    Variables for tweakingGlobals Main ones: innodb_buffer_pool_size: The size in bytes of the memory buffer InnoDB uses to cache data and indexes of its tables. The larger you set this value, the less disk I/O is needed to access data in tables.
  • 90.
    On a dedicateddatabase server, you may set this to up to 80% of the machine physical memory size. However, do not set it too large because competition for physical memory might cause paging in the operating system.
  • 91.
    Variables for tweakingGlobals Main ones: innodb_log_file_size: larger the value, the less checkpoint flush activity is needed in the buffer pool, saving disk I/O
  • 92.
    larger the logfiles longer the crash recovery time
  • 93.
    size in bytesof each log file in a log group.
  • 94.
    combined size oflog files must be less than 4GB
  • 95.
    Sensible values rangefrom 1MB to 1/N-th of the size of the buffer pool, where N is the number of log files in the group (innodb_log_files_in_group).
  • 96.
    Variables for tweakingGlobals Main ones (con't) key_buffer_size: Index blocks for MyISAM tables are buffered and are shared by all threads. key_buffer_size is the size of the buffer used for index blocks.
  • 97.
    The maximum allowablesetting for key_buffer_size is 4GB on 32-bit platforms. As of MySQL 5.0.52, values larger than 4GB are allowed for 64-bit platforms.
  • 98.
    Using a valuethat is 25% of total memory on a machine that mainly runs MySQL is quite common. However, if you make the value too large your system might start to page and become extremely slow.
  • 99.
    Variables for tweakingGlobals Lesser ones: table_cache: The number of open tables for all threads. Increasing this value increases the number of file descriptors that mysqld requires.
  • 100.
    You can checkwhether you need to increase the table cache by checking the Opened_tables status variable. If the value of Opened_tables is constantly increasing and you don't do FLUSH TABLES often (which just forces all tables to be closed and reopened), then you should increase the value of the table_cache variable.
  • 101.
    Variables for tweakingGlobals Lesser ones: thread_cache_size: threads the server should cache for reuse. When a client disconnects, the client's threads are put in the cache if there are fewer than thread_cache_size threads there.
  • 102.
    Requests for threadsare satisfied by reusing threads taken from the cache if possible, and only when the cache is empty is a new thread created. increase to improve performance if you have a lot of new connections. May not provide a notable performance improvement if you have a good thread implementation. (100-((Threads_created / Connections)*100) = thread cache efficiency
  • 103.
    Variables for tweakingGlobals Lesser ones: query_cache_size: The amount of memory allocated for caching query results.
  • 104.
    default value is0, which disables the query cache.
  • 105.
    allowable values aremultiples of 1024; other values are rounded down to the nearest multiple.
  • 106.
    Note that query_cache_sizebytes of memory are allocated even if query_cache_type is set to 0.
  • 107.
    Variables for tweakingPer Session max_heap_table_size: sets the maximum size to which MEMORY tables are allowed to grow. tmp_table_size: maximum size of internal in-memory temporary tables. (The actual limit is determined as the smaller of max_heap_table_size and tmp_table_size.)
  • 108.
    If an in-memorytemporary table exceeds the limit, MySQL automatically converts it to an on-disk MyISAM table.
  • 109.
    Variables for tweakingPer Session (con't) read_buffer_size: Each thread that does a sequential scan allocates a buffer of this size (in bytes) for each table it scans. If you do many sequential scans, you might want to increase this value.
  • 110.
    The value ofthis variable should be a multiple of 4KB. If it is set to a value that is not a multiple of 4KB, its value will be rounded down to the nearest multiple of 4KB.
  • 111.
    The maximum allowablesetting is 2GB though we do not normally recommend having it higher then 8M.
  • 112.
    Variables for tweakingPer Session (con't) read_rnd_buffer_size: When reading rows in sorted order following a key-sorting operation, the rows are read through this buffer to avoid disk seeks.
  • 113.
    Setting the variableto a large value can improve ORDER BY performance by a lot.
  • 114.
    The maximum allowablesetting is 2GB though we do not normally recommend having it higher then 8M. sort_buffer_size: Each thread that needs to do a sort allocates a buffer of this size. Increase this value for faster ORDER BY or GROUP BY operations.
  • 115.
    Variables for tweakingPer Session (con't) bulk_insert_buffer_size: MyISAM uses a special tree-like cache to make bulk inserts faster for INSERT ... SELECT, INSERT ... VALUES (...), (...), ..., and LOAD DATA INFILE when adding data to non-empty tables.
  • 116.
    limits the sizeof the cache tree in bytes per thread. join_buffer_size: size of the buffer that is used for plain index scans, range index scans, and joins that do not use indexes and thus perform full table scans.
  • 117.
    the best wayto get fast joins is to add indexes.
  • 118.
    Variables for tweakingPer Session (con't) max_allowed_packet : maximum size of one packet or any generated/intermediate string.
  • 119.
    The packet messagebuffer is initialized to net_buffer_length bytes, but can grow up to max_allowed_packet bytes when needed.
  • 120.
    value by defaultis small, to catch large (possibly incorrect) packets. You must increase this value if you are using large BLOB columns or long strings. It should be as big as the largest BLOB you want to use.
  • 121.
    Variables for tweakingPer Session (con't) myisam_max_sort_file_size: maximum size of the temporary file that MySQL is allowed to use while re-creating a MyISAM index (during REPAIR TABLE, ALTER TABLE, or LOAD DATA INFILE).
  • 122.
    If the filesize would be larger than this value, the index is created using the key cache instead, which is slower.
  • 123.
    The value isgiven in bytes. myisam_sort_buffer_size: size of the buffer that is allocated when sorting MyISAM indexes during a REPAIR TABLE or when creating indexes with CREATE INDEX or ALTER TABLE
  • 124.
  • 125.
    Performance Tuning theMySQL Server Ligaya Turmelle MySQL Support Engineer [email_address]