Friday, October 29, 2010
<Insert Picture Here>
MySQL Server Performance Tuning 101
Ligaya Turmelle
Senior Technical Support Engineer - MySQL
ligaya.turmelle@oracle.com
http://joind.in/2285
Friday, October 29, 2010
MySQL
• world's most popular open source database
software
• a key part of LAMP (Linux, Apache, MySQL,
PHP / Perl / Python)
• Site: http://www.mysql.com/
• Download: mysql.org or http://dev.mysql.com/
downloads/
• Online Manual: http://dev.mysql.com/doc/refman/
5.1/en/index.html
Friday, October 29, 2010
<Insert Picture Here>
Before we start
Friday, October 29, 2010
Before you Start
• Single greatest gain can be received by optimizing
the queries
• Optimize the underlying system
• Understand that there are no hard/fast/exact answers
for a “proper” value
– Change one value at a time and benchmark to look for
improvement
– Better to under allocate then to over allocate
Friday, October 29, 2010
How MySQL Uses Memory
• 2 ways - Global and Per Connection
• Global - Most allocated once when the server starts -
can be large
• Per Connection - for *each* connection as needed -
should be small
• Global memory + (max connections * session buffers)
Friday, October 29, 2010
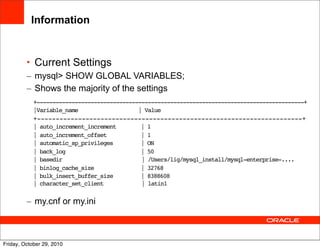
Information
• Current Settings
– mysql> SHOW GLOBAL VARIABLES;
– Shows the majority of the settings
+------------------------------------------------------------------------------------+
|Variable_name | Value
+-----------------------------------------------------------------------+
| auto_increment_increment | 1
| auto_increment_offset | 1
| automatic_sp_privileges | ON
| back_log | 50
| basedir | /Users/lig/mysql_install/mysql-enterprise-....
| binlog_cache_size | 32768
| bulk_insert_buffer_size | 8388608
| character_set_client | latin1
– my.cnf or my.ini
Friday, October 29, 2010
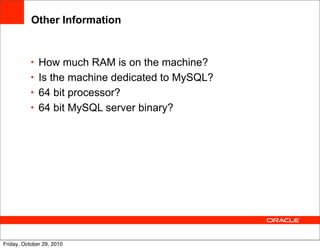
Other Information
• How much RAM is on the machine?
• Is the machine dedicated to MySQL?
• 64 bit processor?
• 64 bit MySQL server binary?
Friday, October 29, 2010
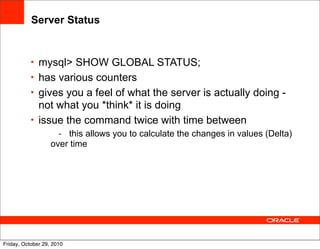
Server Status
• mysql> SHOW GLOBAL STATUS;
• has various counters
• gives you a feel of what the server is actually doing -
not what you *think* it is doing
• issue the command twice with time between
- this allows you to calculate the changes in values (Delta)
over time
Friday, October 29, 2010
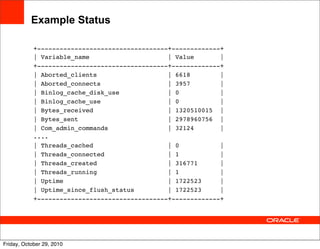
+-----------------------------------+-------------+
| Variable_name | Value |
+-----------------------------------+-------------+
| Aborted_clients | 6618 |
| Aborted_connects | 3957 |
| Binlog_cache_disk_use | 0 |
| Binlog_cache_use | 0 |
| Bytes_received | 1320510015 |
| Bytes_sent | 2978960756 |
| Com_admin_commands | 32124 |
....
| Threads_cached | 0 |
| Threads_connected | 1 |
| Threads_created | 316771 |
| Threads_running | 1 |
| Uptime | 1722523 |
| Uptime_since_flush_status | 1722523 |
+-----------------------------------+-------------+
Example Status
Friday, October 29, 2010
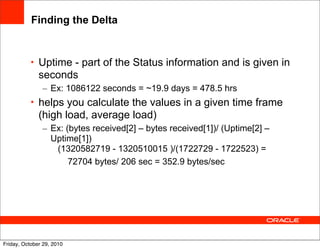
Finding the Delta
• Uptime - part of the Status information and is given in
seconds
– Ex: 1086122 seconds = ~19.9 days = 478.5 hrs
• helps you calculate the values in a given time frame
(high load, average load)
– Ex: (bytes received[2] – bytes received[1])/ (Uptime[2] –
Uptime[1])
(1320582719 - 1320510015 )/(1722729 - 1722523) =
72704 bytes/ 206 sec = 352.9 bytes/sec
Friday, October 29, 2010
<Insert Picture Here>
Lets begin
Friday, October 29, 2010
What is the server doing?
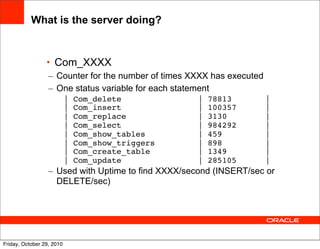
• Com_XXXX
– Counter for the number of times XXXX has executed
– One status variable for each statement
| Com_delete | 78813 |
| Com_insert | 100357 |
| Com_replace | 3130 |
| Com_select | 984292 |
| Com_show_tables | 459 |
| Com_show_triggers | 898 |
| Com_create_table | 1349 |
| Com_update | 285105 |
– Used with Uptime to find XXXX/second (INSERT/sec or
DELETE/sec)
Friday, October 29, 2010
<Insert Picture Here>
MyISAM
Friday, October 29, 2010
What is the server doing?
(con’t)
• key buffer (MyISAM)
– Key_blocks_unused:
• number of unused blocks
• key_buffer_size - Key_blocks_unused = amount in use
– Key_blocks_used:
• a high-water mark that indicates the maximum number of
blocks that have ever been in use at one time
Friday, October 29, 2010
What is the server doing?
(con’t)
• key buffer (MyISAM)
– Key_read_requests:
• number of requests to read a key block from the cache
• a cache hit
– Key_reads:
• number of physical reads of a key block from disk
• a cache miss
• large value == key_buffer_size is probably to small
– cache miss rate:
– Key_reads/Key_read_requests
– Key buffer efficiency:
– 1 - cache miss rate
Friday, October 29, 2010
key_buffer_size
• Global variable
• the buffer used for MyISAM index blocks
• index blocks are buffered and shared by all threads
• the maximum allowable setting
– 4GB on 32 bit system
– after 5.0.52 on 64 bit systems = 4GB+
• dedicated machine - 25% of total memory is common
• uses the OS file cache system to cache the files
• too high == paging == bad
Friday, October 29, 2010
What is the server doing?
(con’t)
• MyISAM table locks
– Table_locks_immediate:
• # of table locks granted immediately to MyISAM tables
– Table_locks_waited:
• # of times we have had to wait to get a table lock for
MyISAM tables
• If value is high - consider changing storage engines
Friday, October 29, 2010
<Insert Picture Here>
InnoDB
Friday, October 29, 2010
What is the server doing?
(con’t)
• Innodb_*
– Has various information about the InnoDB tablespace
• Innodb_buffer_pool_pages_data:
– # of pages containing data (dirty or clean)
• Innodb_buffer_pool_pages_free:
– # of free pages
• Innodb_buffer_pool_pages_total:
– total size of the buffer pool, in pages
• Innodb_buffer_pool_wait_free:
– count of # of times we waited for pages to be flushed
– should be a small value
Friday, October 29, 2010
innodb_buffer_pool_size
• Global variable
• size in bytes
• used to cache data and indexes of InnoDB tables
(clustered indexes - remember)
• the larger the value - the less disk IO is needed to
access the data
• dedicated database server - up to 80% of the physical
memory
• buffers everything itself (O_DIRECT)
• DO NOT set to large - will cause paging/swap == bad
Friday, October 29, 2010
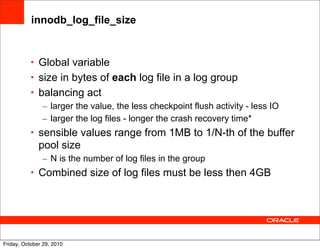
innodb_log_file_size
• Global variable
• size in bytes of each log file in a log group
• balancing act
– larger the value, the less checkpoint flush activity - less IO
– larger the log files - longer the crash recovery time*
• sensible values range from 1MB to 1/N-th of the buffer
pool size
– N is the number of log files in the group
• Combined size of log files must be less then 4GB
Friday, October 29, 2010
<Insert Picture Here>
Query Cache
Friday, October 29, 2010
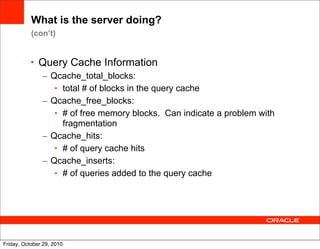
What is the server doing?
(con’t)
• Query Cache Information
– Qcache_total_blocks:
• total # of blocks in the query cache
– Qcache_free_blocks:
• # of free memory blocks. Can indicate a problem with
fragmentation
– Qcache_hits:
• # of query cache hits
– Qcache_inserts:
• # of queries added to the query cache
Friday, October 29, 2010
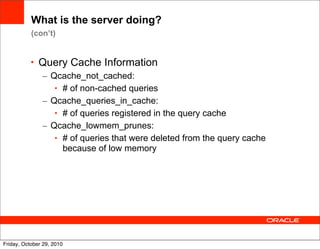
What is the server doing?
(con’t)
• Query Cache Information
– Qcache_not_cached:
• # of non-cached queries
– Qcache_queries_in_cache:
• # of queries registered in the query cache
– Qcache_lowmem_prunes:
• # of queries that were deleted from the query cache
because of low memory
Friday, October 29, 2010
What is the server doing?
(con’t)
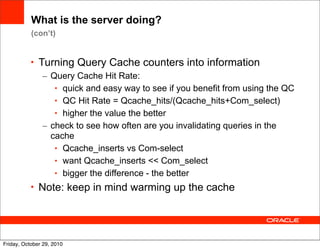
• Turning Query Cache counters into information
– Query Cache Hit Rate:
• quick and easy way to see if you benefit from using the QC
• QC Hit Rate = Qcache_hits/(Qcache_hits+Com_select)
• higher the value the better
– check to see how often are you invalidating queries in the
cache
• Qcache_inserts vs Com-select
• want Qcache_inserts << Com_select
• bigger the difference - the better
• Note: keep in mind warming up the cache
Friday, October 29, 2010
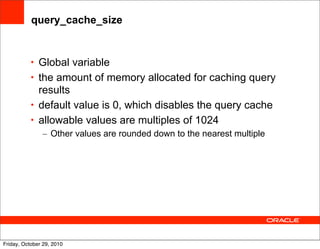
query_cache_size
• Global variable
• the amount of memory allocated for caching query
results
• default value is 0, which disables the query cache
• allowable values are multiples of 1024
– Other values are rounded down to the nearest multiple
Friday, October 29, 2010
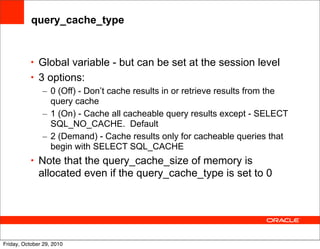
query_cache_type
• Global variable - but can be set at the session level
• 3 options:
– 0 (Off) - Don’t cache results in or retrieve results from the
query cache
– 1 (On) - Cache all cacheable query results except - SELECT
SQL_NO_CACHE. Default
– 2 (Demand) - Cache results only for cacheable queries that
begin with SELECT SQL_CACHE
• Note that the query_cache_size of memory is
allocated even if the query_cache_type is set to 0
Friday, October 29, 2010
<Insert Picture Here>
Threads
Friday, October 29, 2010
What is the server doing?
(con’t)
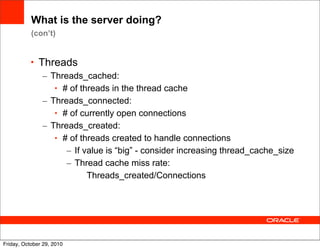
• Threads
– Threads_cached:
• # of threads in the thread cache
– Threads_connected:
• # of currently open connections
– Threads_created:
• # of threads created to handle connections
– If value is “big” - consider increasing thread_cache_size
– Thread cache miss rate:
• Threads_created/Connections
Friday, October 29, 2010
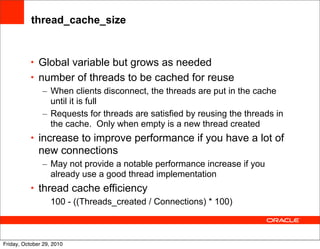
thread_cache_size
• Global variable but grows as needed
• number of threads to be cached for reuse
– When clients disconnect, the threads are put in the cache
until it is full
– Requests for threads are satisfied by reusing the threads in
the cache. Only when empty is a new thread created
• increase to improve performance if you have a lot of
new connections
– May not provide a notable performance increase if you
already use a good thread implementation
• thread cache efficiency
– 100 - ((Threads_created / Connections) * 100)
Friday, October 29, 2010
What is the server doing?
(con’t)
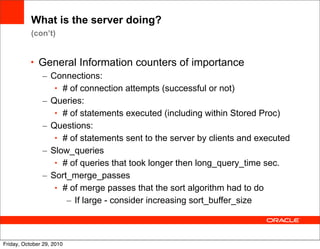
• General Information counters of importance
– Connections:
• # of connection attempts (successful or not)
– Queries:
• # of statements executed (including within Stored Proc)
– Questions:
• # of statements sent to the server by clients and executed
– Slow_queries
• # of queries that took longer then long_query_time sec.
– Sort_merge_passes
• # of merge passes that the sort algorithm had to do
– If large - consider increasing sort_buffer_size
Friday, October 29, 2010
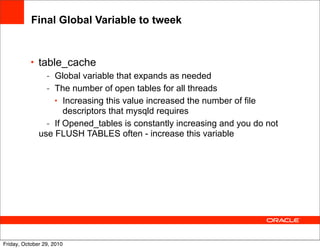
Final Global Variable to tweek
• table_cache
- Global variable that expands as needed
- The number of open tables for all threads
• Increasing this value increased the number of file
descriptors that mysqld requires
- If Opened_tables is constantly increasing and you do not
use FLUSH TABLES often - increase this variable
Friday, October 29, 2010
<Insert Picture Here>
Session Variables
Friday, October 29, 2010
Per connection variables available for tweeking
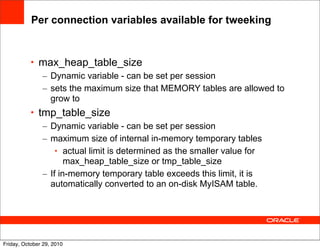
• max_heap_table_size
– Dynamic variable - can be set per session
– sets the maximum size that MEMORY tables are allowed to
grow to
• tmp_table_size
– Dynamic variable - can be set per session
– maximum size of internal in-memory temporary tables
• actual limit is determined as the smaller value for
max_heap_table_size or tmp_table_size
– If in-memory temporary table exceeds this limit, it is
automatically converted to an on-disk MyISAM table.
Friday, October 29, 2010
Per connection variables available for tweeking
(con’t)
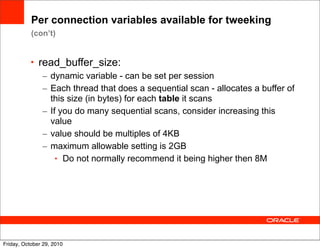
• read_buffer_size:
– dynamic variable - can be set per session
– Each thread that does a sequential scan - allocates a buffer of
this size (in bytes) for each table it scans
– If you do many sequential scans, consider increasing this
value
– value should be multiples of 4KB
– maximum allowable setting is 2GB
• Do not normally recommend it being higher then 8M
Friday, October 29, 2010
Per connection variables available for tweeking
(con’t)
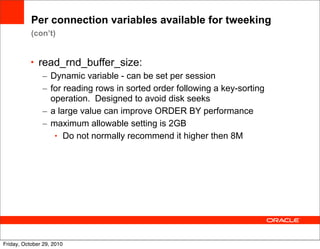
• read_rnd_buffer_size:
– Dynamic variable - can be set per session
– for reading rows in sorted order following a key-sorting
operation. Designed to avoid disk seeks
– a large value can improve ORDER BY performance
– maximum allowable setting is 2GB
• Do not normally recommend it higher then 8M
Friday, October 29, 2010
Per connection variables available for tweeking
(con’t)
• sort_buffer_size:
– dynamic variable - can be set per session
– each thread that needs to do a sort allocates a buffer of this
size
– increase this value for faster ORDER BY or GROUP BY
operations
Friday, October 29, 2010
Per connection variables available for tweeking
(con’t)
• bulk_insert_buffer_size:
– Dynamic variable - can be set per session
– cache to make bulk inserts faster for INSERT... SELECT,
INSERT... VALUES (...), (...), ..., and LOAD DATA INFILE
when adding data to no-empty tables.
– limits the size of the cache tree in bytes per thread
– Set to 0 disables the optimization used
Friday, October 29, 2010
Per connection variables available for tweeking
(con’t)
• join_buffer_size:
– Dynamic variable - can be set per session
– Size of the buffer that is used for plain index scans, range
index scans and joins that do not use indexes - full table
scans
– The best way to get fast joins is to use indexes
– band-aid - don’t depend on it!
Friday, October 29, 2010
<Insert Picture Here>
Questions?
Friday, October 29, 2010
<Insert Picture Here>
Contact:
Email:
ligaya@mysql.com
ligaya.turmelle@oracle.com
Personal Website:
http://blog.khankennels.com
Twitter: @lig
http://joind.in/2285
Friday, October 29, 2010