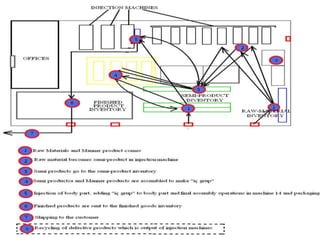
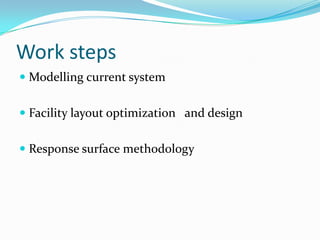
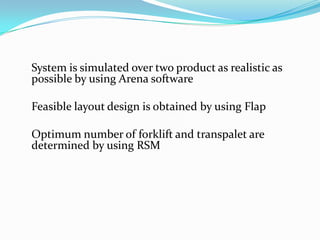
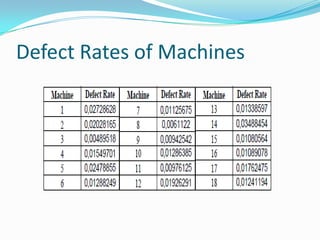
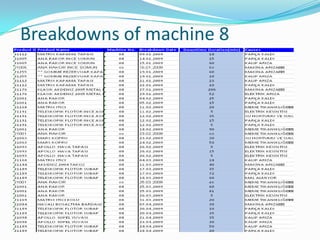
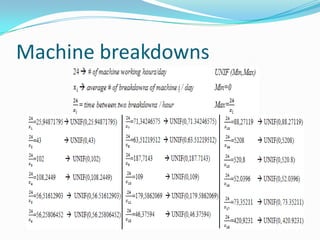
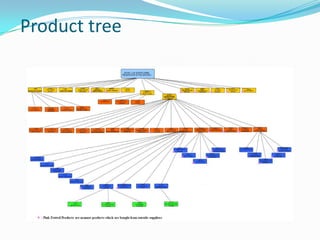
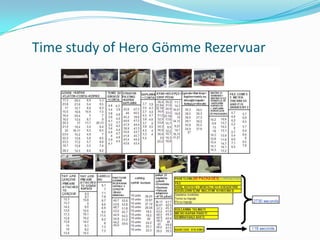
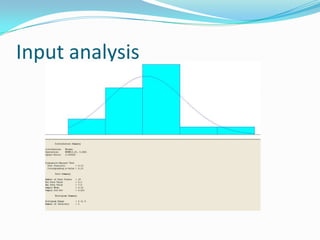
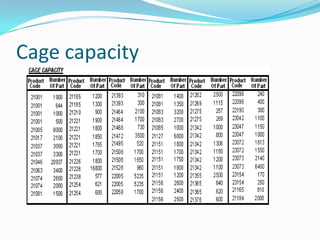
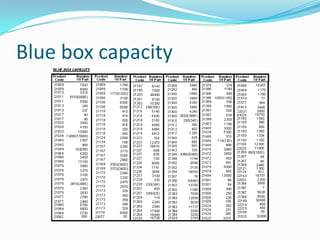
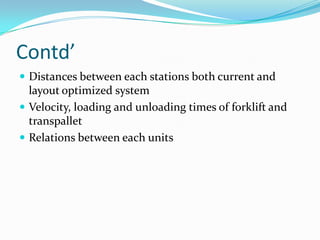
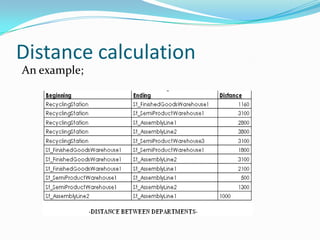
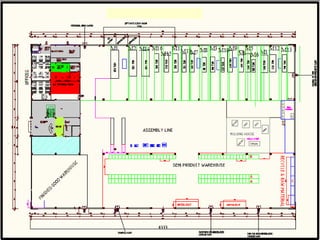
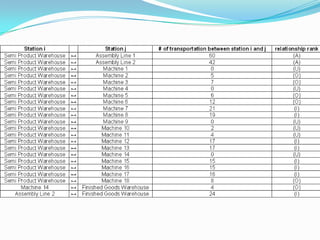
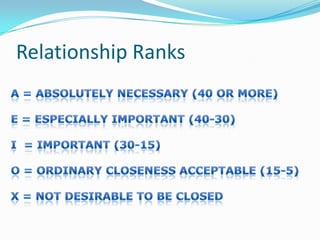
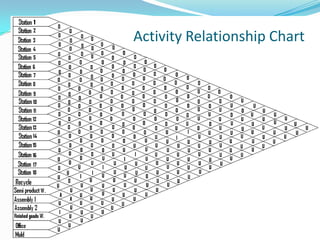
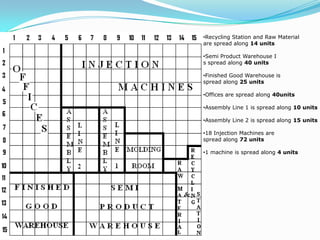
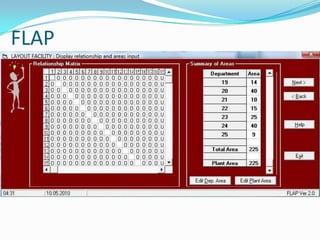
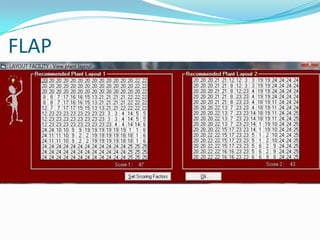
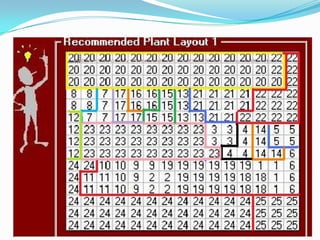
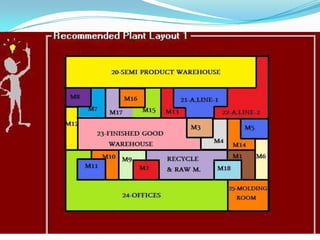
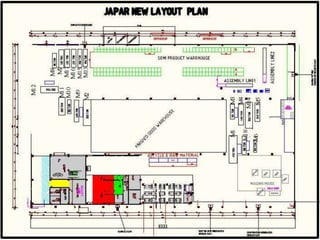
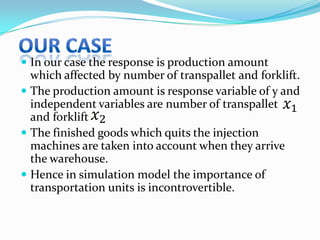
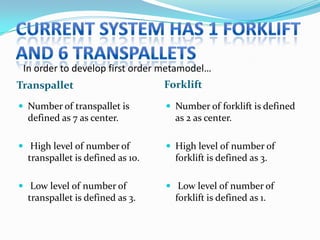
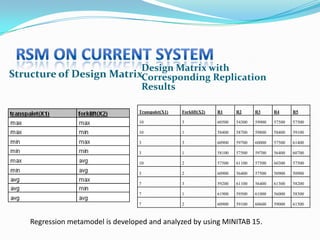
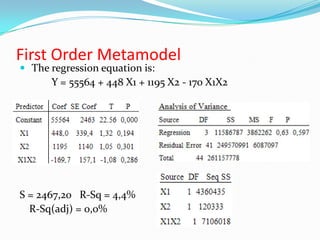
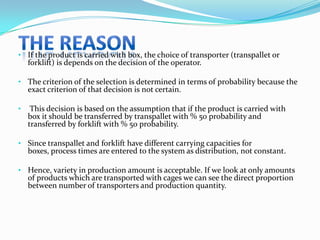
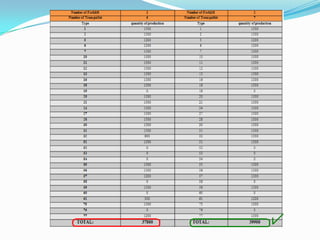
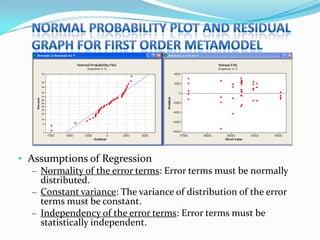
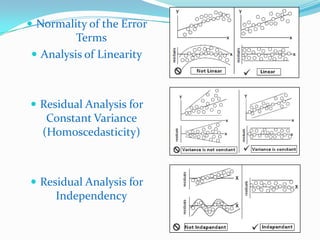
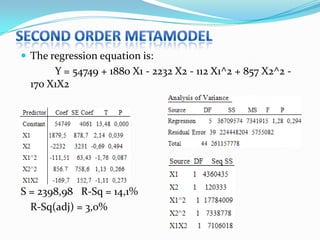
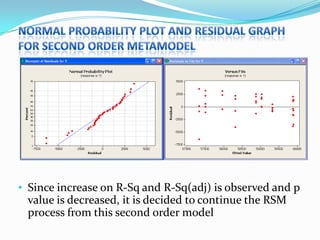
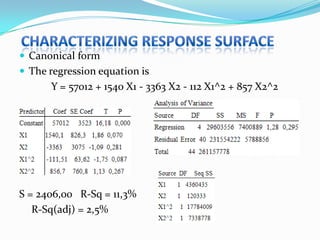
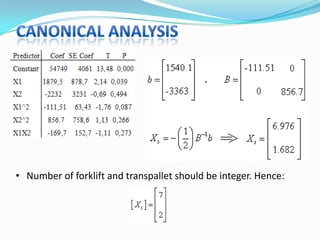
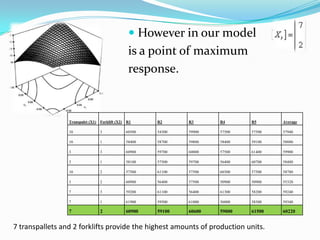
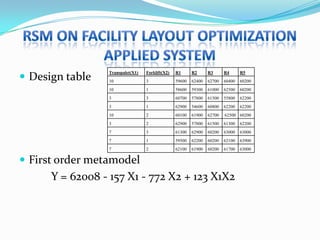
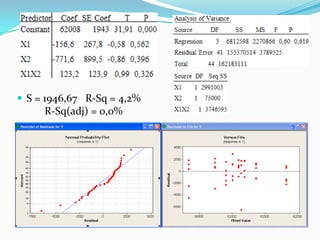
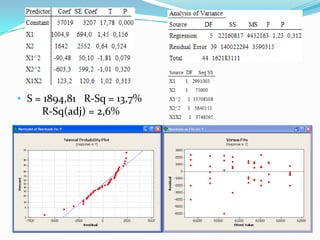
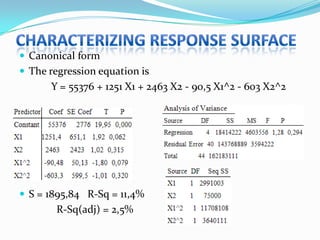
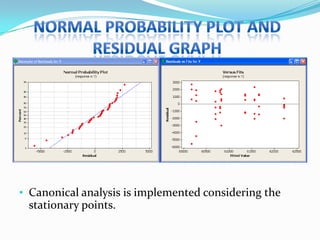
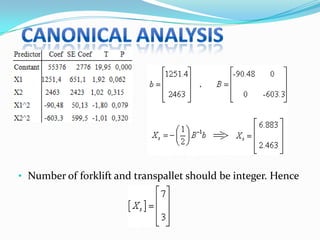
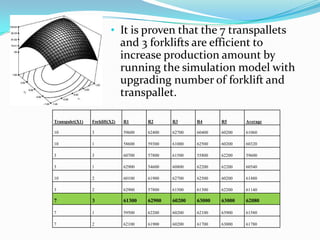
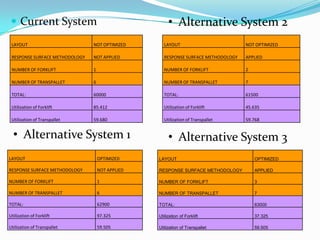
The document discusses a plastic manufacturing facility that produces items like toilet components. It outlines work to optimize the facility layout and logistics. Response surface methodology was used to determine the optimal number of forklifts and transpallet vehicles needed. Simulation results found that 7 transpallet vehicles and 2 forklifts provided the highest production output. Alternative systems were also analyzed.
Computational Optimization, Modelling and Simulation: Recent Trends and Chall...Xin-She Yang
This document summarizes recent trends and challenges in computational optimization, modeling and simulation. It discusses how nature-inspired algorithms and surrogate modeling have become popular approaches. However, challenges remain around theoretical understanding of algorithms, solving large-scale problems, and constructing accurate yet efficient surrogate models. The document also reviews papers presented at a workshop on these topics, which demonstrate diverse applications in engineering. Open questions are identified regarding improving algorithm performance, developing more intelligent algorithms, and determining best practices for specific problems.
Modeling, Simulation and Optimization of a Robotic Flexible Manufacturing Pac...AM Publications,India
One of the essential conditions underlying the optimal integration Industrial Robot in a technological environment starts from the realization of the interdependence between the general architecture of the workspace and the Industrial Robot and its correlative with the type of operations to be performed. This will take into account all technological equipment, components perirobotice, items handled, both in terms of construction, but mostly functional, because the functioning of all the components that participate directly in an application robot need to be mutually synchronized and controlled by sensors and transducers. Therefore, the choice of robot needed to be integrated defining its geometric characteristics, constructive, functional and its location in a technological environment involves the study prior to the arrangement of space, and functioning of all other components of the cell / island / line of production or palletizing. Program used Flexsim.
Un task sequence es una serie de tareas que deben ejecutarse en orden secuencial por operadores u objetos móviles como vehículos ASRS o robots. Cada tarea tiene un valor de prioridad y anticipación. Se pueden crear task sequences automáticamente para mover artículos a la siguiente estación o llamar a operarios, o mediante código usando tres comandos: Createemptytasksequence(), Inserttask() y Dispatchtasksequence().
Presentation of Jacques Niederberger for the "Workshop Virtual Sugarcane Biorefinery"
Apresentação de Jacques Niederberger realizada no "Workshop Virtual Sugarcane Biorefinery "
Date / Data : Aug 13 - 14th 2009/
13 e 14 de agosto de 2009
Place / Local: ABTLus, Campinas, Brazil
Event Website / Website do evento: http://www.bioetanol.org.br/workshop4
This document presents a summary of concepts related to stability analysis of linear time-invariant systems using the Routh-Hurwitz criterion. It defines BIBO stability and asymptotic stability. It explains that BIBO stability does not guarantee asymptotic stability. The Routh-Hurwitz method is then introduced to determine stability by analyzing the characteristic polynomial of the system. Various cases are discussed including systems with parameters. An example demonstrates using the Routh table to find the range of a parameter that ensures asymptotic stability.
State space analysis shortcut rules, control systems, Prajakta Pardeshi
This document discusses different types of state space analysis including physical variable form, phase variable form using canonical forms I and II, parallel realization, converting between state models and transfer functions, state transition matrices, and observability and controllability. It provides examples of obtaining state space models from electrical circuits using different approaches like writing standard state equations, using canonical forms, and parallel realization from transfer functions. It also outlines how to check for observability and controllability of state space models.
Mathematical modeling and parameter estimation for water quality management s...Kamal Pradhan
This report describes various problem solving techniques in mathematical modeling for calculating various parameters of water e.g. temperature, pH, Dissolved oxygen. A mathematical model provides the ability to predict the contaminant concentration levels of a river. Here we are using an advection-diffusion equation as our mathematical model. The numerical solution of equation is calculated using Matlab & Mathematica. Parameter estimation is necessary in water modeling to predict the different parameters of water at different point with minimal errors. So here we use 2D & 3D interpolation technique for parameter estimation.
State space analysis, eign values and eign vectorsShilpa Shukla
This document discusses state space analysis and the conversion of transfer functions to state space models. It covers:
1. The need to convert transfer functions to state space form in order to apply modern time domain techniques for system analysis and design.
2. Three possible representations for realizing a transfer function as a state space model: first companion form, second companion form, and Jordan canonical form.
3. The concepts of eigenvalues and eigenvectors, and how they relate to state space models.
4. Worked examples of converting transfer functions to state space models in first and second companion forms, as well as the Jordan canonical form for systems with repeated and non-repeated roots.
The document provides an overview
This document discusses different types of noise in communication systems. It defines random variables and random processes that are used to model noise. There are two main types of random variables: discrete and continuous. Noise can be modeled as random processes. Thermal noise arises from the random motion of electrons and is well modeled by a Gaussian process. Other types of noise discussed include shot noise and transit time noise. External noise sources include atmospheric noise, extraterrestrial noise from space, and man-made noise. Internal noise is generated within devices and circuits. White noise is defined as having a constant power spectral density across all frequencies.
This document provides an overview of amplitude (linear) modulation techniques. It defines key concepts like modulation, baseband communication, and carrier communication. It then describes various amplitude modulation schemes including AM, DSB-SC, QAM, SSB, and VSB. Implementation and demodulation of these techniques is discussed. The document also covers frequency mixing, superheterodyne receivers, frequency division multiplexing, and carrier acquisition using phase-locked loops. Suggested problems are provided at the end.
This document discusses simulation examples of queueing systems. It describes three key steps in simulations: 1) determining input characteristics, 2) constructing a simulation table, and 3) generating input values and evaluating responses over repetitions. It then provides details on simulating a single-channel queue, including modeling arrivals and services as probability distributions and tracking events in a simulation table. The document concludes with an example simulation of customers arriving at and being served by a single checkout counter.
This document discusses different radio propagation models for both indoor and outdoor environments. It provides examples of common outdoor propagation models including the Longley-Rice model and Hata model. It also discusses indoor propagation models and key factors that influence indoor radio signals, such as building layout and construction materials. Common indoor path loss models include the log-distance path loss model and ITU indoor attenuation model. Radio propagation is influenced by factors like distance, environment, and signal penetration through buildings.
Automotive engine valve recession (engineering research series)Arul Gnana John
Valve wear has been a serious problem to engine designers and manufacturers for many years. Although new valve materials and production techniques are constantly being developed, these advances have been outpaced by demands for increased engine performance. The drive for reduced oil consumption and exhaust emissions, the phasing out of leaded petrol, reductions in the sulphur content of diesel fuel, and the introduction of alternative fuels such as gas all have implications for valve and seat insert wear.
This book aims to provide the reader with a complete understanding of valve recession, starting with a brief introduction to valve operation, design, and operating conditions such as loading and temperature. A detailed overview of work carried out previously, looking at valve and seat wear, is then given and valve and seat failure case studies are discussed.
A closer look is then taken at work carried out at the University of Sheffield, UK, including the development of purpose-built test apparatus capable of providing a simulation of the wear of valves and seats used in automotive engines. Experimental
investigations are carried out to identify the fundamental valve and seat wear mechanisms, the effect of engine operating parameters on wear, and to rank potential new seat materials.
An important aspect of research is the industrial implementation of the results and the provision of suitable design tools. A design procedure is outlined, which encapsulates the review of literature, analysis of failed specimens, and bench test work. This includes a semi-empirical model for predicting valve recession run in an iterative software programme called RECESS, as well as flow charts to be used to reduce the likelihood of recession occurring during the design process and to offer solutions to
problems that do occur.
This document discusses simulation examples and simulation of queuing systems. It provides three key steps to carry out a simulation: 1) determine input characteristics, 2) construct a simulation table to track the system state over time, and 3) initialize and run the simulation. It then gives an example of simulating a single-channel queue, including generating random interarrival and service times from distributions and constructing a simulation table. Key performance measures like average wait time and server idle time are calculated from the table.
This document discusses several numerical methods for solving partial differential equations (PDEs) using Mathematica and MATLAB. It covers finite difference methods like FTCS, Lax, Crank-Nicolson for parabolic PDEs. It also discusses Jacobi's method, SOR method for elliptic PDEs and finite difference schemes for hyperbolic PDEs. MATLAB code examples are provided to implement these methods for different PDEs like heat equation, wave equation and Poisson's equation.
Modeling, simulation and optimization analysis of steering knuckle component ...eSAT Publishing House
This document summarizes a study that modeled, simulated, and optimized the design of a steering knuckle component for a race car. Five initial CAD models of the steering knuckle were created and analyzed using finite element analysis to determine stresses, displacements, and weights. The best design was then optimized using shape optimization software to reduce weight while maintaining strength. The optimized design achieved a 45.8% reduction in mass while still meeting strength requirements.
Modelling and Simulation for Industry 4.0 SUCCESS CASESinLabFIB
IoT: New business paradigm for SMEs? - IoTSWC side event
Mr. Benito Carrillo (Vicedean of New Industrialization in Informatics Engineering Professional Association of Catalonia)
Session 2: Modelling and Simulation for Industry 4.0 - round table on opportunities and challenges in the new era of IoT
This document provides information on various precision planetary gear reducers and economy gear reducers produced by Zipp Precision Gear Reducer. It includes technical specifications, dimensions, features, and applications for different models of precision planetary gear reducers and economy gear reducers. Product lines covered include PS, PN, RL, RS, ZSR precision planetary gear reducers and EL economy gear reducers. Specifications provided include torque ratings, speed ratios, dimensions, mounting instructions, and more. The document serves as a catalog and reference for selecting the appropriate Zipp precision or economy gear reducer for different applications.
Tenants Perception of VFM summary based on data gathered during first two quarters of 2013.
QHS users receive individual analysis and benchmarking data.
e mail findoutmore@qhs.org.uk for details
This document contains information from a management review meeting including:
- Sales performance for the current year with plan vs actual figures. Some parts were below target due to reasons like customer requests or schedule changes.
- Production and dispatch details for various parts showing actual, scheduled, dispatched and pending quantities. Some parts were behind schedule due to reasons like customer requests.
- Quality performance for the current year with rejection and RTV figures. Rejection was highest in machine shop and final quality checking.
- Inventory levels over the current year showing work in progress and finished goods inventory.
- Manpower utilization against sales for different departments.
- Maintenance section details energy consumption and machine breakdown details for the
This document appears to be a catalog for precision planetary gear reducers and related products from Zipp Precision Gear Reducer. It includes technical specifications, dimensions, features and applications for their various gear reducer models including precision planetary, precision & economy planetary, and economy gear reducers. The document contains sections on features, technical data, dimensions and mounting instructions for the different product lines.
This document appears to be a catalog for precision planetary gear reducers and related products from Zipp Precision Gear Reducer. It includes technical specifications, dimensions, features and applications for various models of precision planetary gear reducers, economy gear reducers, and right angle gear reducers. The document contains sections on precision planetary gear reducers, precision and economy planetary gear reducers, technical data and dimensions for different models, as well as mounting instructions and torque requirements.
The objective of this tool was to give a measure of the Value at Risk of the given asset class using techniques like Historical simulation and Monte Carlo simulation. I was involved in the design of a package for estimating the Initial Margin requirement for OTC Derivatives like FX Forward Contracts and Interest Rate Swaps using Historical Value at Risk. I also designed a prototype for running a Monte Carlo simulation on a given stock using Geometric Brownian Motion.
The document discusses quality control and statistical quality control. It defines quality as properties valued by consumers and quality control as maintaining standards through testing samples. The goal of quality control is to eliminate nonconformities and wasted resources at lowest cost. Statistical quality control uses statistical tools like descriptive statistics, acceptance sampling, and statistical process control to measure and control variation in processes. Examples are provided of x-bar and R charts to determine if a gluing process is in control, as well as P and C charts to monitor defects and complaints.
This document appears to be a catalog for precision planetary gear reducers and related products from Zipp Precision Gear Reducer. It includes technical specifications, dimensions, features and applications for their various gear reducer models including precision planetary, precision & economy planetary, and economy gear reducers. Product information is provided for multiple frame sizes with details on torque ratings, speeds, materials, seals, lubrication and other specifications. Mounting instructions and diagrams of dimensional profiles are also included.
Wavelet bootstrap Multiple linear regression modelsVinit Sehgal
This document summarizes a study that developed and compared multiple linear regression models using wavelet transforms and bootstrap techniques for flood forecasting in the Mahanadi river basin in India.
Key aspects of the study included: (1) Selecting significant input variables and wavelets for model development based on correlation analysis, (2) Developing wavelet-bootstrap and wavelet models and comparing their performance to traditional models over lead times of 1-5 days, (3) Finding that wavelet-bootstrap models using the db45 wavelet and incorporating antecedent data outperformed other models with errors below 5% and RMSE below 400 m3/s for 1-day forecasts.
Human resource planning involves three main steps:
1) Forecasting future labor demand and supply to determine if surpluses or shortages will exist. This includes analyzing trends, indicators, and turnover.
2) Determining current and future labor supply through tools like succession planning, skills inventories, transition matrices, and personnel ratios.
3) Comparing forecasts to identify needed changes in recruiting, training, or layoffs to align the workforce with strategic goals. The goal is having the right people in the right jobs at the right time.
The document discusses decline curve analysis (DCA) for estimating reserves in conventional and unconventional reservoirs. It proposes using a Fetkovich type curve method in Microsoft Excel and comparing results to commercial software. The key steps are identifying the hyperbolic decline curve from production data, forecasting future production using the curve equation, and comparing actual vs predicted production to evaluate accuracy. DCA provides more accurate reserve estimates than other methods using less data as it accounts for production trends over time.
The document discusses the HPN series of precision planetary gearheads from Harmonic Drive. The gearheads deliver precision and value with a compact, lightweight design that incorporates helical gears for quiet performance and long life. They are available with short lead times and can couple to any servo motor. The gearheads are suitable for a wide range of automation and machinery applications. Tables provide specifications on torque ratings, speeds, dimensions, and efficiency for various models.
The document discusses working capital management and analyzes various companies' working capital levels over time. It defines key working capital concepts like gross working capital, net working capital, current assets and current liabilities. Charts show trends in several companies' working capital, sales, inventory levels, debtors, creditors, and profitability ratios over a 10 year period. The conclusion emphasizes the importance of effective working capital management for company operations.
This document discusses statistical process control and control charts. It defines the goals of control charts as collecting and visually presenting data to see when trends or out-of-control points occur. Process control charts graph sample data over time and show the process average and upper and lower control limits. Attribute control charts indicate whether points are in or out of tolerance, while variables charts measure attributes like length, weight or temperature over time. Examples are provided to illustrate p-charts, R-charts and X-bar charts using hotel luggage delivery time data.
Kollmorgen nema 34_n3_k3_stepper_systems_tb_specsheetElectromate
The document provides specifications for Pacific Scientific N&K-Series NEMA 34 high torque motors, including torque, current, resistance, inductance, detent torque, thermal resistance, and inertia ratings for various motor models. It also lists features and benefits of the motor series such as high torque capability, improved torque linearity, rugged construction, and optional encoder mounting provisions.
The document analyzes the feasibility of using a barge versus a semi-submersible landing platform for recovering rocket parts offshore Cape Canaveral, Florida. It finds that a barge is currently used but has workability issues during winter months due to wave interactions with its resonant modes. In contrast, a semi-submersible platform with resonant modes outside typical wave periods could increase landing chances by up to 25% and significantly reduce winter downtime. Environmental data for the site shows greatest workability from May to August, with the poorest in winter and hurricane seasons.
Design and manufacturing of a Handy Press for Bush Fitting using double actin...IRJET Journal
The document describes the design and manufacturing of a handy press for fitting bushes into machine parts using a double acting hydraulic cylinder. The press was designed for an industry that was having issues with loose bush fittings during assembly, requiring hammering that caused bush breakage. The handy press allows bushes to be hydraulically fitted into bores, reducing time and accidents compared to hammering while fitting. It is powered by a hydraulic system and single acting cylinder to press bushes into bores by moving a rod with slots holding the bush and fixing plate. This helps solve fitting issues in a safer and more efficient manner.
Similar to Performance Evaluation and System Design with Simulation Modeling (20)
Cosa hanno in comune un mattoncino Lego e la backdoor XZ?Speck&Tech
ABSTRACT: A prima vista, un mattoncino Lego e la backdoor XZ potrebbero avere in comune il fatto di essere entrambi blocchi di costruzione, o dipendenze di progetti creativi e software. La realtà è che un mattoncino Lego e il caso della backdoor XZ hanno molto di più di tutto ciò in comune.
Partecipate alla presentazione per immergervi in una storia di interoperabilità, standard e formati aperti, per poi discutere del ruolo importante che i contributori hanno in una comunità open source sostenibile.
BIO: Sostenitrice del software libero e dei formati standard e aperti. È stata un membro attivo dei progetti Fedora e openSUSE e ha co-fondato l'Associazione LibreItalia dove è stata coinvolta in diversi eventi, migrazioni e formazione relativi a LibreOffice. In precedenza ha lavorato a migrazioni e corsi di formazione su LibreOffice per diverse amministrazioni pubbliche e privati. Da gennaio 2020 lavora in SUSE come Software Release Engineer per Uyuni e SUSE Manager e quando non segue la sua passione per i computer e per Geeko coltiva la sua curiosità per l'astronomia (da cui deriva il suo nickname deneb_alpha).
Introduction of Cybersecurity with OSS at Code Europe 2024Hiroshi SHIBATA
I develop the Ruby programming language, RubyGems, and Bundler, which are package managers for Ruby. Today, I will introduce how to enhance the security of your application using open-source software (OSS) examples from Ruby and RubyGems.
The first topic is CVE (Common Vulnerabilities and Exposures). I have published CVEs many times. But what exactly is a CVE? I'll provide a basic understanding of CVEs and explain how to detect and handle vulnerabilities in OSS.
Next, let's discuss package managers. Package managers play a critical role in the OSS ecosystem. I'll explain how to manage library dependencies in your application.
I'll share insights into how the Ruby and RubyGems core team works to keep our ecosystem safe. By the end of this talk, you'll have a better understanding of how to safeguard your code.
For the full video of this presentation, please visit: https://www.edge-ai-vision.com/2024/06/building-and-scaling-ai-applications-with-the-nx-ai-manager-a-presentation-from-network-optix/
Robin van Emden, Senior Director of Data Science at Network Optix, presents the “Building and Scaling AI Applications with the Nx AI Manager,” tutorial at the May 2024 Embedded Vision Summit.
In this presentation, van Emden covers the basics of scaling edge AI solutions using the Nx tool kit. He emphasizes the process of developing AI models and deploying them globally. He also showcases the conversion of AI models and the creation of effective edge AI pipelines, with a focus on pre-processing, model conversion, selecting the appropriate inference engine for the target hardware and post-processing.
van Emden shows how Nx can simplify the developer’s life and facilitate a rapid transition from concept to production-ready applications.He provides valuable insights into developing scalable and efficient edge AI solutions, with a strong focus on practical implementation.
Programming Foundation Models with DSPy - Meetup SlidesZilliz
Prompting language models is hard, while programming language models is easy. In this talk, I will discuss the state-of-the-art framework DSPy for programming foundation models with its powerful optimizers and runtime constraint system.
Generating privacy-protected synthetic data using Secludy and MilvusZilliz
During this demo, the founders of Secludy will demonstrate how their system utilizes Milvus to store and manipulate embeddings for generating privacy-protected synthetic data. Their approach not only maintains the confidentiality of the original data but also enhances the utility and scalability of LLMs under privacy constraints. Attendees, including machine learning engineers, data scientists, and data managers, will witness first-hand how Secludy's integration with Milvus empowers organizations to harness the power of LLMs securely and efficiently.
GraphRAG for Life Science to increase LLM accuracyTomaz Bratanic
GraphRAG for life science domain, where you retriever information from biomedical knowledge graphs using LLMs to increase the accuracy and performance of generated answers
In the rapidly evolving landscape of technologies, XML continues to play a vital role in structuring, storing, and transporting data across diverse systems. The recent advancements in artificial intelligence (AI) present new methodologies for enhancing XML development workflows, introducing efficiency, automation, and intelligent capabilities. This presentation will outline the scope and perspective of utilizing AI in XML development. The potential benefits and the possible pitfalls will be highlighted, providing a balanced view of the subject.
We will explore the capabilities of AI in understanding XML markup languages and autonomously creating structured XML content. Additionally, we will examine the capacity of AI to enrich plain text with appropriate XML markup. Practical examples and methodological guidelines will be provided to elucidate how AI can be effectively prompted to interpret and generate accurate XML markup.
Further emphasis will be placed on the role of AI in developing XSLT, or schemas such as XSD and Schematron. We will address the techniques and strategies adopted to create prompts for generating code, explaining code, or refactoring the code, and the results achieved.
The discussion will extend to how AI can be used to transform XML content. In particular, the focus will be on the use of AI XPath extension functions in XSLT, Schematron, Schematron Quick Fixes, or for XML content refactoring.
The presentation aims to deliver a comprehensive overview of AI usage in XML development, providing attendees with the necessary knowledge to make informed decisions. Whether you’re at the early stages of adopting AI or considering integrating it in advanced XML development, this presentation will cover all levels of expertise.
By highlighting the potential advantages and challenges of integrating AI with XML development tools and languages, the presentation seeks to inspire thoughtful conversation around the future of XML development. We’ll not only delve into the technical aspects of AI-powered XML development but also discuss practical implications and possible future directions.
AI 101: An Introduction to the Basics and Impact of Artificial IntelligenceIndexBug
Imagine a world where machines not only perform tasks but also learn, adapt, and make decisions. This is the promise of Artificial Intelligence (AI), a technology that's not just enhancing our lives but revolutionizing entire industries.
HCL Notes und Domino Lizenzkostenreduzierung in der Welt von DLAUpanagenda
Webinar Recording: https://www.panagenda.com/webinars/hcl-notes-und-domino-lizenzkostenreduzierung-in-der-welt-von-dlau/
DLAU und die Lizenzen nach dem CCB- und CCX-Modell sind für viele in der HCL-Community seit letztem Jahr ein heißes Thema. Als Notes- oder Domino-Kunde haben Sie vielleicht mit unerwartet hohen Benutzerzahlen und Lizenzgebühren zu kämpfen. Sie fragen sich vielleicht, wie diese neue Art der Lizenzierung funktioniert und welchen Nutzen sie Ihnen bringt. Vor allem wollen Sie sicherlich Ihr Budget einhalten und Kosten sparen, wo immer möglich. Das verstehen wir und wir möchten Ihnen dabei helfen!
Wir erklären Ihnen, wie Sie häufige Konfigurationsprobleme lösen können, die dazu führen können, dass mehr Benutzer gezählt werden als nötig, und wie Sie überflüssige oder ungenutzte Konten identifizieren und entfernen können, um Geld zu sparen. Es gibt auch einige Ansätze, die zu unnötigen Ausgaben führen können, z. B. wenn ein Personendokument anstelle eines Mail-Ins für geteilte Mailboxen verwendet wird. Wir zeigen Ihnen solche Fälle und deren Lösungen. Und natürlich erklären wir Ihnen das neue Lizenzmodell.
Nehmen Sie an diesem Webinar teil, bei dem HCL-Ambassador Marc Thomas und Gastredner Franz Walder Ihnen diese neue Welt näherbringen. Es vermittelt Ihnen die Tools und das Know-how, um den Überblick zu bewahren. Sie werden in der Lage sein, Ihre Kosten durch eine optimierte Domino-Konfiguration zu reduzieren und auch in Zukunft gering zu halten.
Diese Themen werden behandelt
- Reduzierung der Lizenzkosten durch Auffinden und Beheben von Fehlkonfigurationen und überflüssigen Konten
- Wie funktionieren CCB- und CCX-Lizenzen wirklich?
- Verstehen des DLAU-Tools und wie man es am besten nutzt
- Tipps für häufige Problembereiche, wie z. B. Team-Postfächer, Funktions-/Testbenutzer usw.
- Praxisbeispiele und Best Practices zum sofortigen Umsetzen
Main news related to the CCS TSI 2023 (2023/1695)Jakub Marek
An English 🇬🇧 translation of a presentation to the speech I gave about the main changes brought by CCS TSI 2023 at the biggest Czech conference on Communications and signalling systems on Railways, which was held in Clarion Hotel Olomouc from 7th to 9th November 2023 (konferenceszt.cz). Attended by around 500 participants and 200 on-line followers.
The original Czech 🇨🇿 version of the presentation can be found here: https://www.slideshare.net/slideshow/hlavni-novinky-souvisejici-s-ccs-tsi-2023-2023-1695/269688092 .
The videorecording (in Czech) from the presentation is available here: https://youtu.be/WzjJWm4IyPk?si=SImb06tuXGb30BEH .
TrustArc Webinar - 2024 Global Privacy SurveyTrustArc
How does your privacy program stack up against your peers? What challenges are privacy teams tackling and prioritizing in 2024?
In the fifth annual Global Privacy Benchmarks Survey, we asked over 1,800 global privacy professionals and business executives to share their perspectives on the current state of privacy inside and outside of their organizations. This year’s report focused on emerging areas of importance for privacy and compliance professionals, including considerations and implications of Artificial Intelligence (AI) technologies, building brand trust, and different approaches for achieving higher privacy competence scores.
See how organizational priorities and strategic approaches to data security and privacy are evolving around the globe.
This webinar will review:
- The top 10 privacy insights from the fifth annual Global Privacy Benchmarks Survey
- The top challenges for privacy leaders, practitioners, and organizations in 2024
- Key themes to consider in developing and maintaining your privacy program
How to Get CNIC Information System with Paksim Ga.pptxdanishmna97
Pakdata Cf is a groundbreaking system designed to streamline and facilitate access to CNIC information. This innovative platform leverages advanced technology to provide users with efficient and secure access to their CNIC details.
Fueling AI with Great Data with Airbyte WebinarZilliz
This talk will focus on how to collect data from a variety of sources, leveraging this data for RAG and other GenAI use cases, and finally charting your course to productionalization.
Taking AI to the Next Level in Manufacturing.pdfssuserfac0301
Read Taking AI to the Next Level in Manufacturing to gain insights on AI adoption in the manufacturing industry, such as:
1. How quickly AI is being implemented in manufacturing.
2. Which barriers stand in the way of AI adoption.
3. How data quality and governance form the backbone of AI.
4. Organizational processes and structures that may inhibit effective AI adoption.
6. Ideas and approaches to help build your organization's AI strategy.
2. Founded in 1986 and located in Torbalı İzmir
Produces plastic materials ; flush tanks, internal
mechanisms, toilet seats etc…
Eighteen injection machines
Five assembly lines
3.
4. Work steps
Modelling current system
Facility layout optimization and design
Response surface methodology
5. System is simulated over two product as realistic as
possible by using Arena software
Feasible layout design is obtained by using Flap
Optimum number of forklift and transpalet are
determined by using RSM
6. Before modelling
Work flow
Bill of material
Operation trees
Time studies
Input analysis
Cycle times
Break downs
Defect rates
Size of the boxes and cages
14. Components are carried ;
boxes or cages
228 cages and
1000 blue boxes
Capacity of this boxes and cages for each component is
identified with a study in stocking area by portable
terminals.
17. Contd’
Distances between each stations both current and
layout optimized system
Velocity, loading and unloading times of forklift and
transpallet
Relations between each units
27. •Recycling Station and Raw Material
are spread along 14 units
•Semi Product Warehouse I
s spread along 40 units
•Finished Good Warehouse is
spread along 25 units
•Offices are spread along 40units
•Assembly Line 1 is spread along 10 units
•Assembly Line 2 is spread along 15 units
•18 Injection Machines are
spread along 72 units
•1 machine is spread along 4 units
34. Response surface methodology (RSM) is a
collection of mathematical and statistical
techniques that are useful for the modelling and
analyzing problems in which a response of interest
is influenced by several variables and the aim is to
optimize this response.
35. In our case the response is production amount
which affected by number of transpallet and forklift.
The production amount is response variable of y and
independent variables are number of transpallet
and forklift
The finished goods which quits the injection
machines are taken into account when they arrive
the warehouse.
Hence in simulation model the importance of
transportation units is incontrovertible.
36. In order to develop first order metamodel…
Transpallet Forklift
Number of transpallet is Number of forklift is defined
defined as 7 as center. as 2 as center.
High level of number of High level of number of
transpallet is defined as 10. forklift is defined as 3.
Low level of number of Low level of number of
transpallet is defined as 3. forklift is defined as 1.
38. First Order Metamodel
The regression equation is:
Y = 55564 + 448 X1 + 1195 X2 - 170 X1X2
S = 2467,20 R-Sq = 4,4%
R-Sq(adj) = 0,0%
39. R-Sq = coeffcient of determination
R-Sq expresses that the part of the variability of the
dependent variable with the variability of the
independent variable.
R-Sq = 4,4% 4,4 % of the variability on the
production amount can be explain by the variability of
the number of transportation units.
40. Transpalet(X1) Forklift(X2) R1 R2 R3 R4 R5
10 3 60500 54300 59900 57500 57500
10 1 58400 58700 59800 58400 59100
3 3 60900 59700 60000 57500 61400
3 1 58100 57500 59700 56400 60700
10 2 57500 61100 57500 60300 57500
3 2 60900 56400 57500 50900 50900
7 3 59200 61100 56400 61300 58200
7 1 61900 59500 61000 56000 58300
7 2 60900 59100 60600 59000 61500
• Some changes on the number of transpallet and forklift
seems do not affect the production amounts seriously.
• Besides, sometimes it is observed that more production
amounts in the system in which less transporter units are
used.
41. • If the product is carried with box, the choice of transporter (transpallet or
forklift) is depends on the decision of the operator.
• The criterion of the selection is determined in terms of probability because the
exact criterion of that decision is not certain.
• This decision is based on the assumption that if the product is carried with
box it should be transferred by transpallet with % 50 probability and
transferred by forklift with % 50 probability.
• Since transpallet and forklift have different carrying capacities for
boxes, process times are entered to the system as distribution, not constant.
• Hence, variety in production amount is acceptable. If we look at only amounts
of products which are transported with cages we can see the direct proportion
between number of transporters and production quantity.
42.
43. • Assumptions of Regression
– Normality of the error terms: Error terms must be normally
distributed.
– Constant variance: The variance of distribution of the error
terms must be constant.
– Independency of the error terms: Error terms must be
statistically independent.
44. Normality of the Error
Terms
Analysis of Linearity
Residual Analysis for
Constant Variance
(Homoscedasticity)
Residual Analysis for
Independency
45. The regression equation is:
Y = 54749 + 1880 X1 - 2232 X2 - 112 X1^2 + 857 X2^2 -
170 X1X2
S = 2398,98 R-Sq = 14,1%
R-Sq(adj) = 3,0%
46. • Since increase on R-Sq and R-Sq(adj) is observed and p
value is decreased, it is decided to continue the RSM
process from this second order model
47. Canonical form
The regression equation is
Y = 57012 + 1540 X1 - 3363 X2 - 112 X1^2 + 857 X2^2
S = 2406,00 R-Sq = 11,3%
R-Sq(adj) = 2,5%
49. • Number of forklift and transpallet should be integer. Hence:
50. • are known as eigenvalues
or characteristic roots of the
matrix B.
• If the all are
negative, is a point of
maximum response,
• If the all are
positive, is a point of
minimum response,
• If the have different
signs, is a saddle
point.
51. However in our model
is a point of maximum
response.
Transpalet (X1) Forklift (X2) R1 R2 R3 R4 R5 Average
10 3 60500 54300 59900 57500 57500 57940
10 1 58400 58700 59800 58400 59100 58880
3 3 60900 59700 60000 57500 61400 59900
3 1 58100 57500 59700 56400 60700 58480
10 2 57500 61100 57500 60300 57500 58780
3 2 60900 56400 57500 50900 50900 55320
7 3 59200 61100 56400 61300 58200 59240
7 1 61900 59500 61000 56000 58300 59340
7 2 60900 59100 60600 59000 61500 60220
7 transpallets and 2 forklifts provide the highest amounts of production units.
54. Facility layout optimization and design implemented
model has the same situation of the model which has
no implementation of the facility layout.
Because of the system is already optimized the R-Sq
and R-Sq(adj) are very low.
However we continue with the Second order
metamodel:
The regression equation is
Y = 57019 + 1005 X1 + 1642 X2 - 90,5 X1^2 - 603
X2^2 + 123 X1X2
58. • Number of forklift and transpallet should be integer. Hence
59. • are known as eigenvalues
or characteristic roots of the
matrix B.
• If the all are
negative, is a point
of maximum response,
• If the all are
positive, is a point of
minimum response,
• If the have different
signs, is a saddle point.
60. • It is proven that the 7 transpallets
and 3 forklifts are efficient to
increase production amount by
running the simulation model with
upgrading number of forklift and
transpallet.
Transpalet(X1) Forklift(X2) R1 R2 R3 R4 R5 Average
10 3 59600 62400 62700 60400 60200 61060
10 1 58600 59300 61000 62500 60200 60320
3 3 60700 57800 61500 55800 62200 59600
3 1 62900 54600 60800 62200 62200 60540
10 2 60100 61900 62700 62500 60200 61480
3 2 62900 57800 61500 61300 62200 61140
7 3 61300 62900 60200 63000 63000 62080
7 1 59500 62200 60200 62100 63900 61580
7 2 62100 61900 60200 61700 63000 61780
61.
62. Current System • Alternative System 2
LAYOUT NOT OPTIMIZED LAYOUT NOT OPTIMIZED
RESPONSE SURFACE METHODOLOGY NOT APPLIED RESPONSE SURFACE METHODOLOGY APPLIED
NUMBER OF FORKLIFT 1 NUMBER OF FORKLIFT 2
NUMBER OF TRANSPALLET 6 NUMBER OF TRANSPALLET 7
TOTAL: 60000 TOTAL: 61500
Utilization of Forklift 85.412 Utilization of Forklift 45.635
Utilization of Transpallet 59.680 Utilization of Transpallet 59.768
• Alternative System 1 • Alternative System 3
LAYOUT OPTIMIZED LAYOUT OPTIMIZED
RESPONSE SURFACE METHODOLOGY NOT APPLIED RESPONSE SURFACE METHODOLOGY APPLIED
NUMBER OF FORKLIFT 1 NUMBER OF FORKLIFT 3
NUMBER OF TRANSPALLET 6 NUMBER OF TRANSPALLET 7
TOTAL: 62900 TOTAL: 63000
Utilization of Forklift 97.325 Utilization of Forklift 37.325
Utilization of Transpallet 59.505 Utilization of Transpallet 59.505
63.
64. Firstly works are begining modeling the current
system as realistic as possible with Simulation
software Arena.
After determining the most produced product of
the factory, All the data which are related to
production such as time studies , bill of materials,
downtimes, defect rates, cycle times are taken.
The second step of the work is adding second
product which is Hero Gömme Reservoir in
simulation model.
65. While doing this works in addition to the first step
of the work
Transportation times and distances informations
are added to the model.
According to product type cage and box capacities
are determined.
Relationship chart is constructed and Facility
Layout Optimization and Design is applied by
using Flap.
Response Surface Methodology are used to
determine the optimum number of transpalet and
forklift in factory.
66.
67. Work orders can be created according to customer
orders by this way WIP can be decreased and facility
becomes appropriate for Lean philosophy.
In this system injection machines work independently and
work orders are constant.
Schedule decision criteria can be added to simulation
model.
There is no scheduling method for assignment of work orders
to the machines.
68. There are two more lines in the real system. These can
be added.
We added two assembly lines
If simulation model decides which product will be
produced by checking demands and arranges which
product is going to be produced, how much, etc…
Modelcan be replicated monthly so, it can be analyzed
in long-term
Instead of daily