Downloaded 209 times
![Benchmark Specs
6/11/2014 8
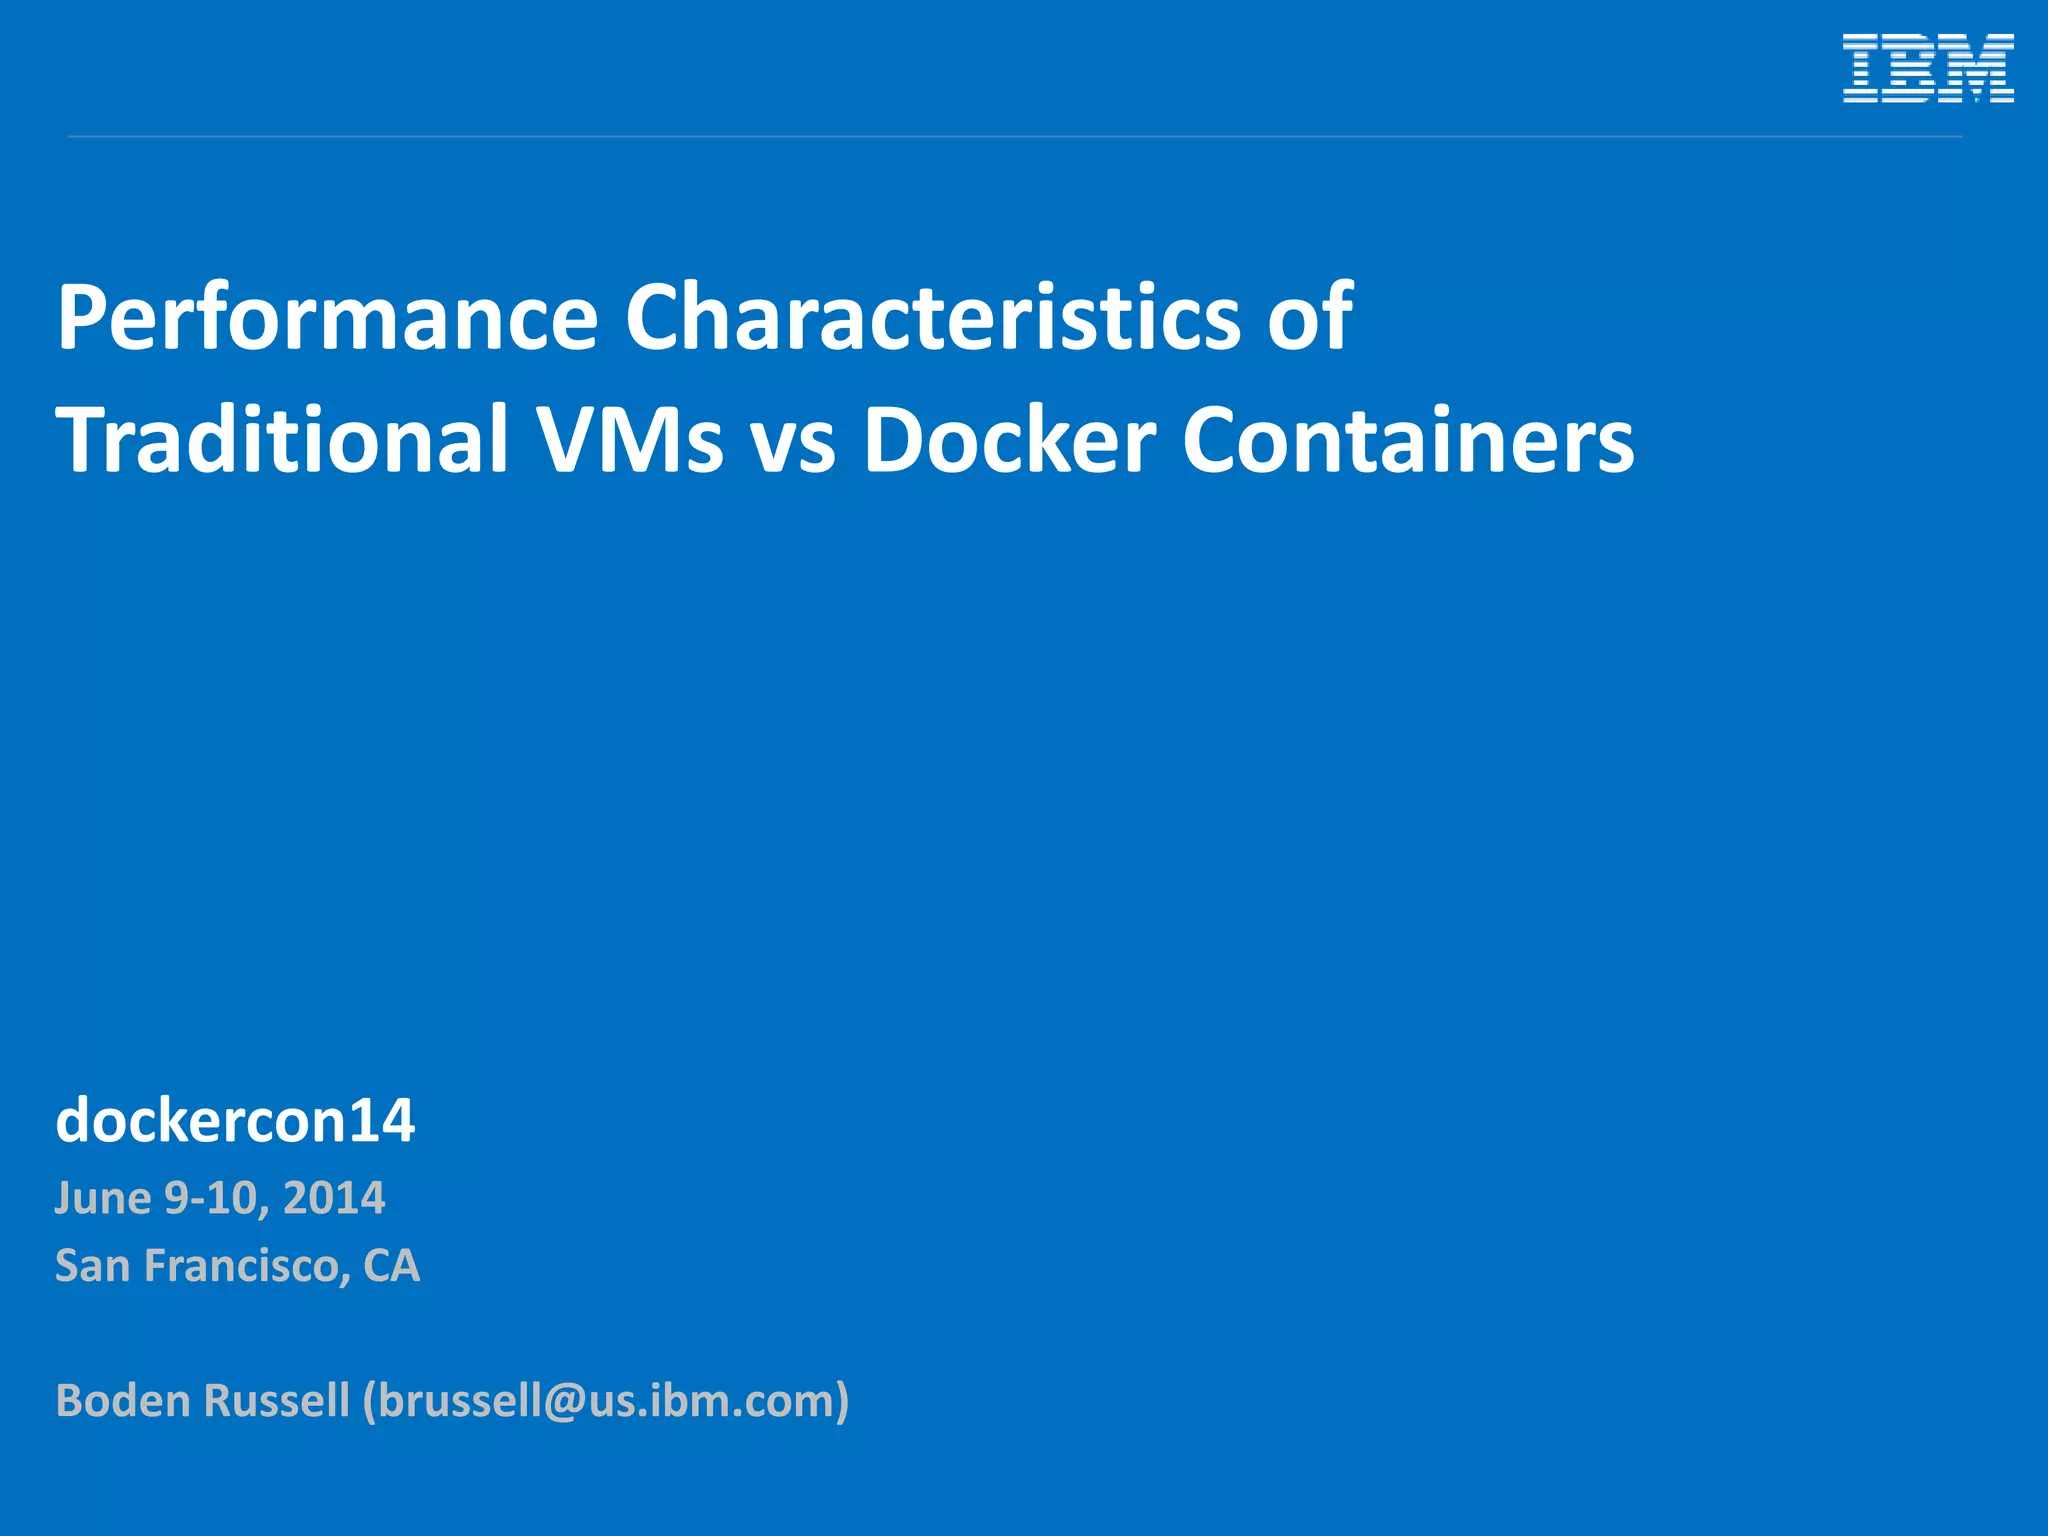
Spec Controller Node (4CPU x 8G RAM) Compute Node (16CPU x 96G RAM)
Environment Bare Metal @ SoftLayer Bare Metal @ SoftLayer
Mother Board SuperMicro X8SIE-F Intel Xeon QuadCore SingleProc SATA
[1Proc]
SuperMicro X8DTU-F_R2 Intel Xeon HexCore DualProc [2Proc]
CPU Intel Xeon-Lynnfield 3470-Quadcore [2.93GHz] (Intel Xeon-Westmere 5620-Quadcore [2.4GHz]) x 2
Memory (Kingston 4GB DDR3 2Rx8 4GB DDR3 2Rx8 [4GB]) x2 (Kingston 16GB DDR3 2Rx4 16GB DDR3 2Rx4 [16GB]) x 6
HDD (LOCAL) Digital WD Caviar RE3 WD5002ABYS [500GB]; SATAII Western Digital WD Caviar RE4 WD5003ABYX [500GB]; SATAII
NIC eth0/eth1 @ 100 Mbps eth0/eth1 @100 Mbps
Operating System Ubuntu 12.04 LTS 64bit Ubuntu 12.04 LTS 64bit
Kernel 3.5.0-48-generic 3.8.0-38-generic
IO Scheduler deadline deadline
Hypervisor tested NA - KVM 1.0 + virtio + KSM (memory deduplication)
- docker 0.10.0 + go1.2.1 + commit dc9c28f + AUFS
OpenStack Trunk master via devstack Trunk master via devstack. Libvirt KVM nova driver / nova-docker
virt driver
OpenStack Benchmark
Client
OpenStack project rally NA
Metrics Collection NA dstat
Guest Benchmark Driver NA - Sysbench 0.4.12
- mbw 1.1.1.-2
- iibench (py)
- netperf 2.5.0-1
- Blogbench 1.1
- cpu_bench.py
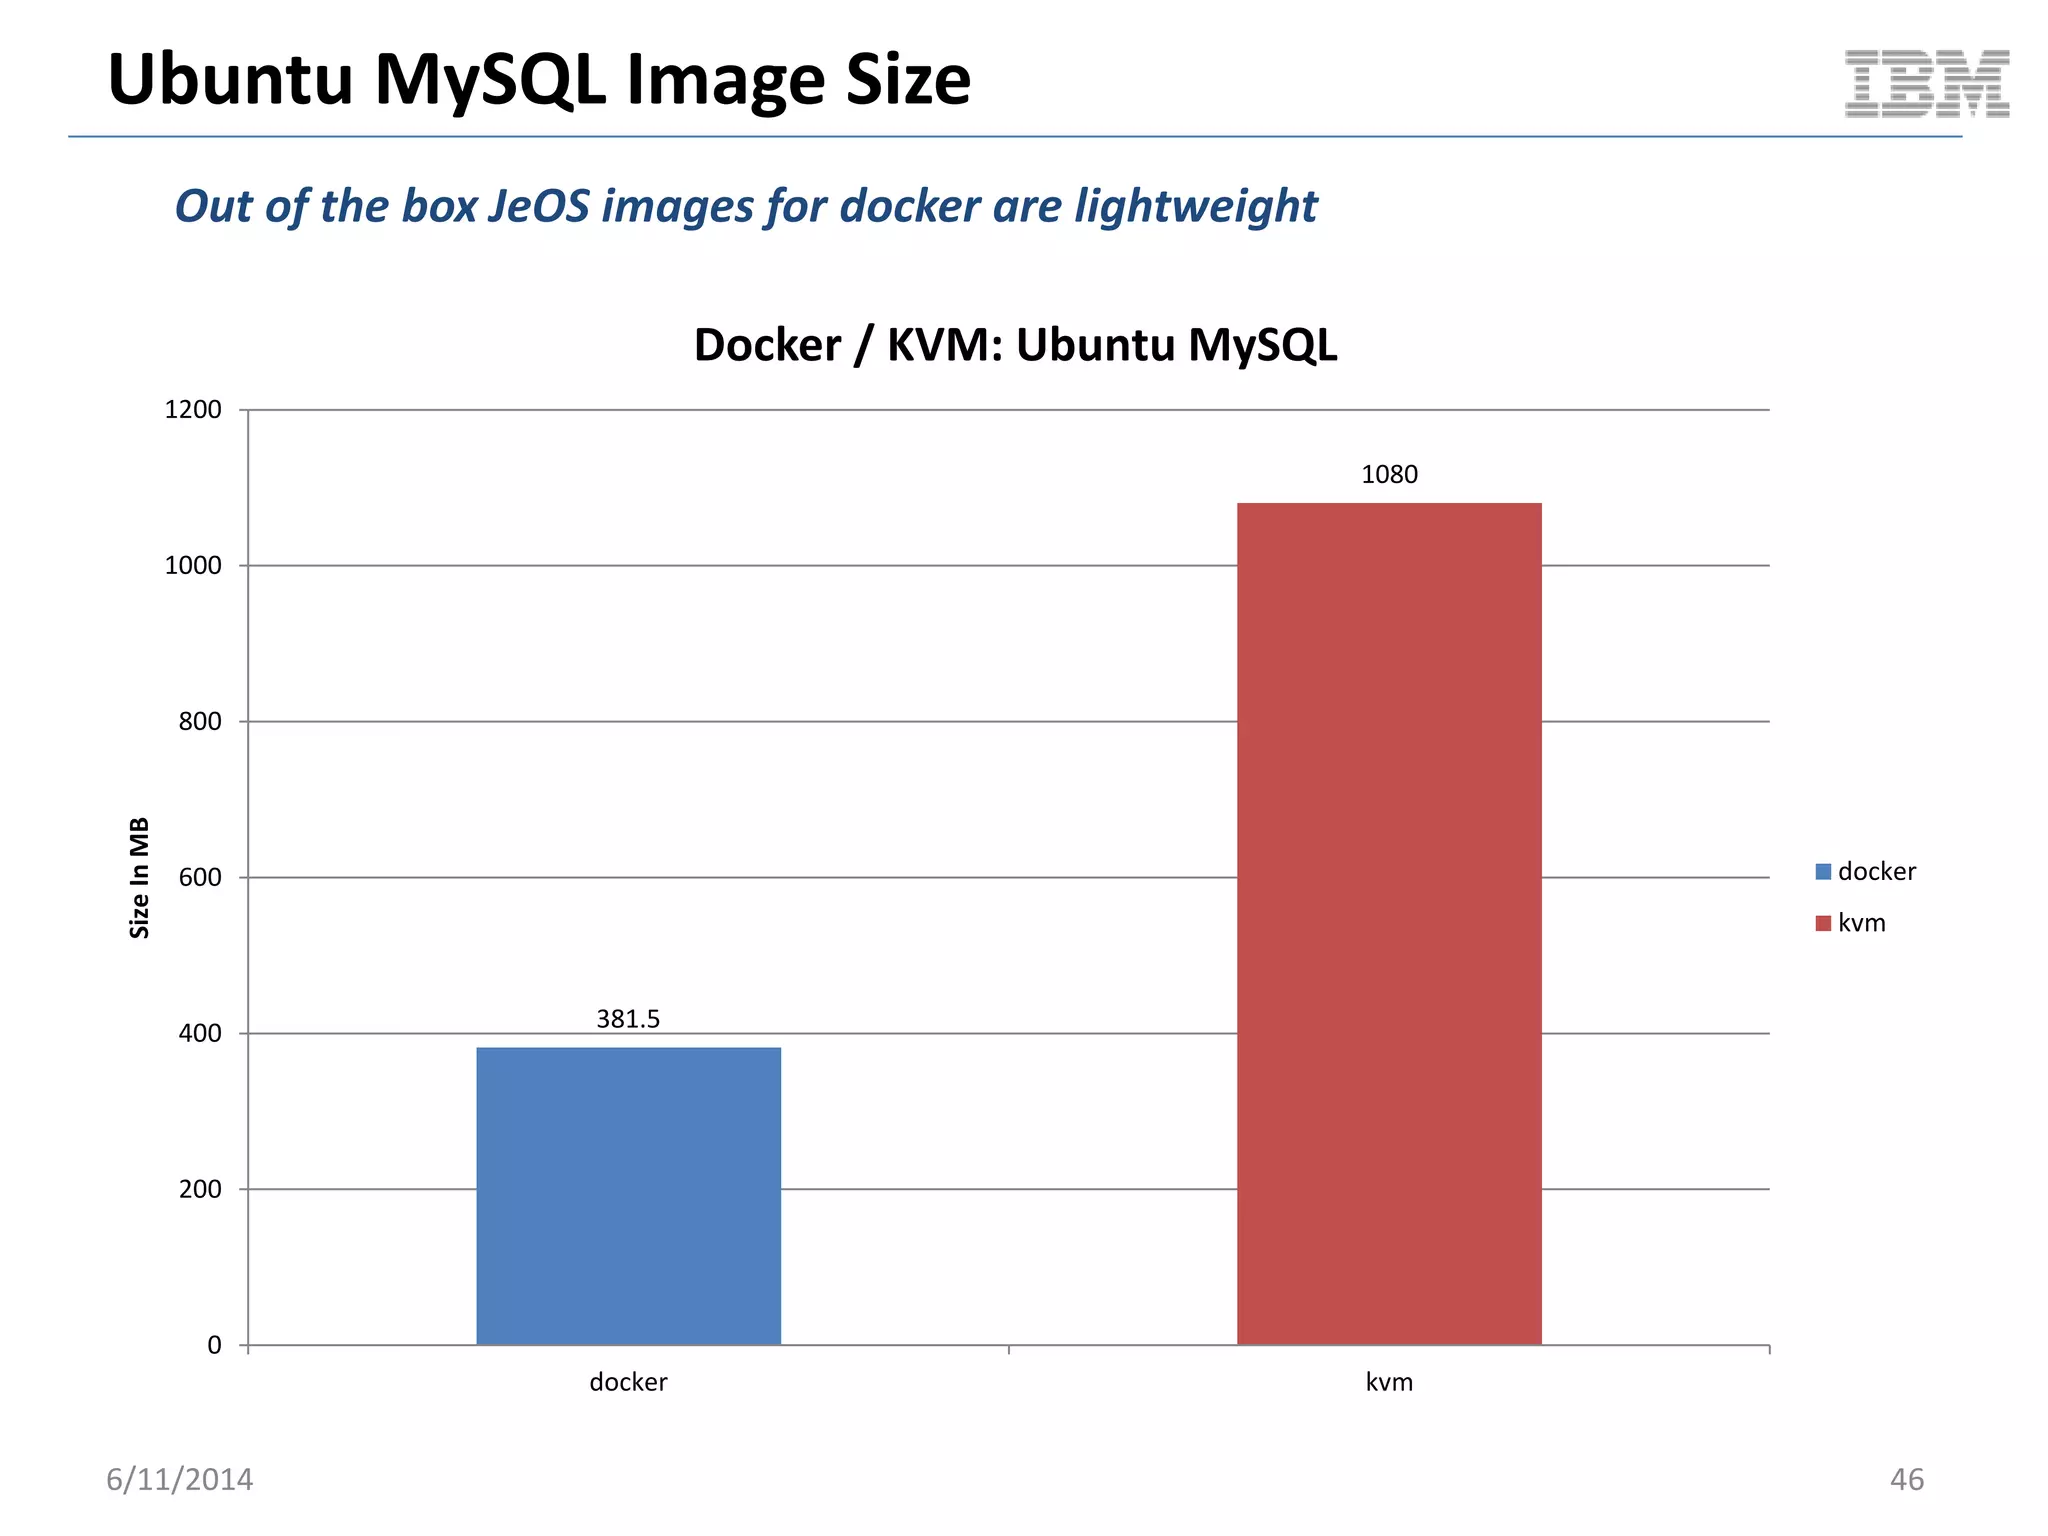
VM Image NA - Scenario 1 (KVM): official ubuntu 12.04 image + mysql
snapshotted and exported to qcow2 – 1080 MB
- Scenario 2 (docker): guillermo/mysql -- 381.5 MB
Hosted @](https://image.slidesharecdn.com/performancecharacteristicsoftraditionalvmsvsdockercontainersdockercon14-140611165259-phpapp02/75/Performance-characteristics-of-traditional-v-ms-vs-docker-containers-dockercon14-8-2048.jpg)


![Guest Ops: Block I/O
Tested with [standard] AUFS
6/11/2014 41
845 822
0
100
200
300
400
500
600
700
800
900
Bare Metal docker
MB/s
Async I/O
dd if=/dev/zero of=/tmp/d4g bs=4G count=1
Bare Metal
docker
90.1 87.2
0
10
20
30
40
50
60
70
80
90
100
Bare Metal docker
MB/s
Sync Data Write
dd if=/dev/zero of=/tmp/d4g bs=4G count=1 oflag=dsync
Bare Metal
docker
89.2 89
0
10
20
30
40
50
60
70
80
90
100
Bare Metal docker
MB/s
Sync Data / Metadata Write
dd if=/dev/zero of=/tmp/d4g bs=4G count=1 oflag=sync
Bare Metal
docker](https://image.slidesharecdn.com/performancecharacteristicsoftraditionalvmsvsdockercontainersdockercon14-140611165259-phpapp02/75/Performance-characteristics-of-traditional-v-ms-vs-docker-containers-dockercon14-41-2048.jpg)
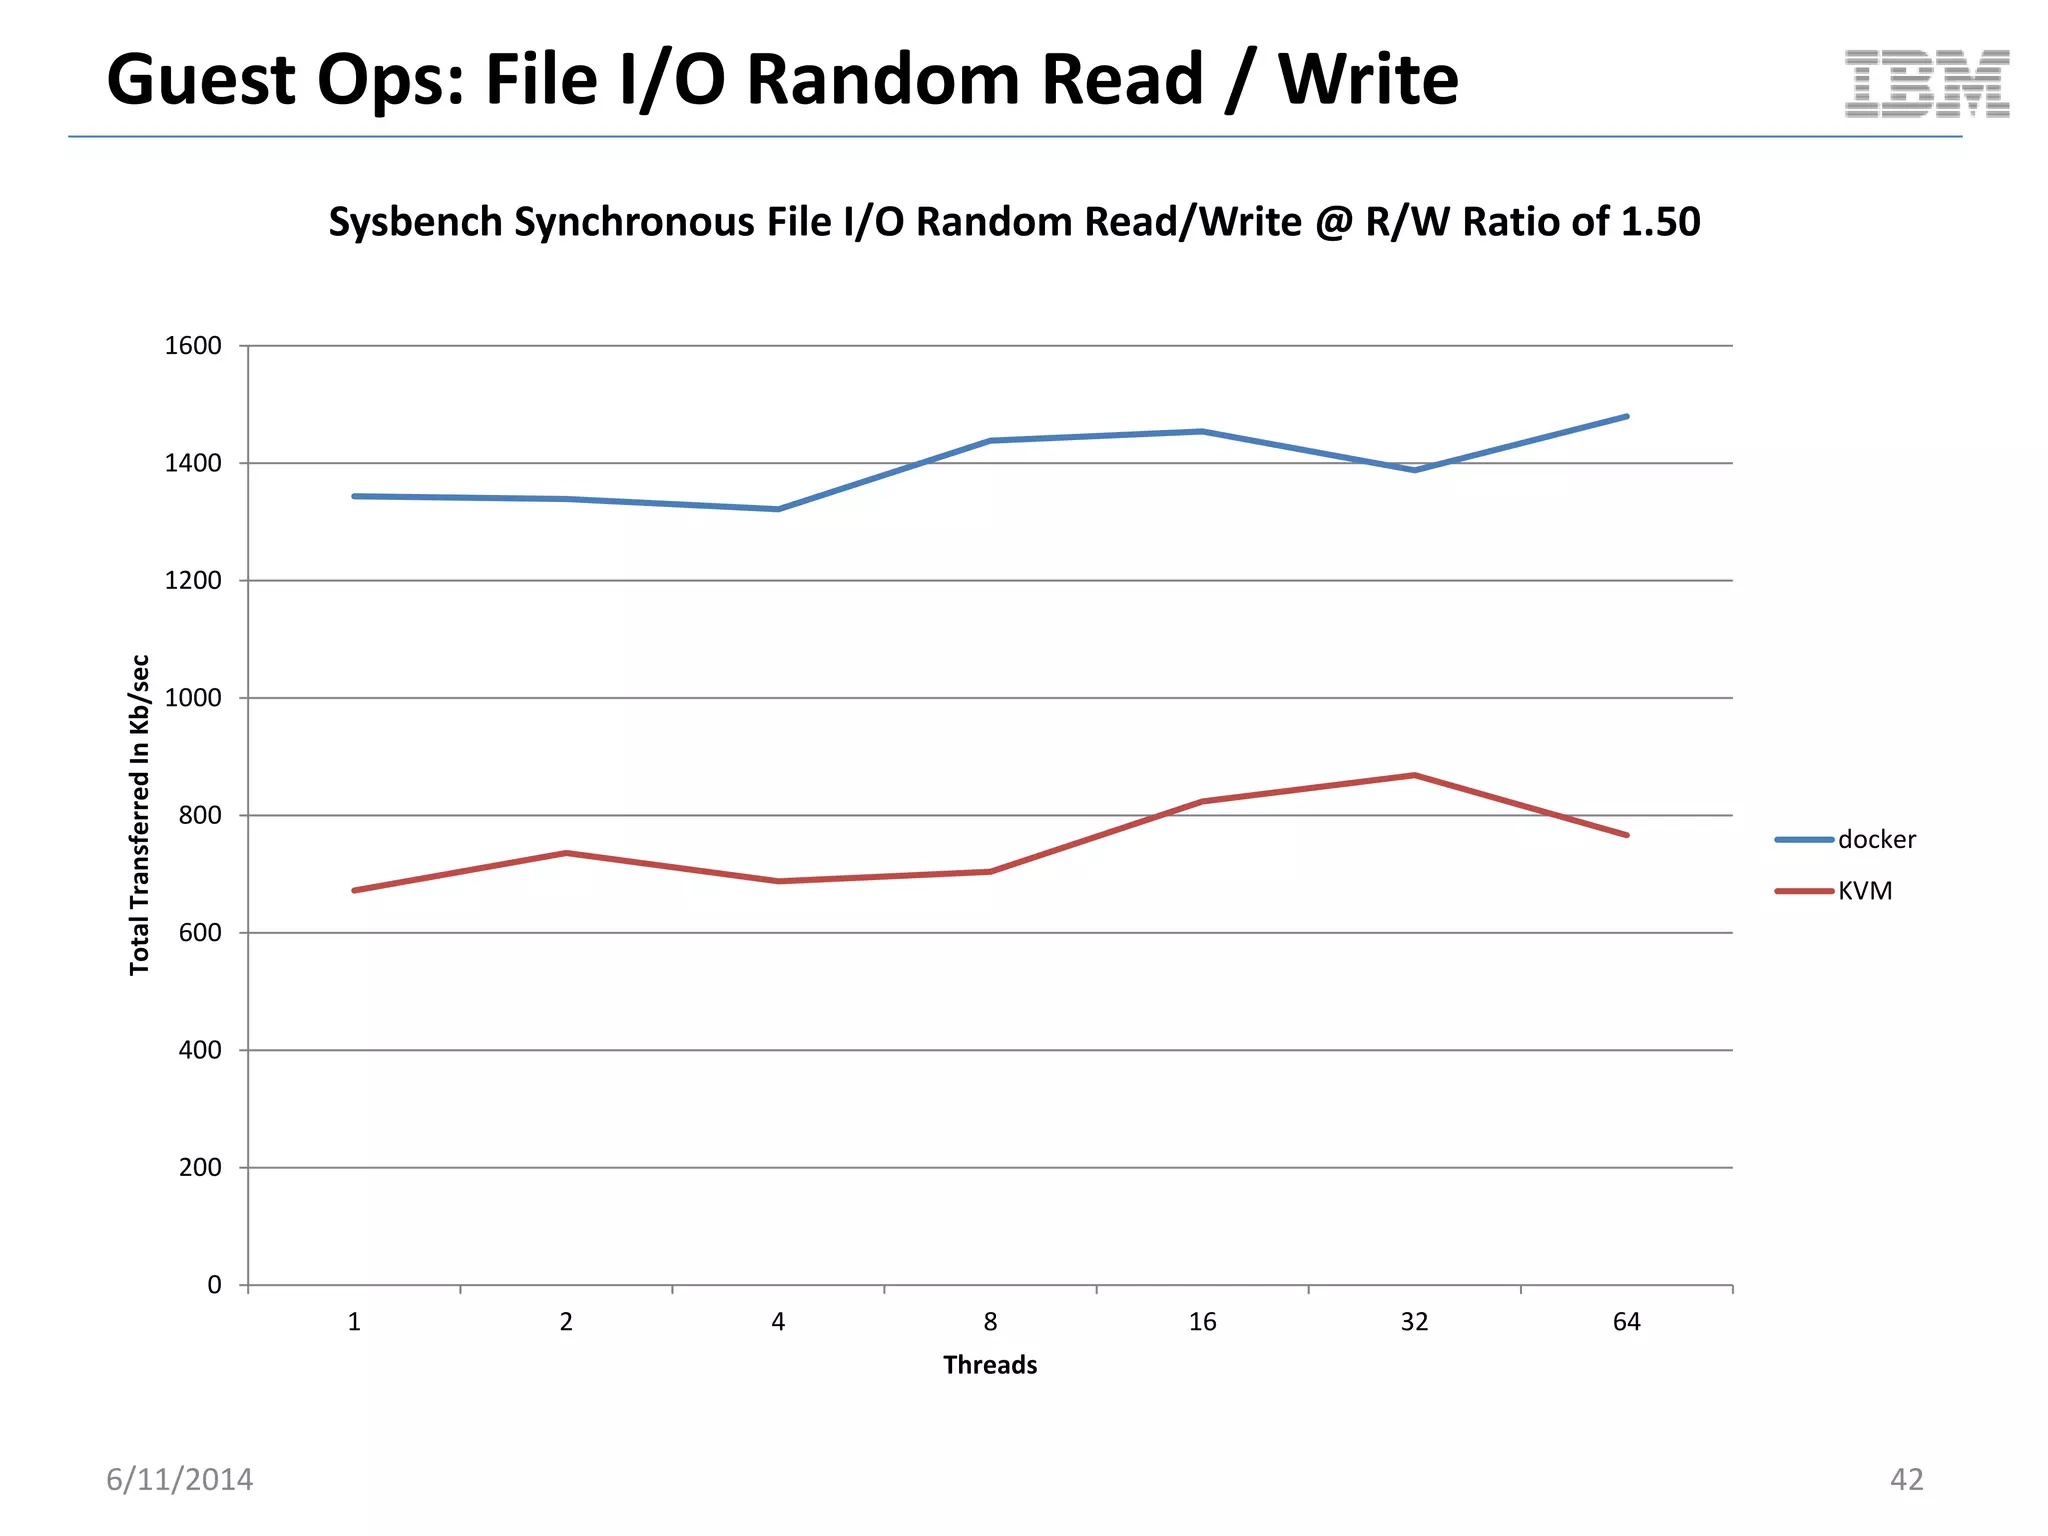


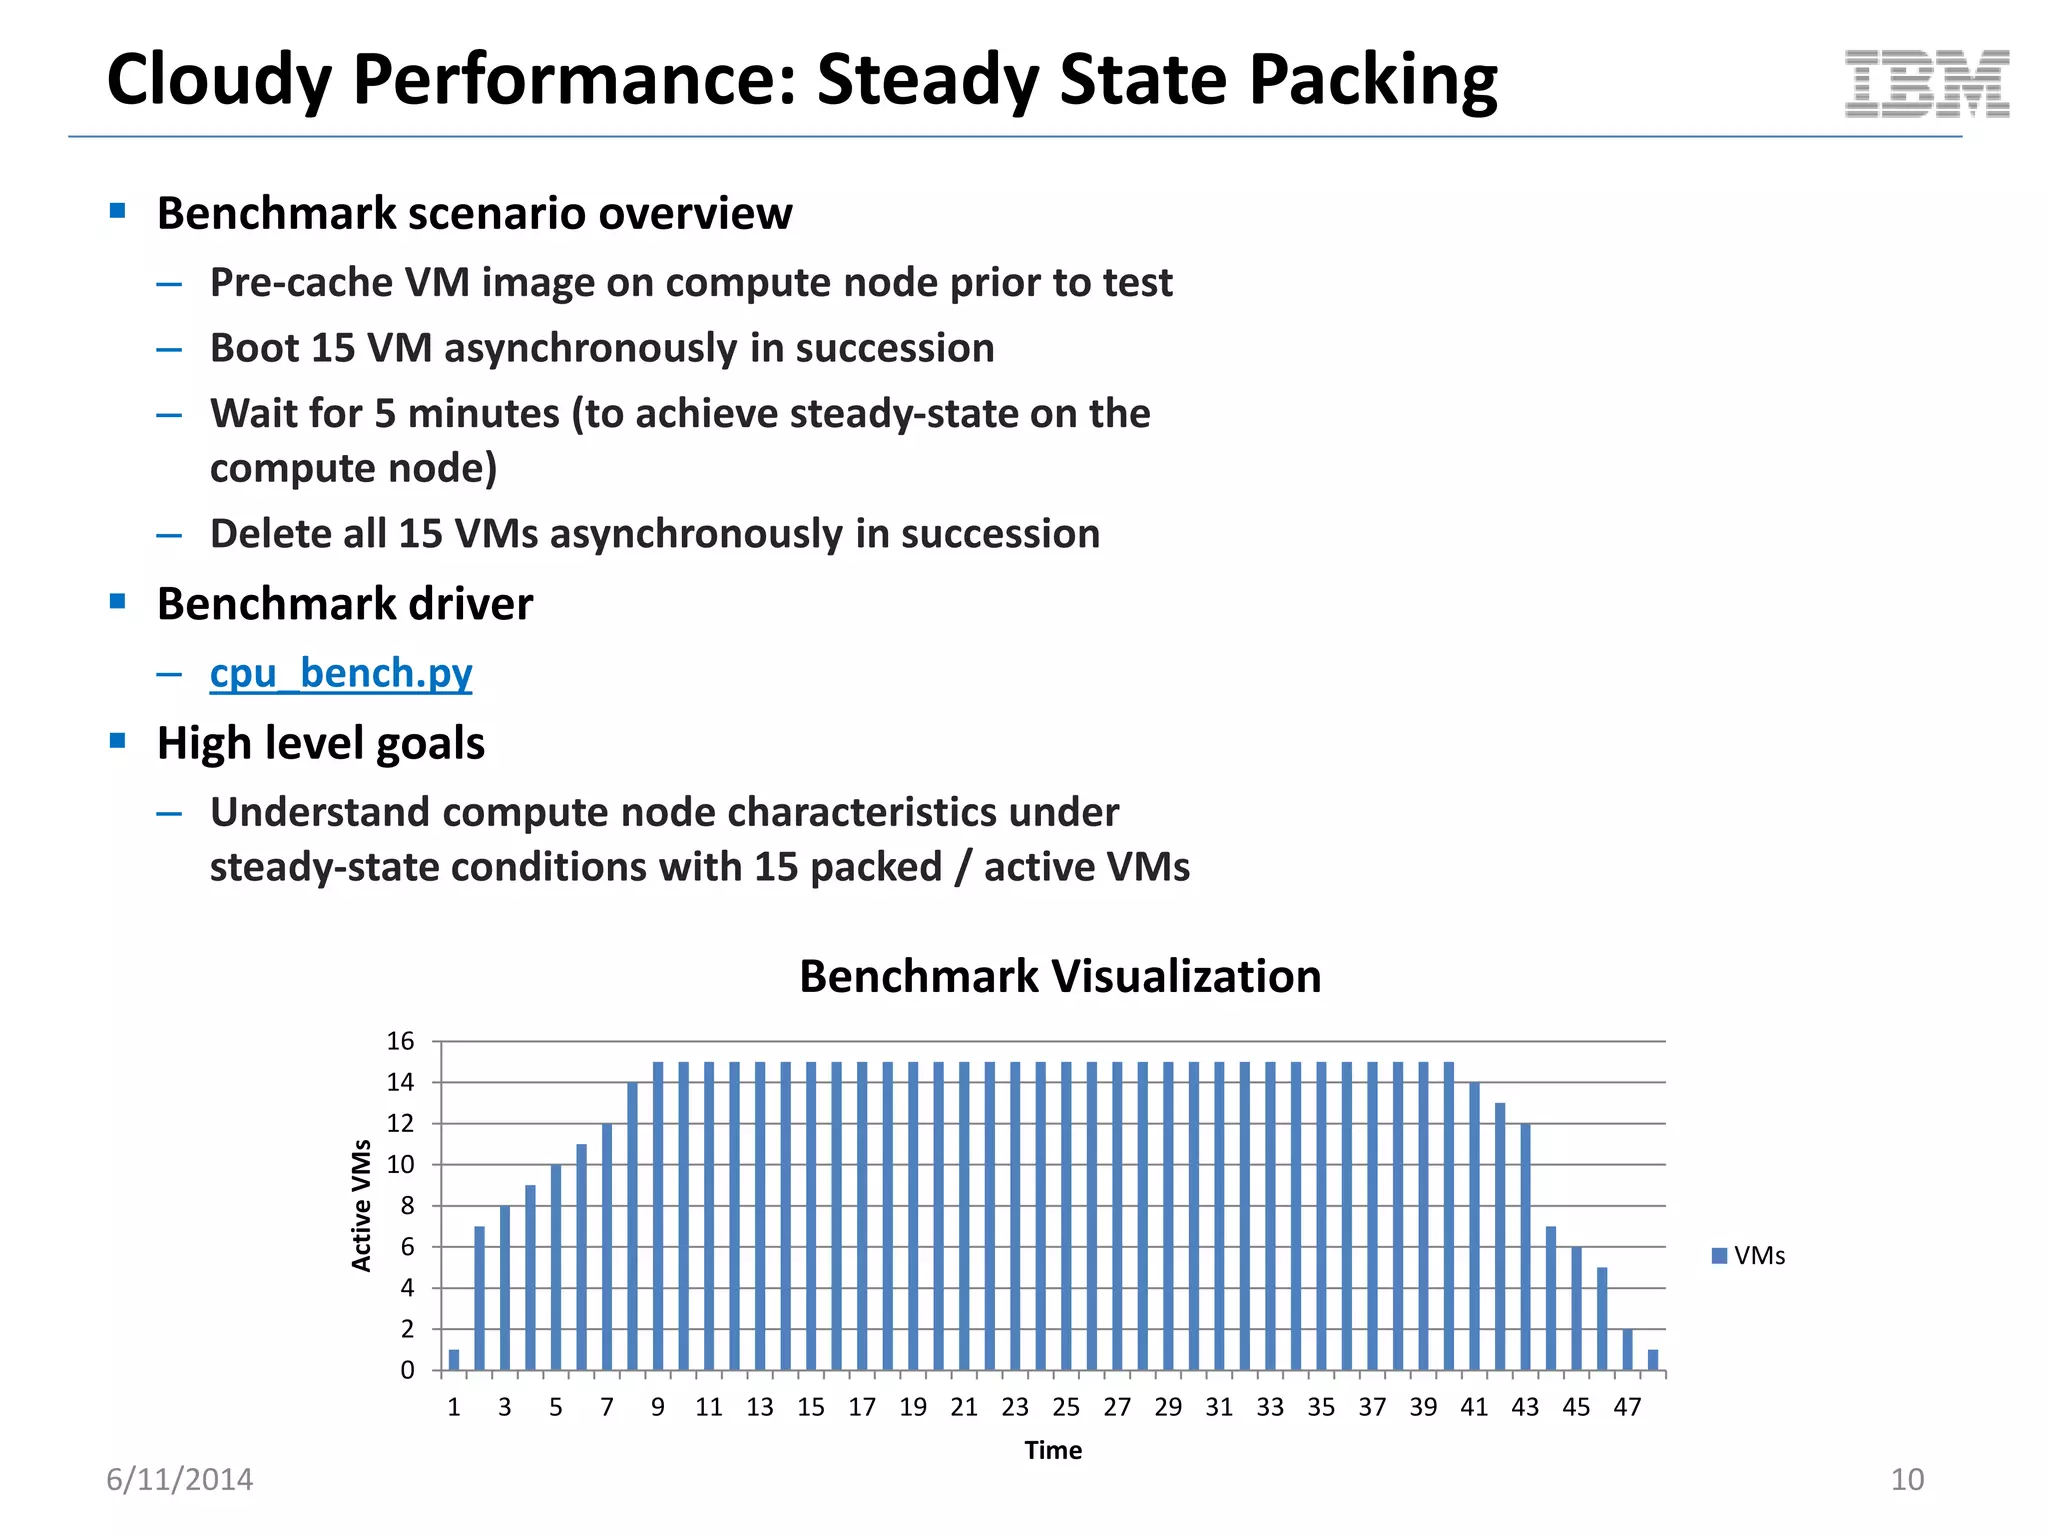
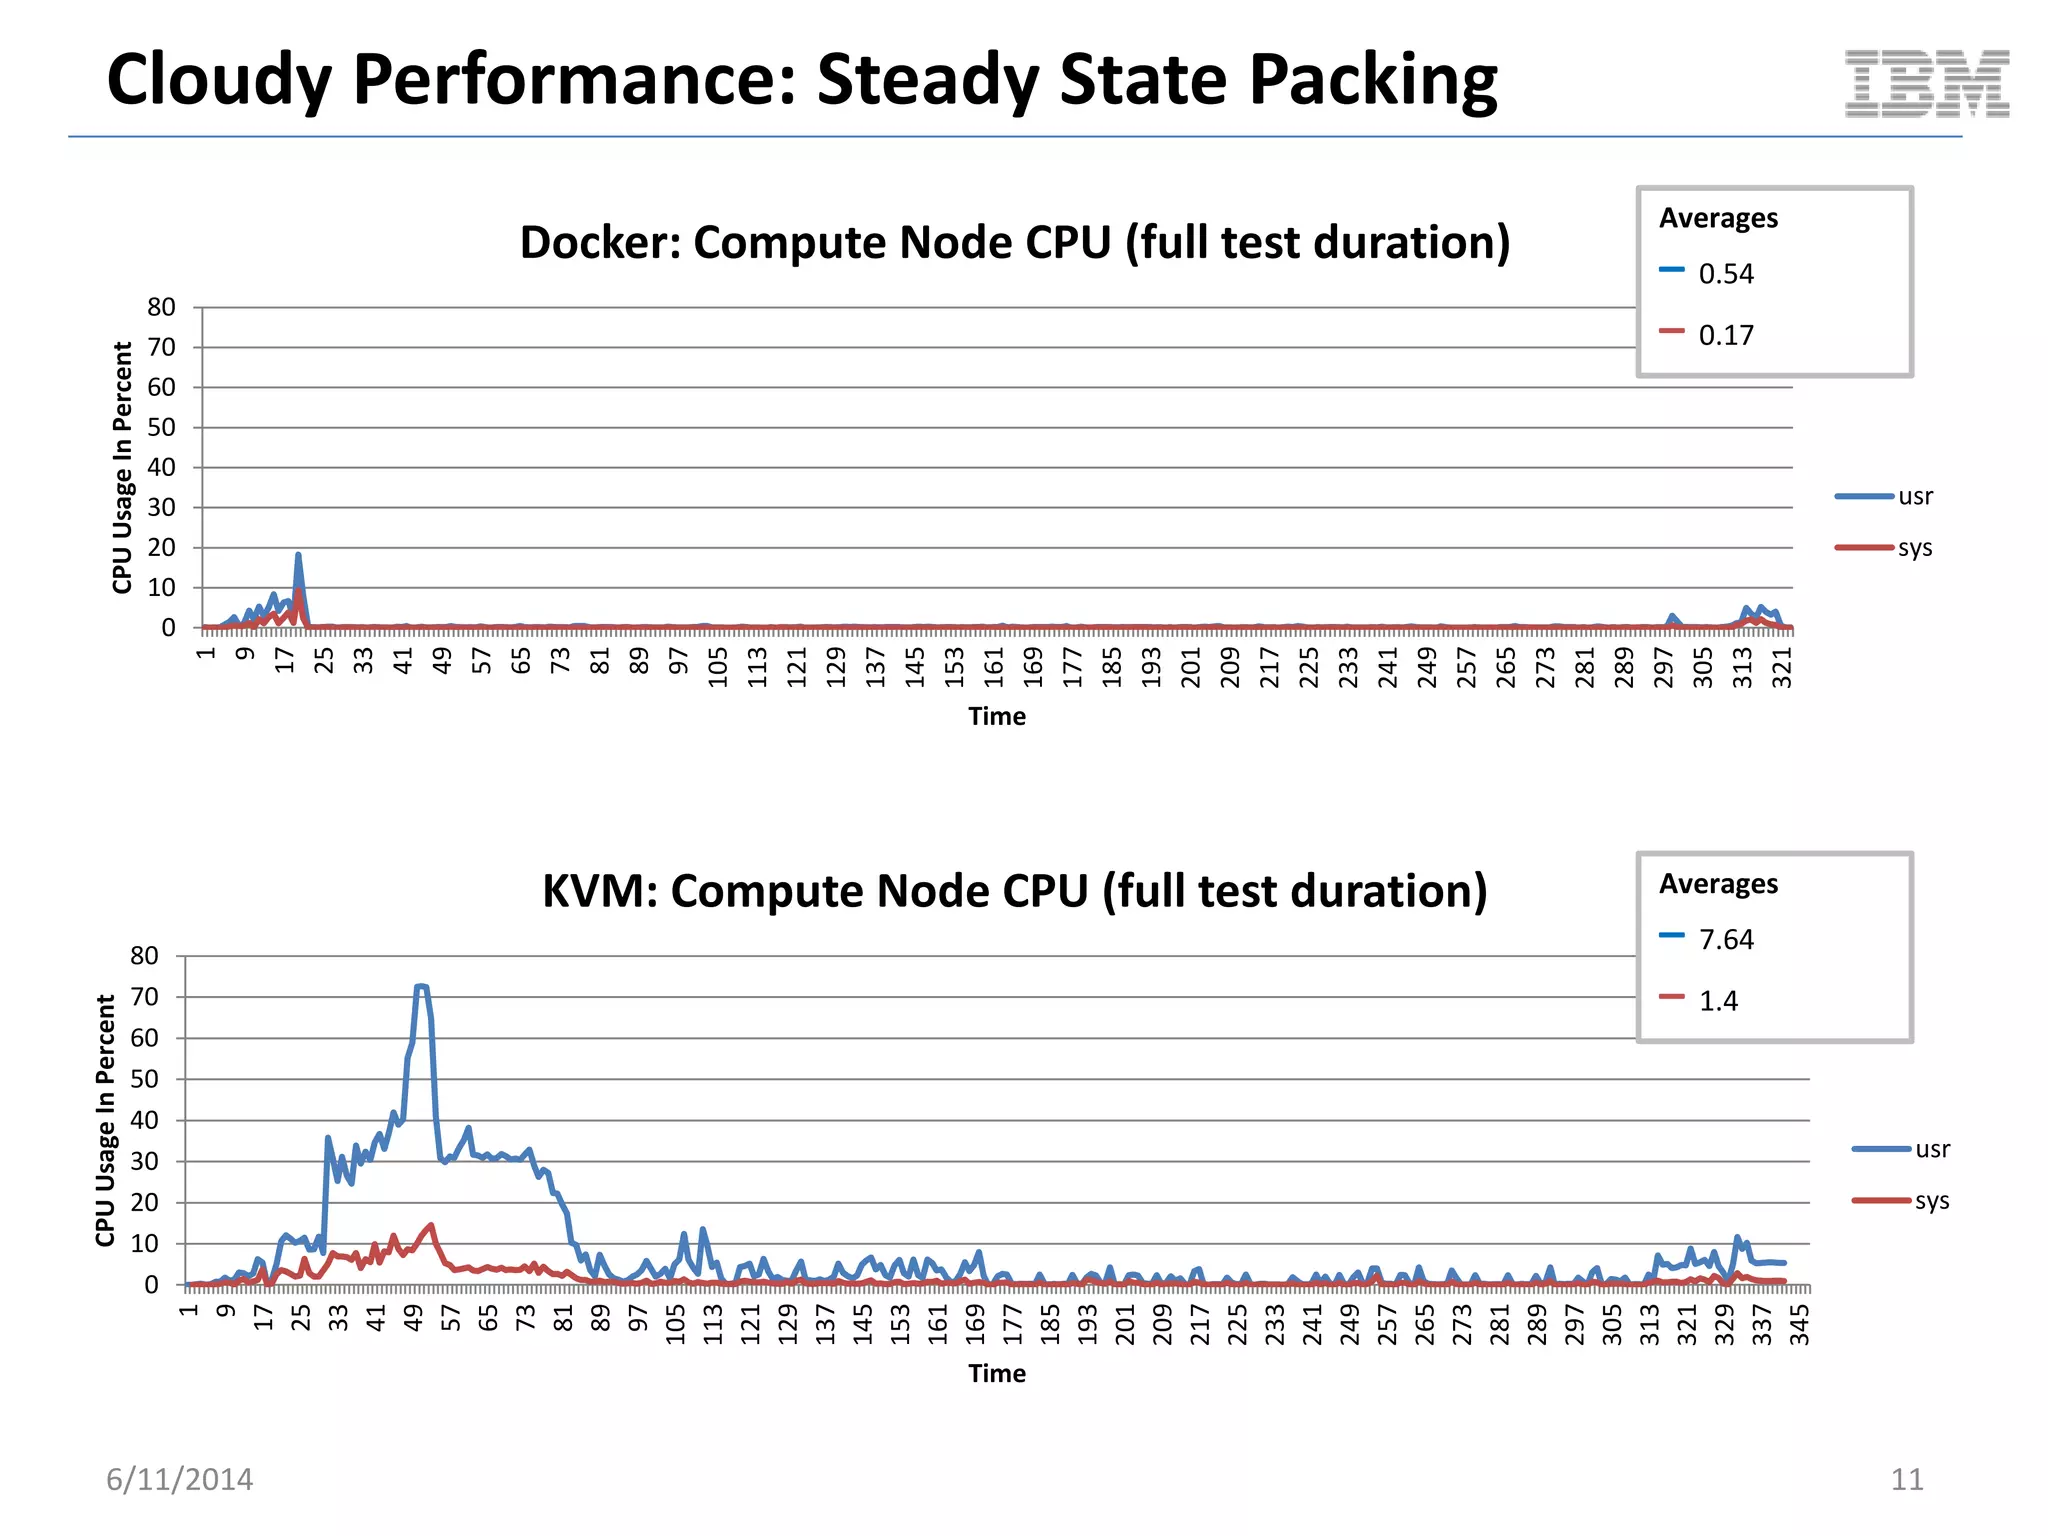
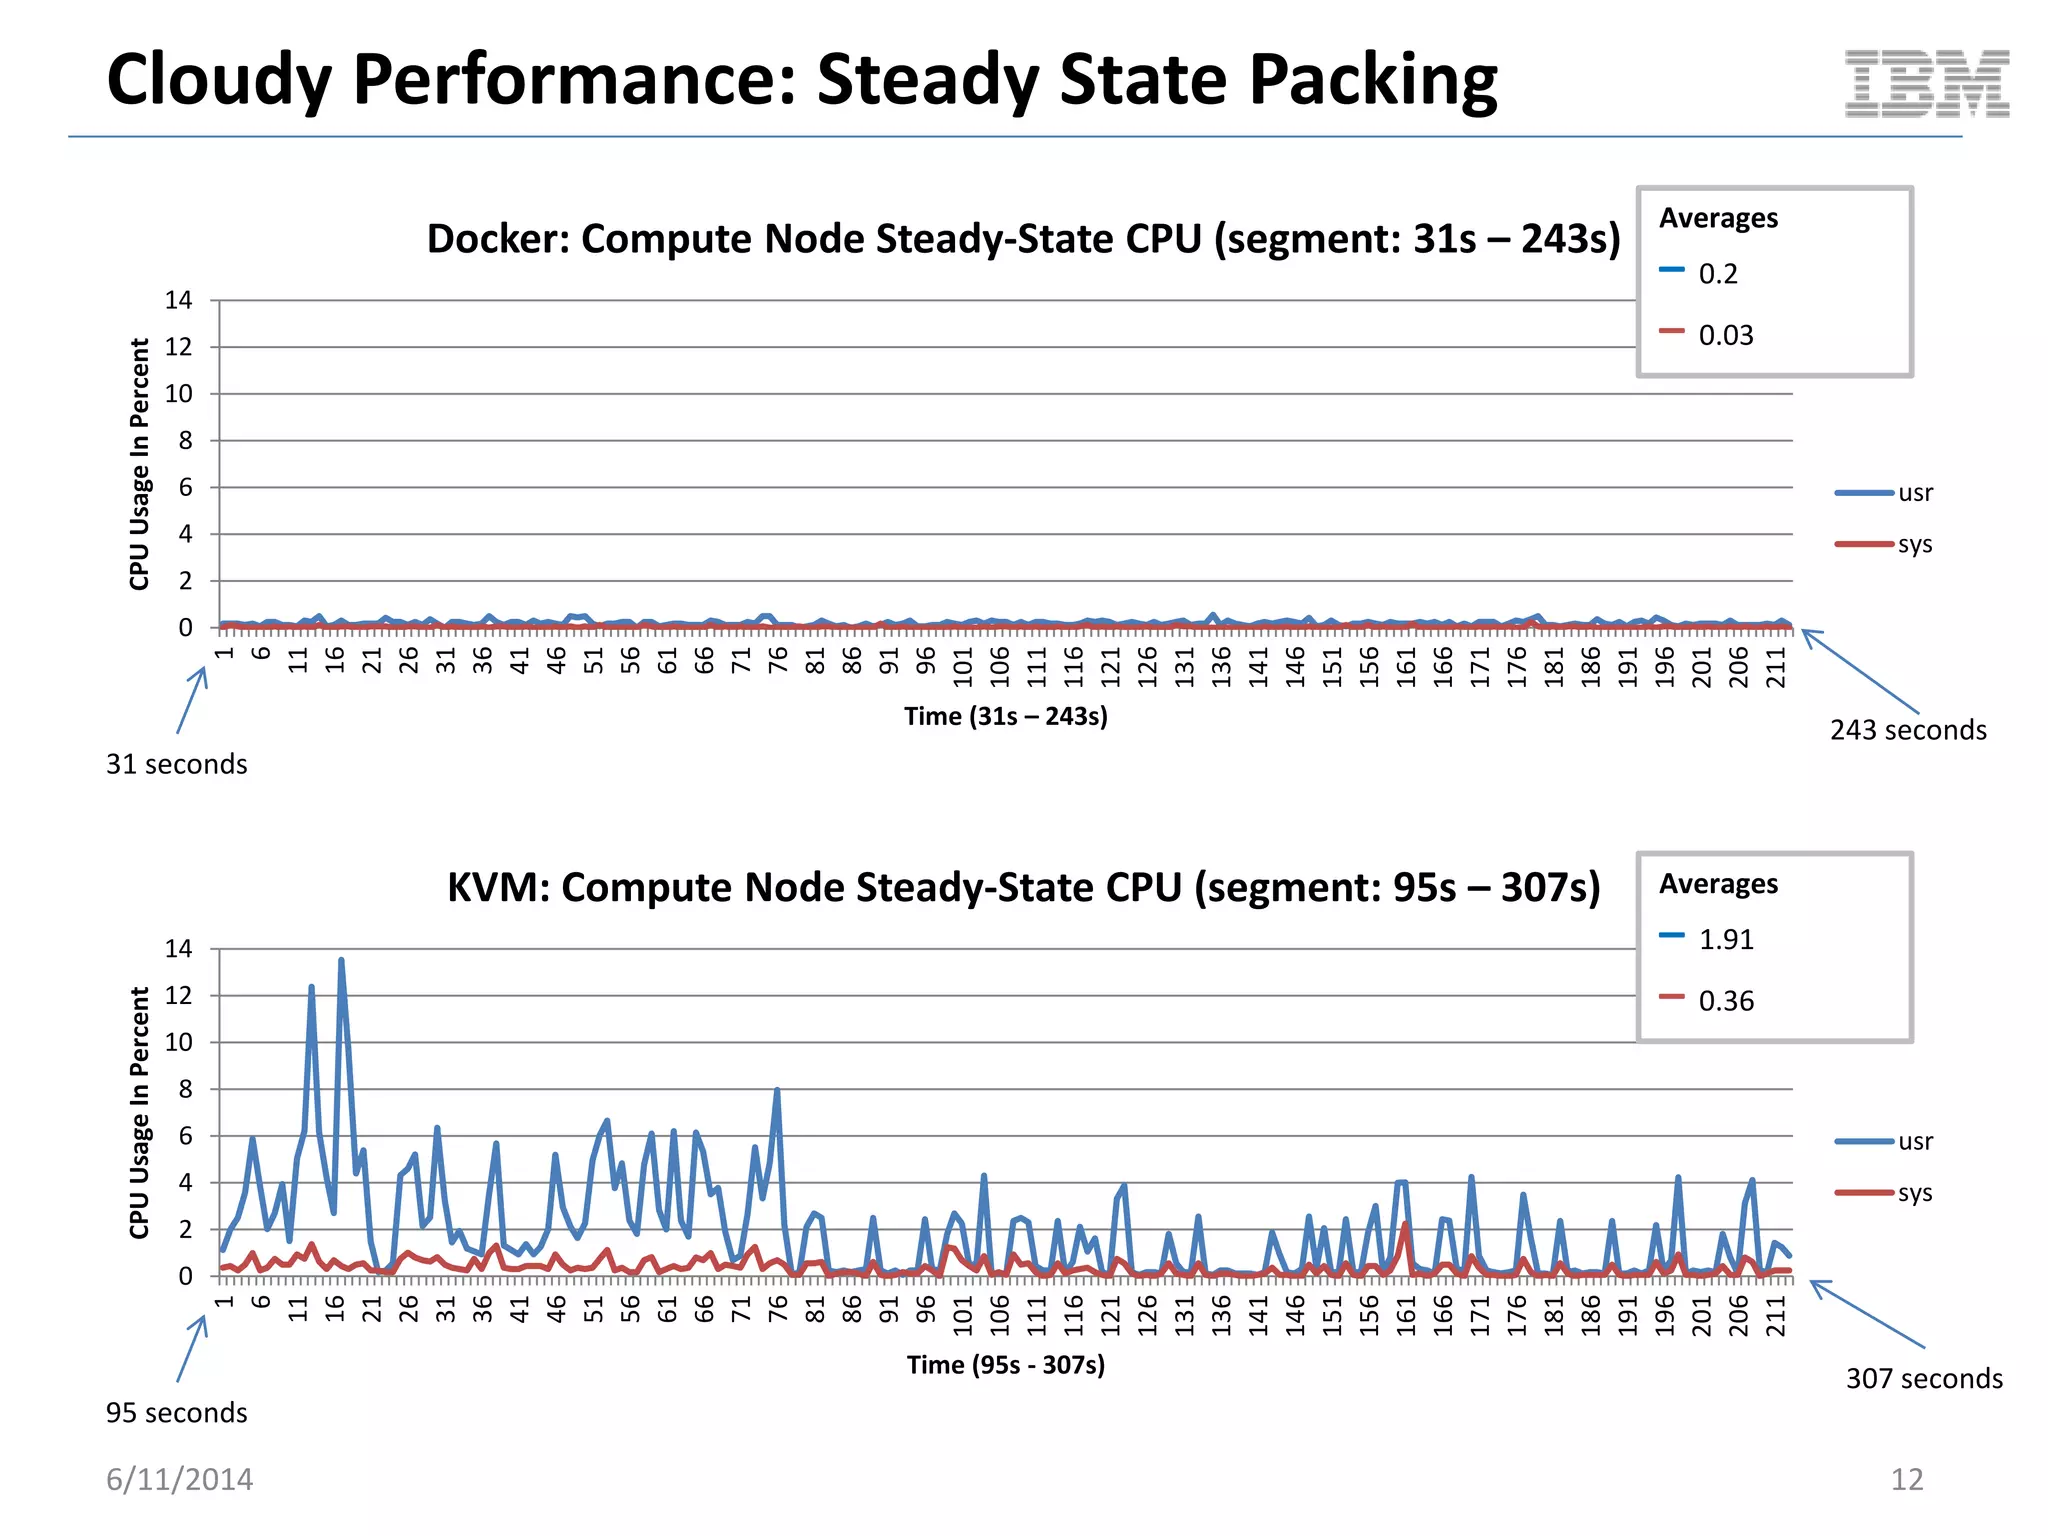
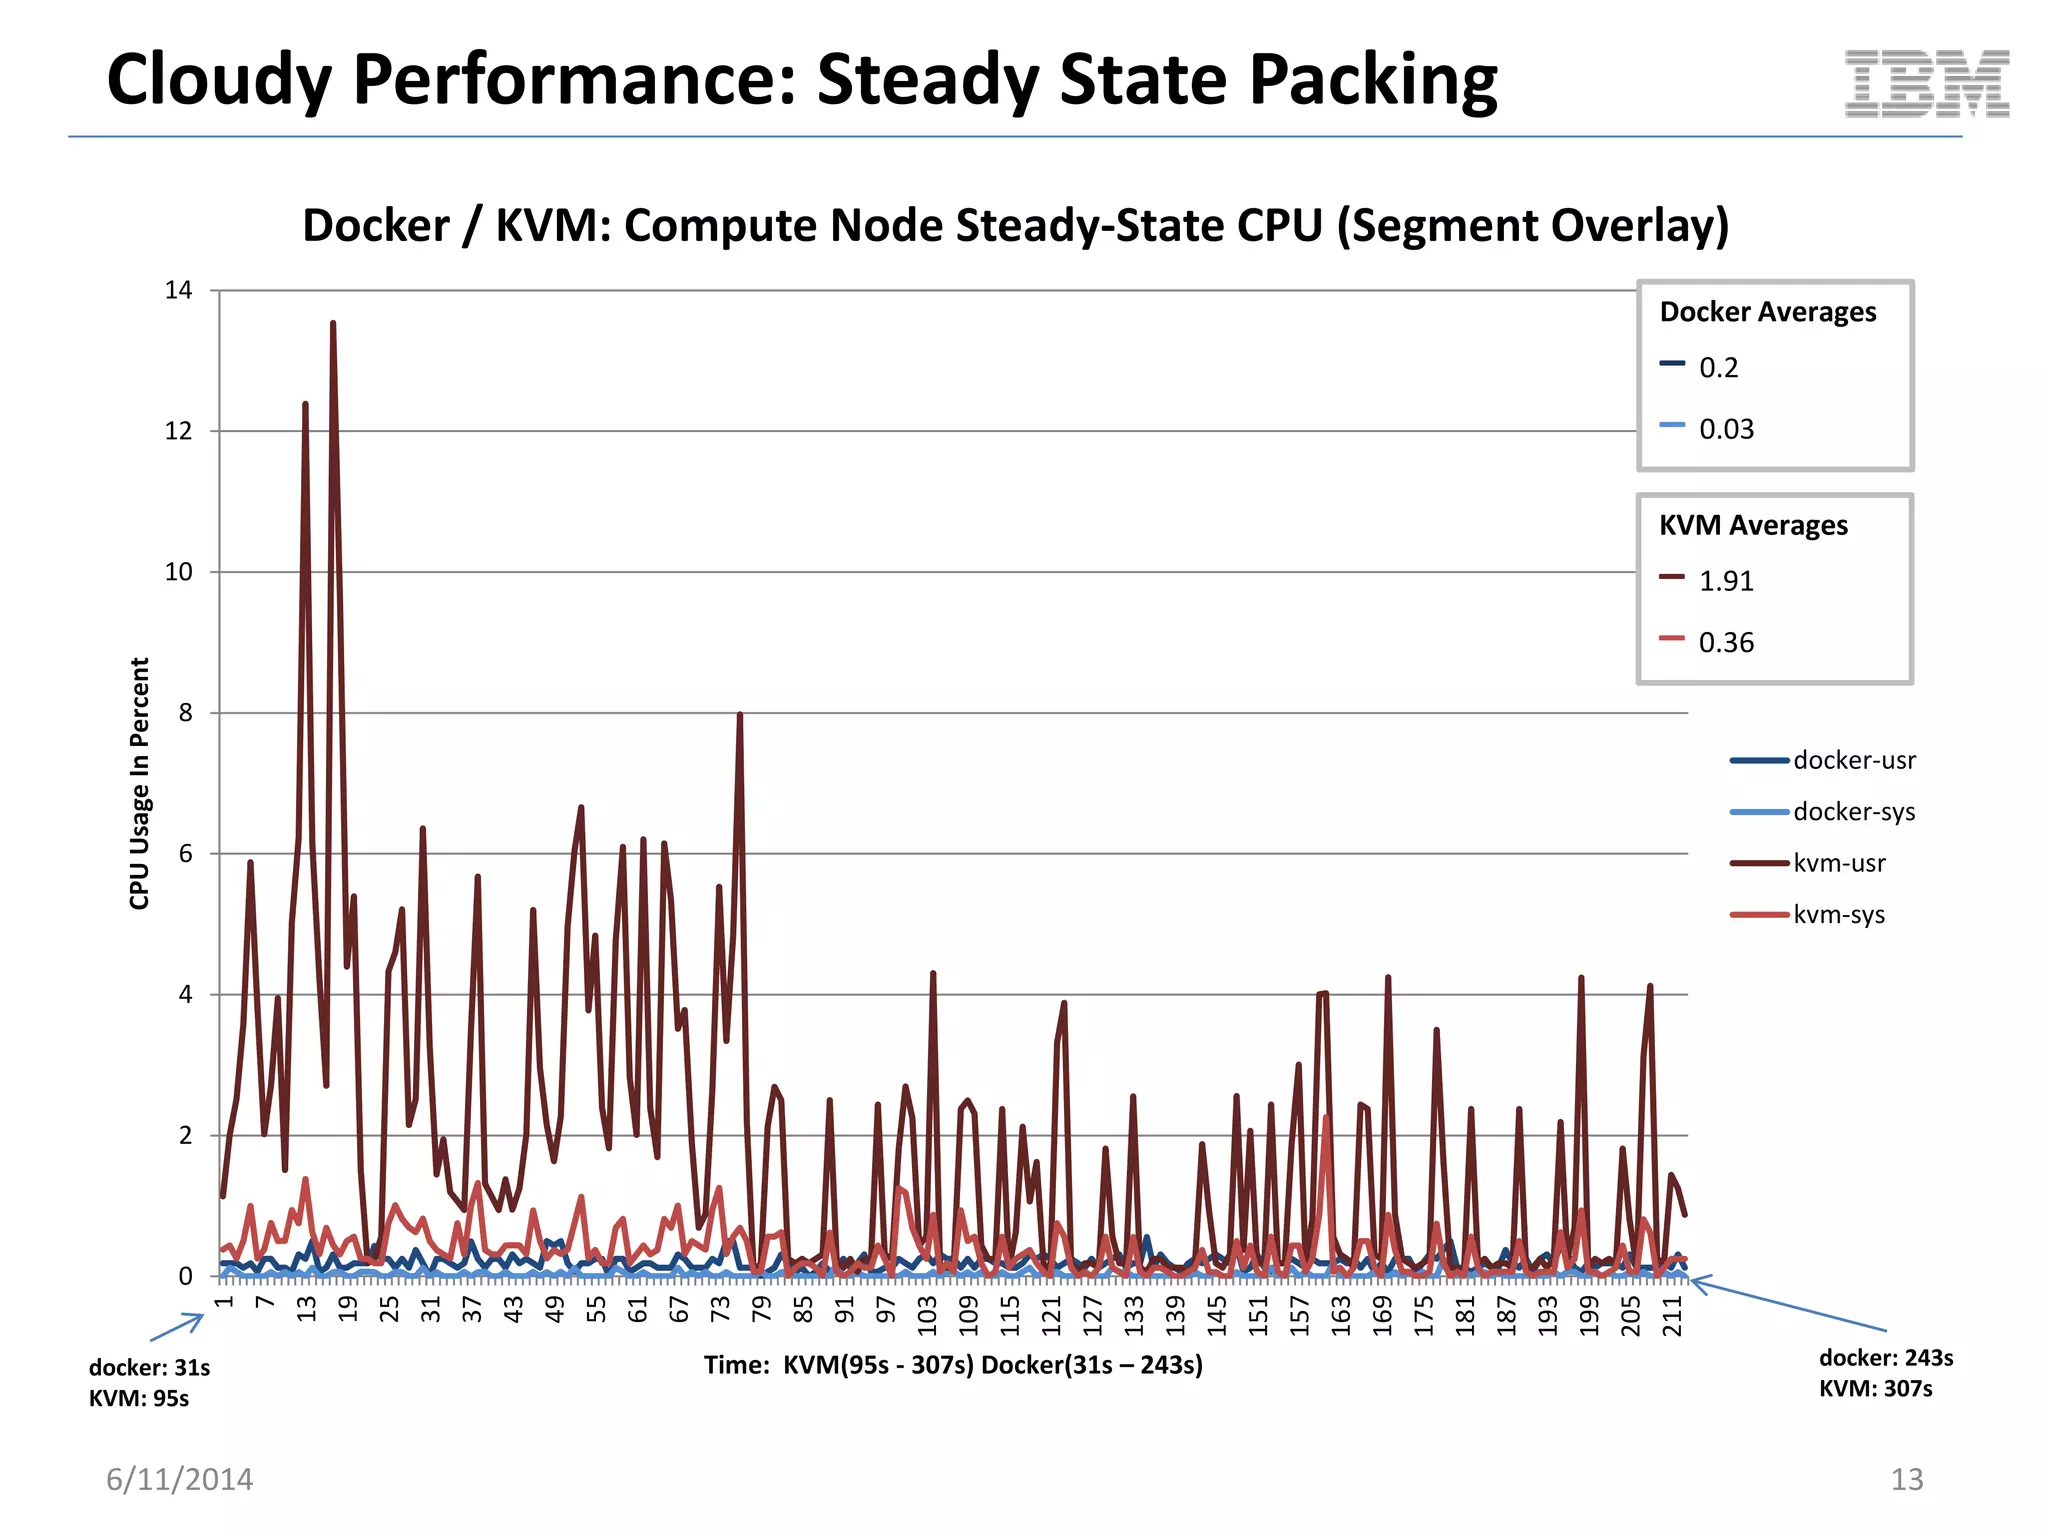
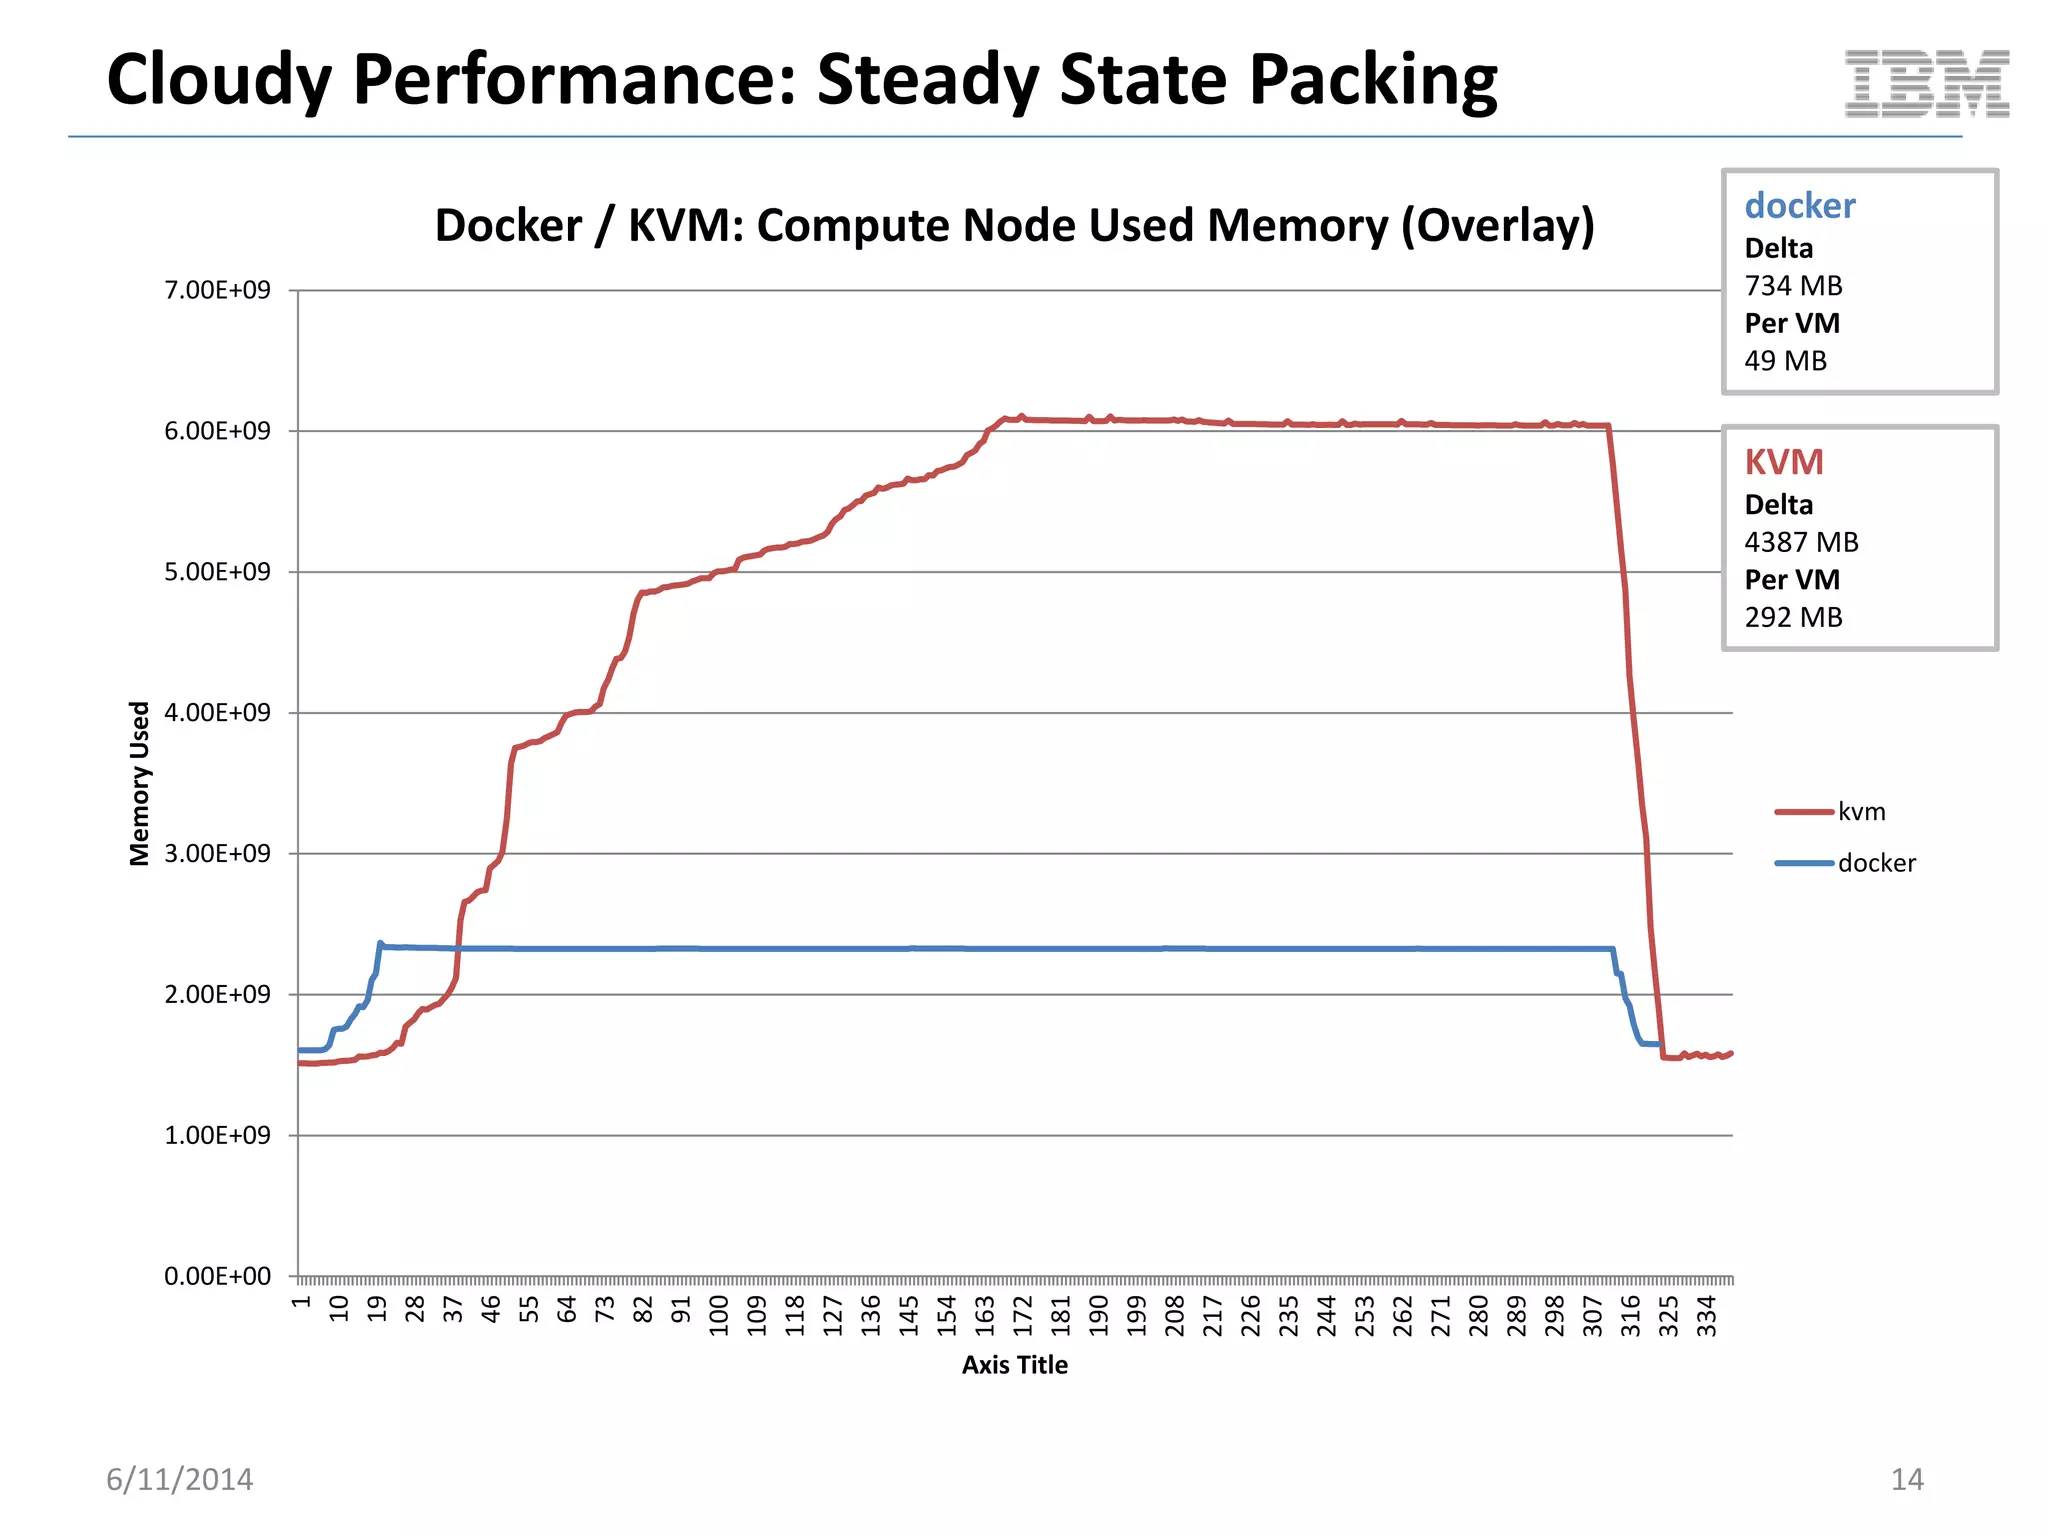
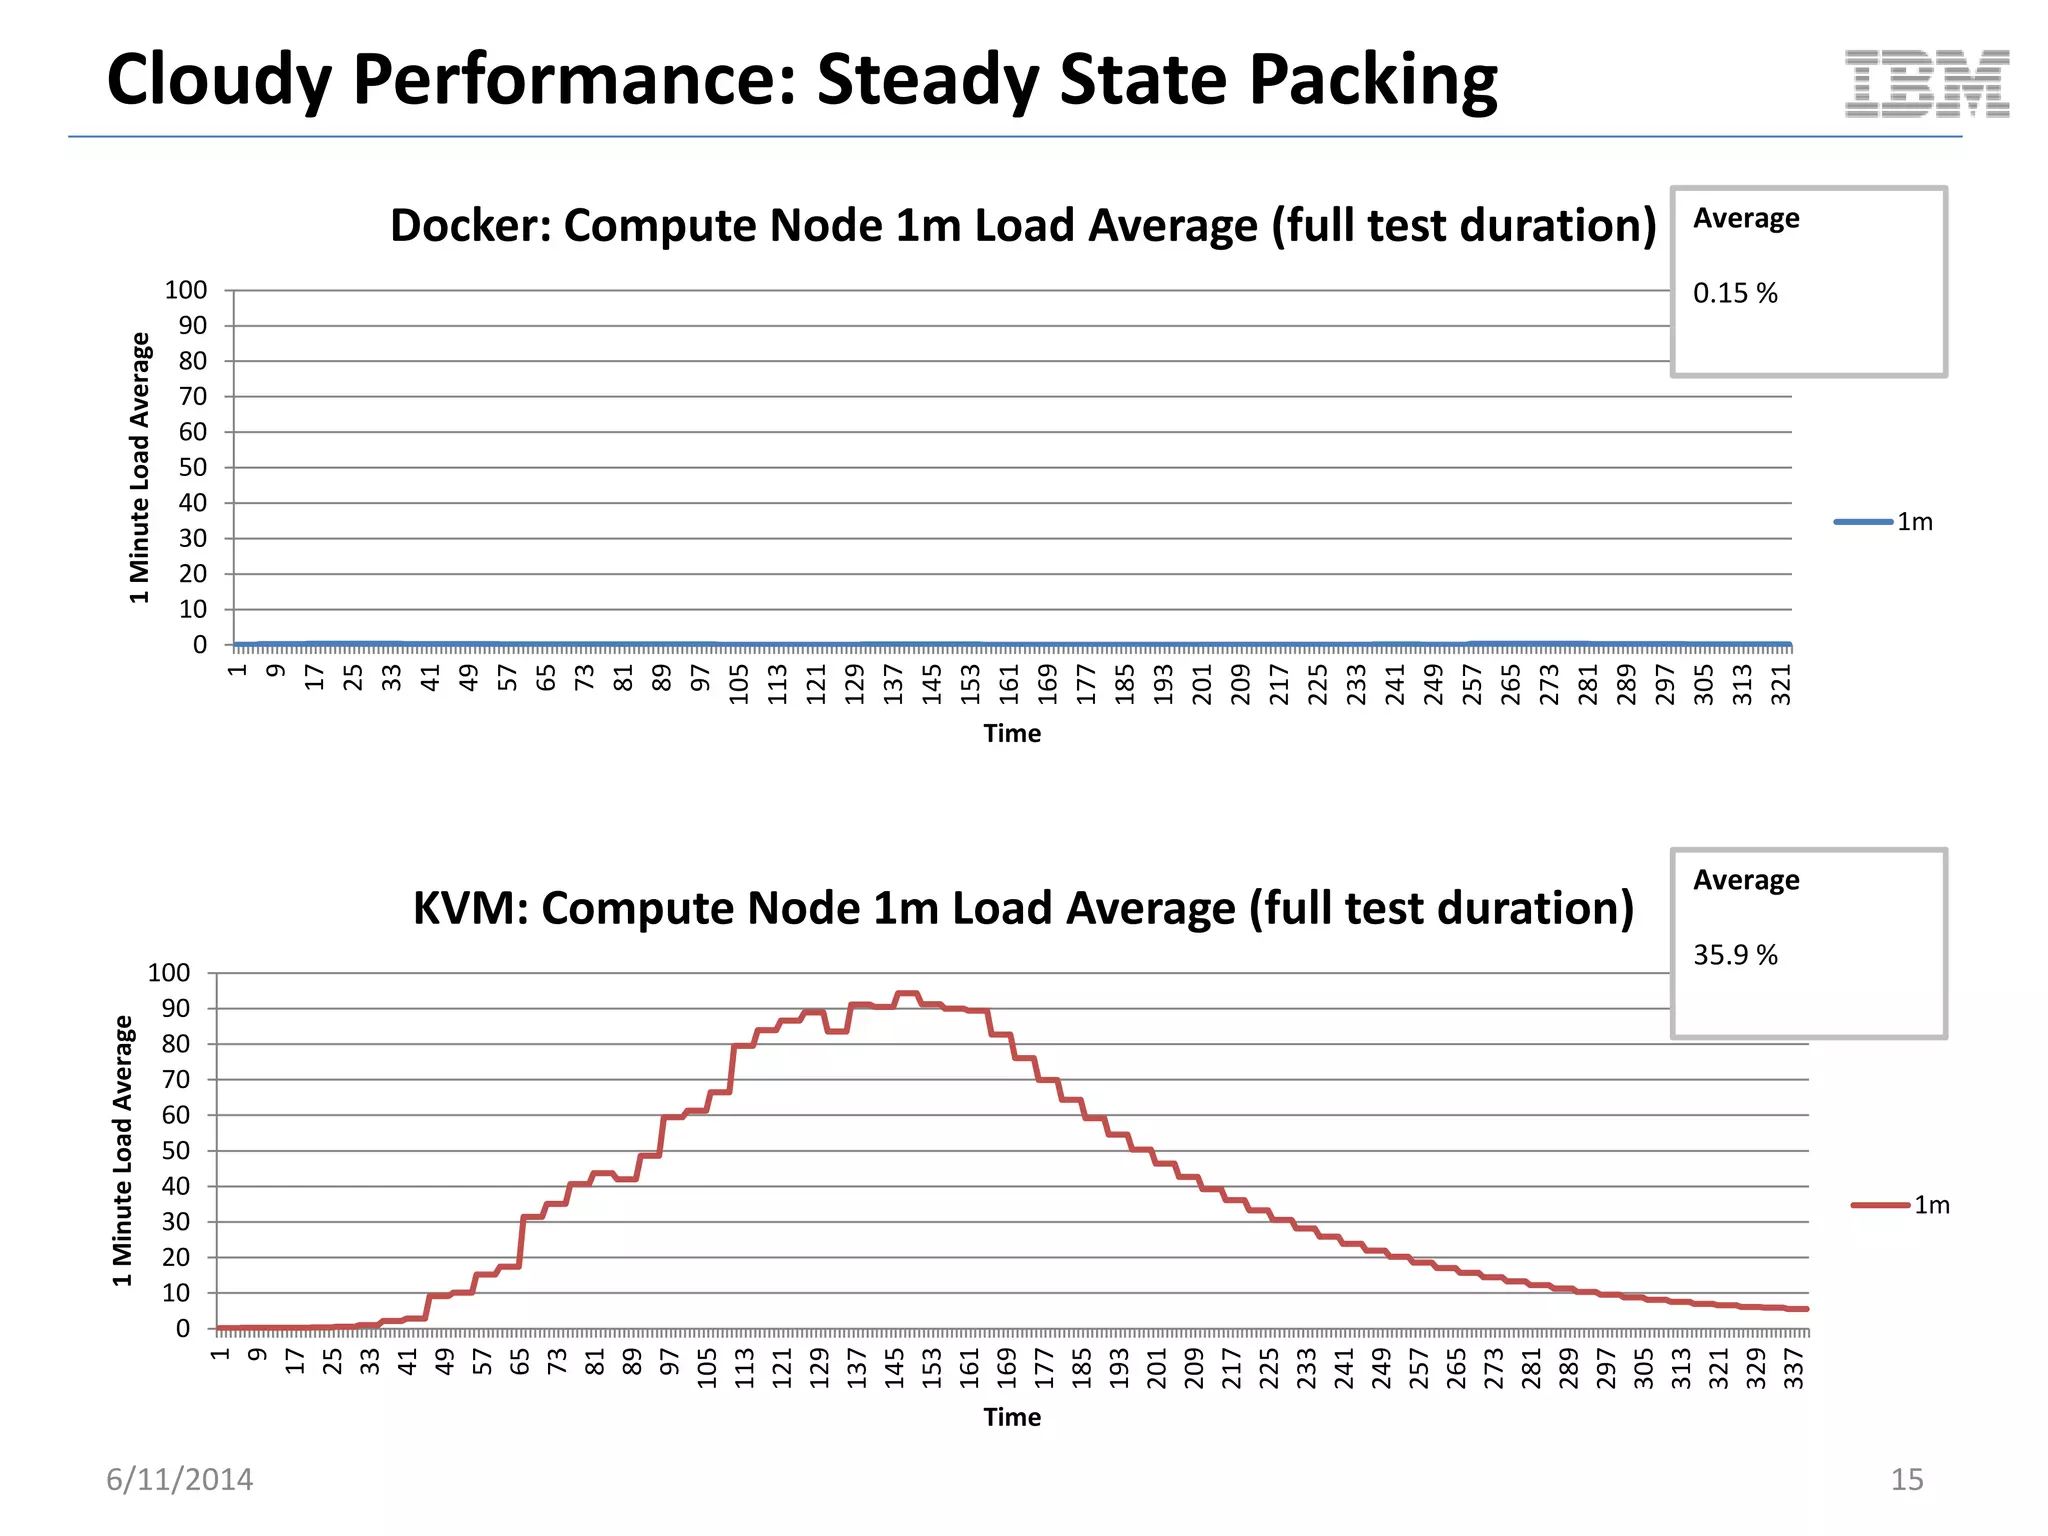
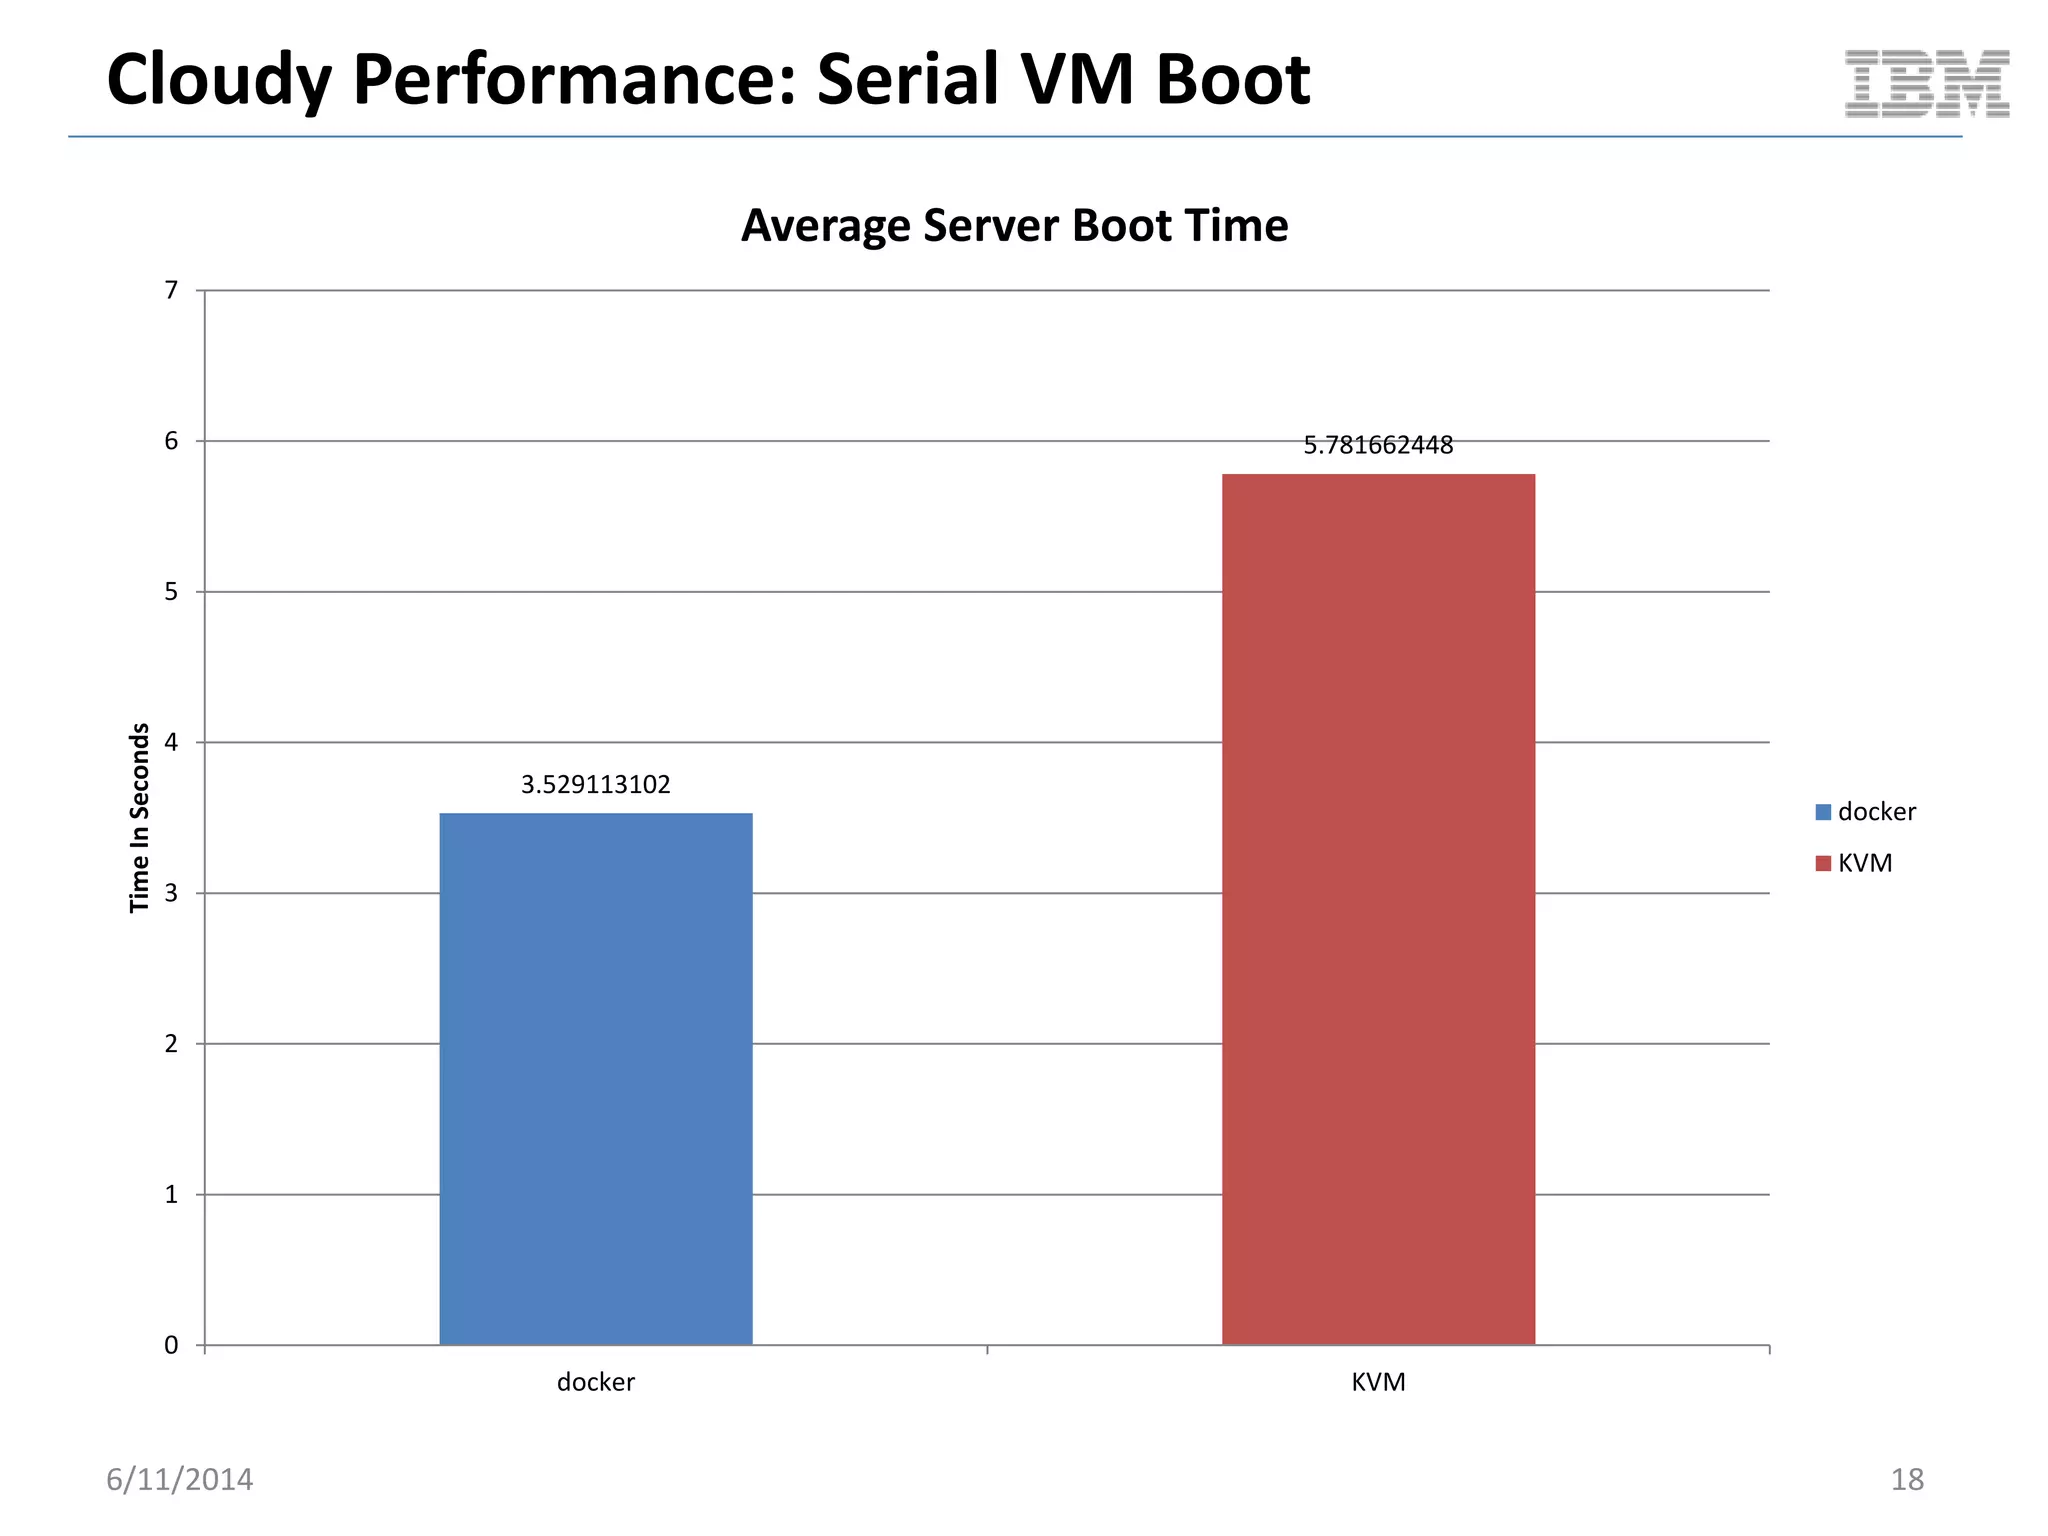
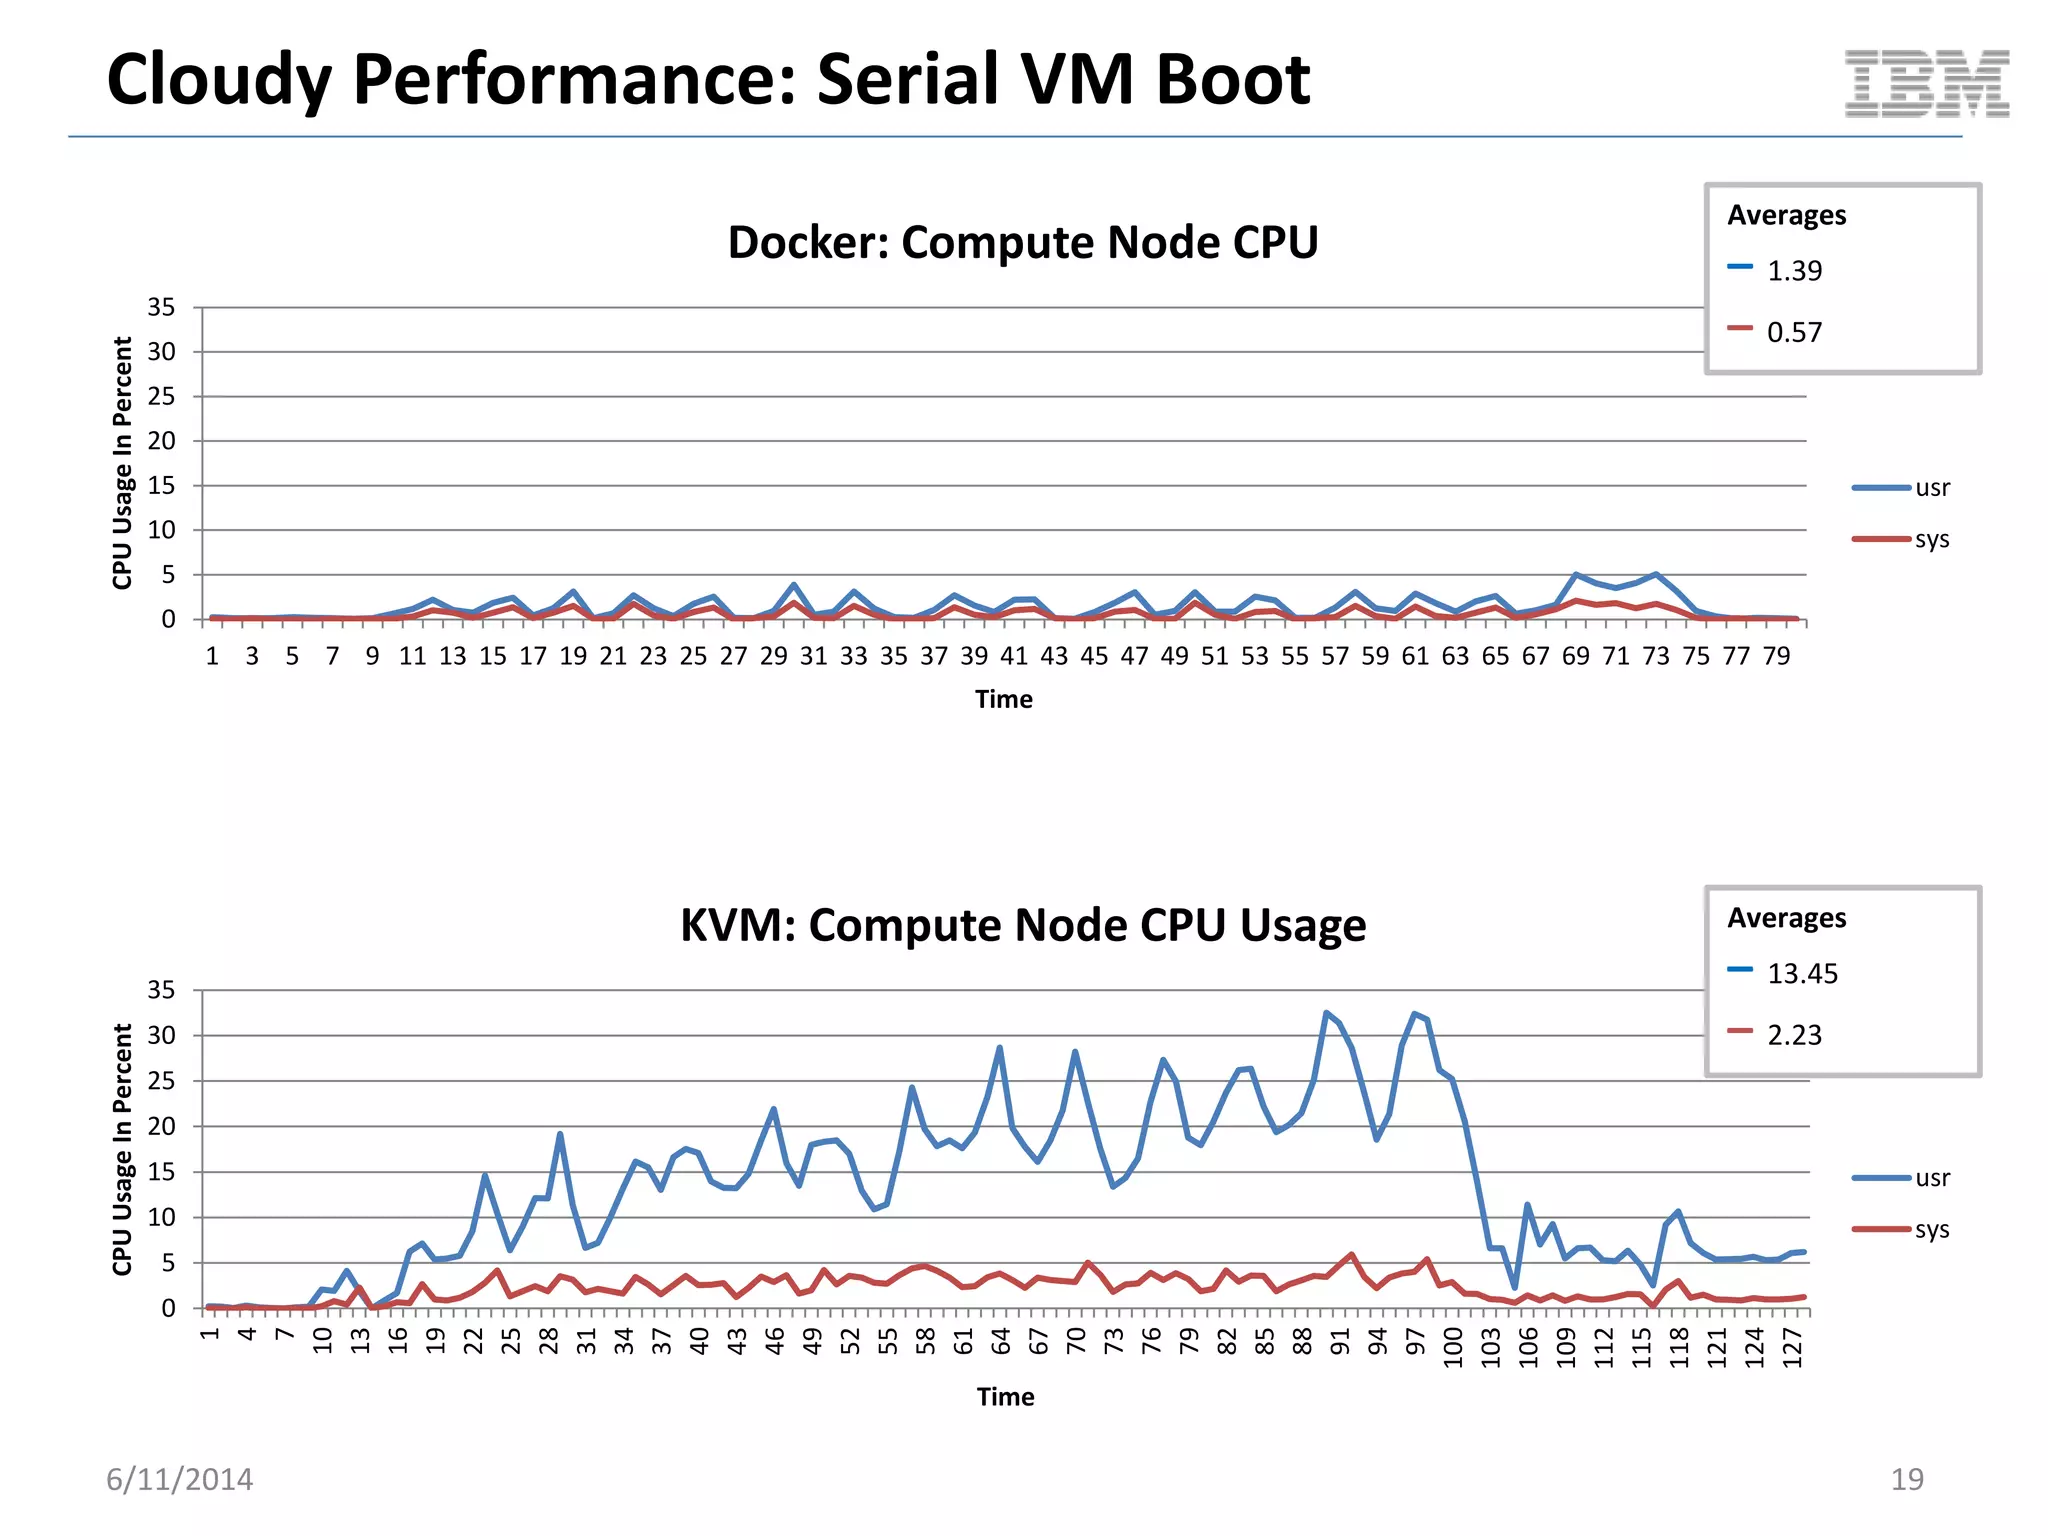
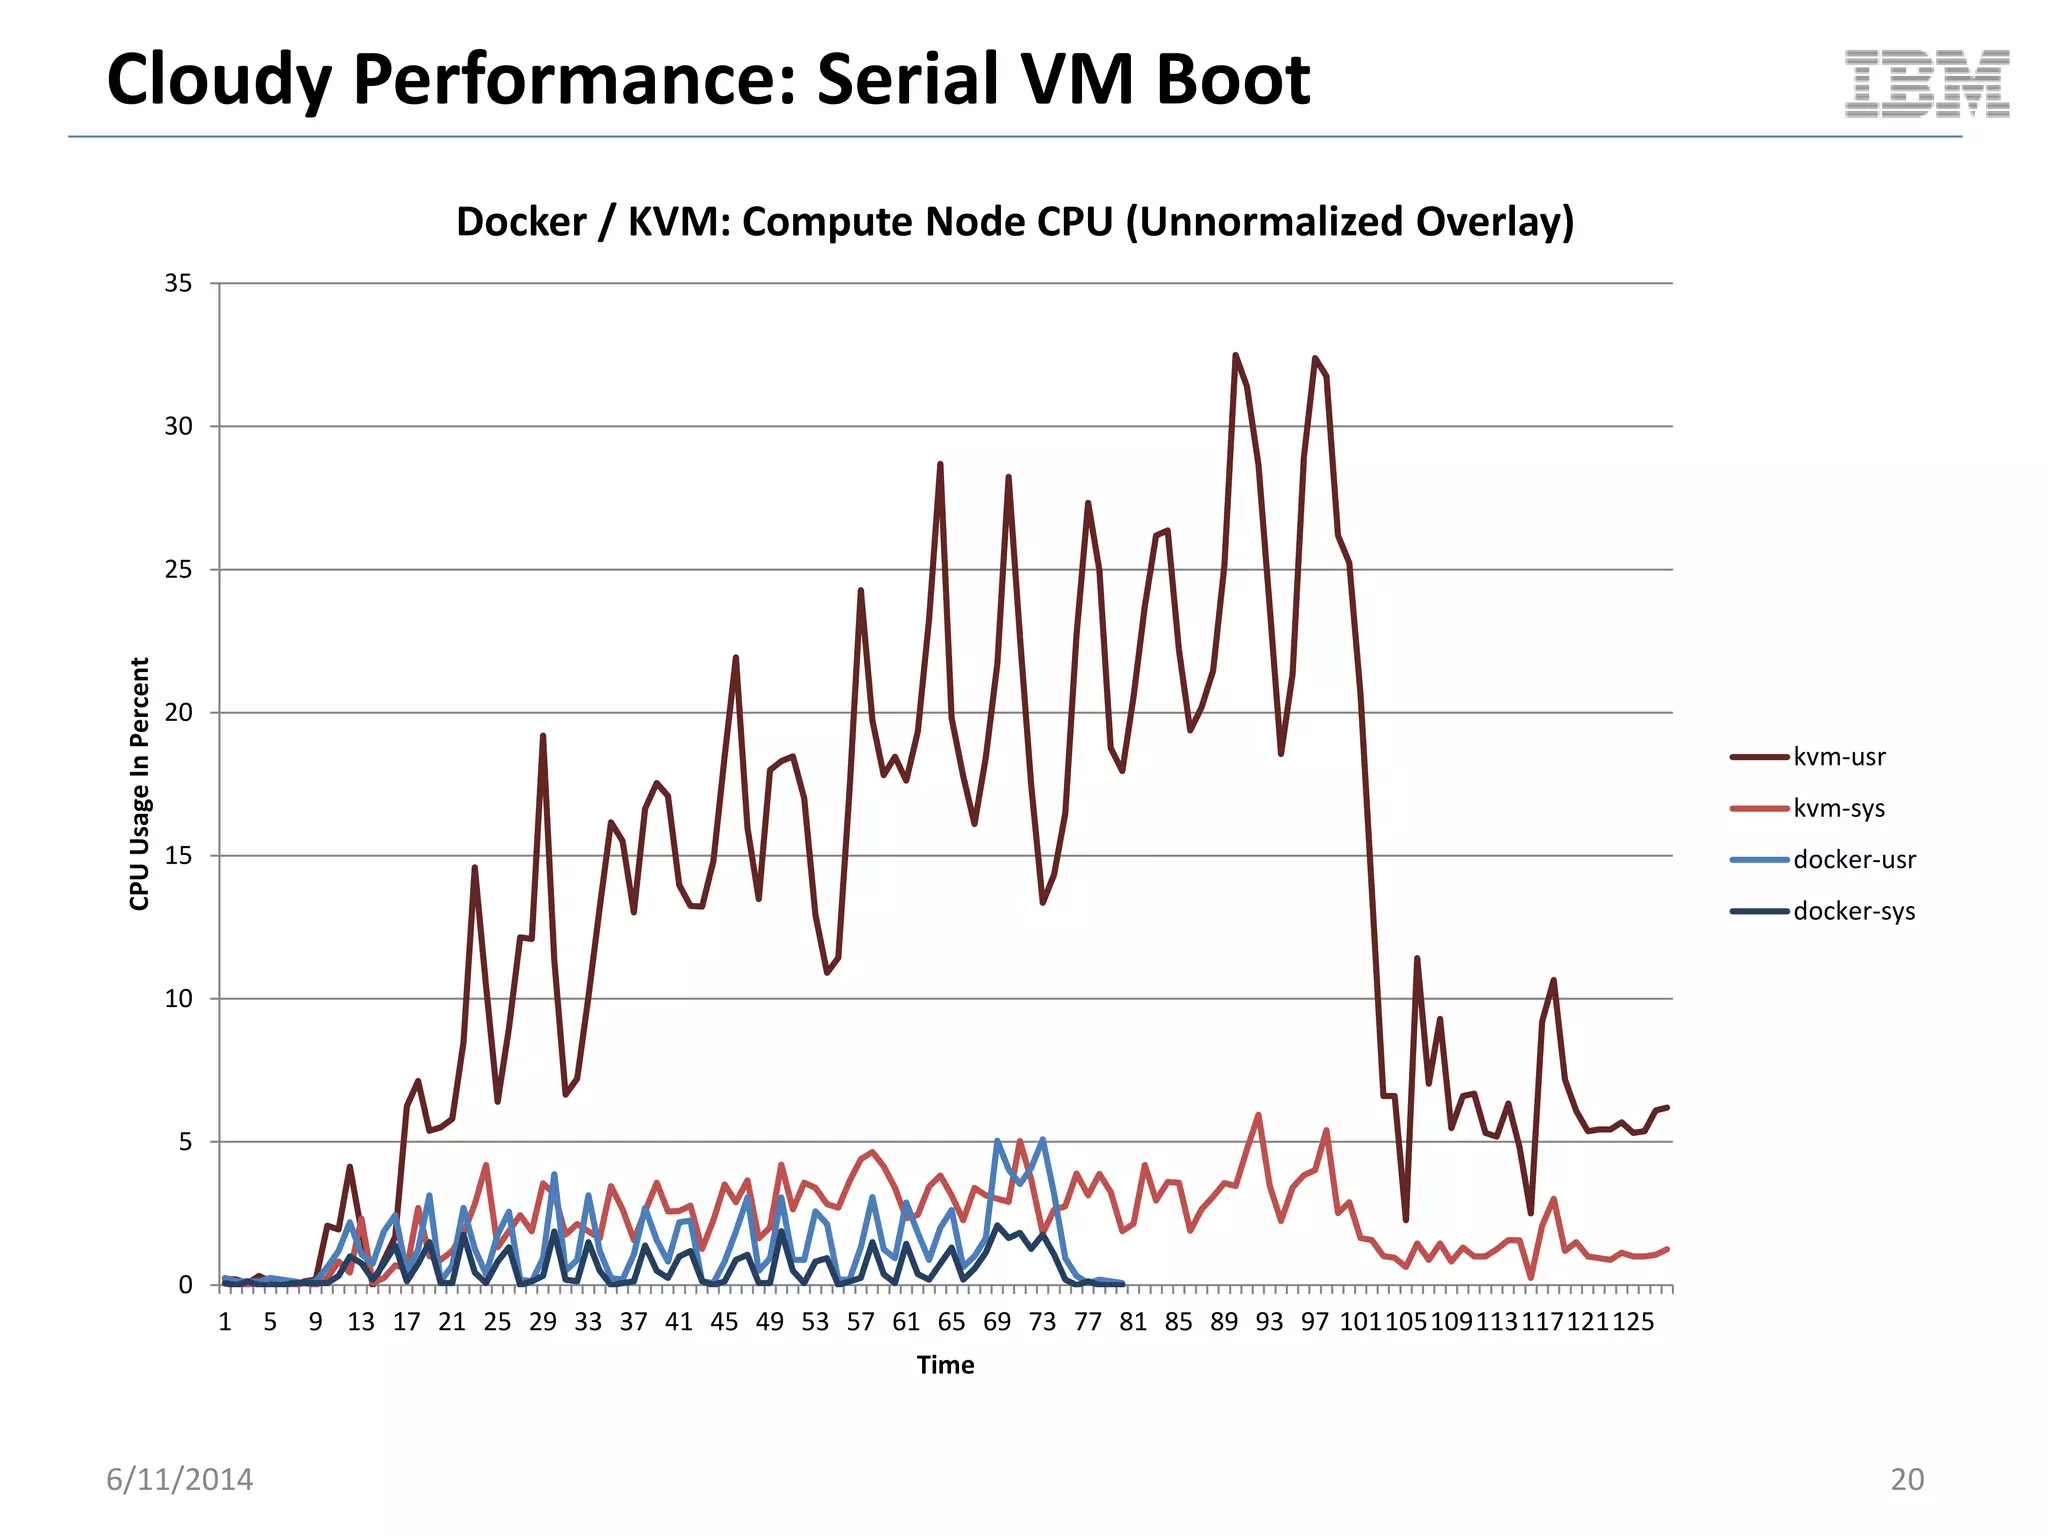
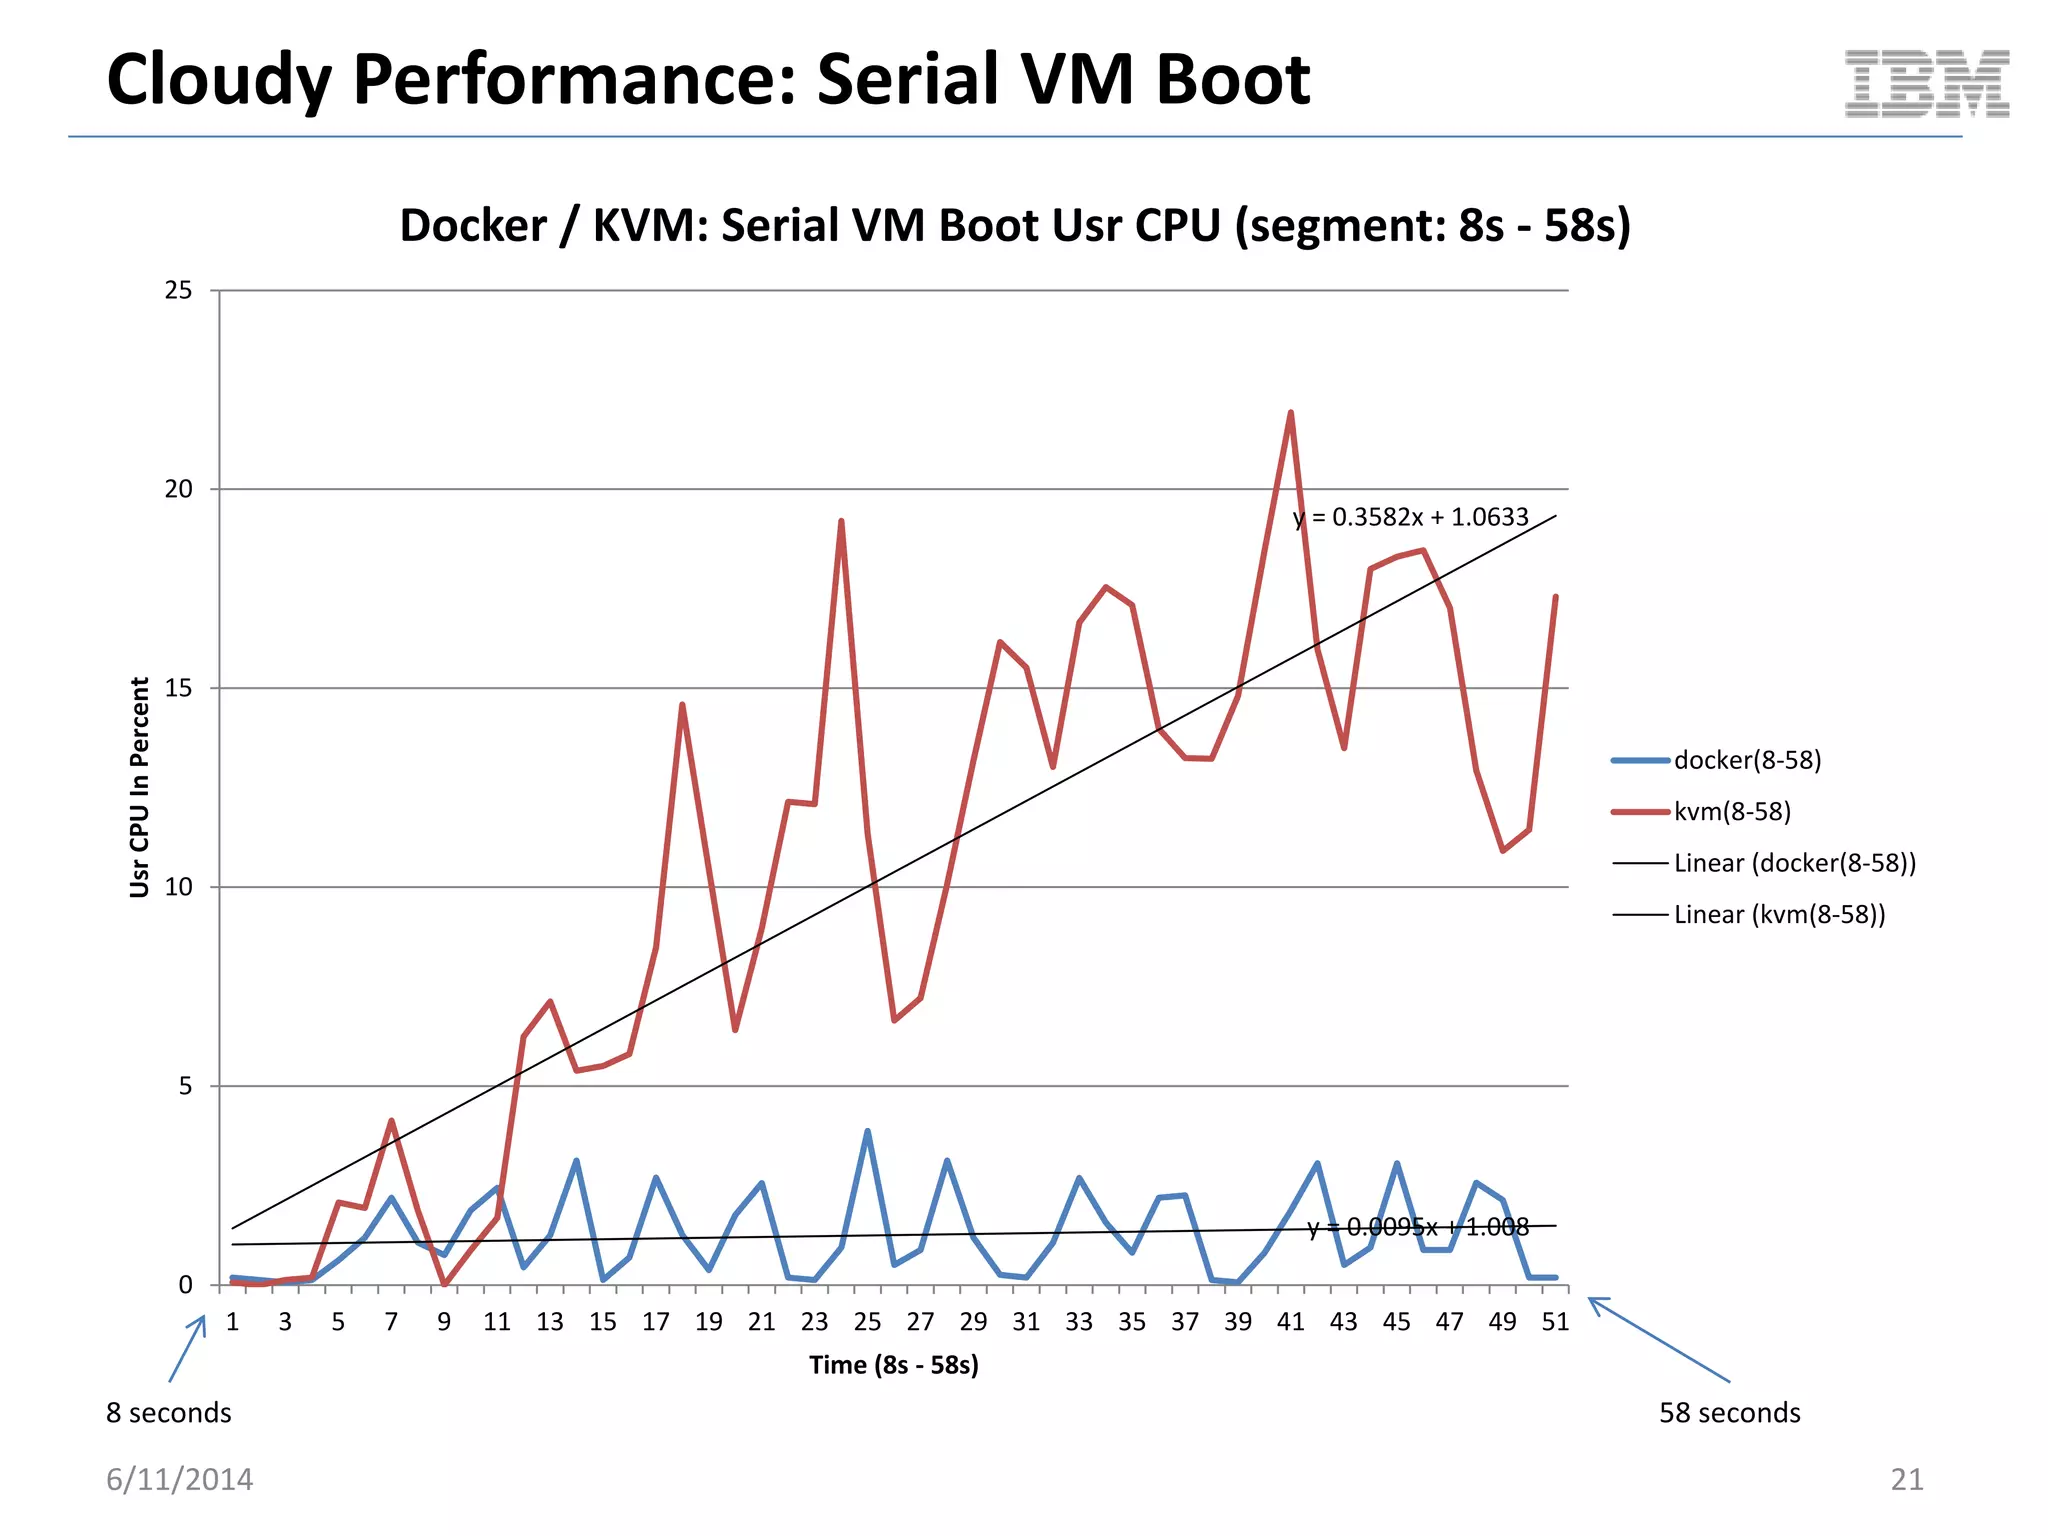
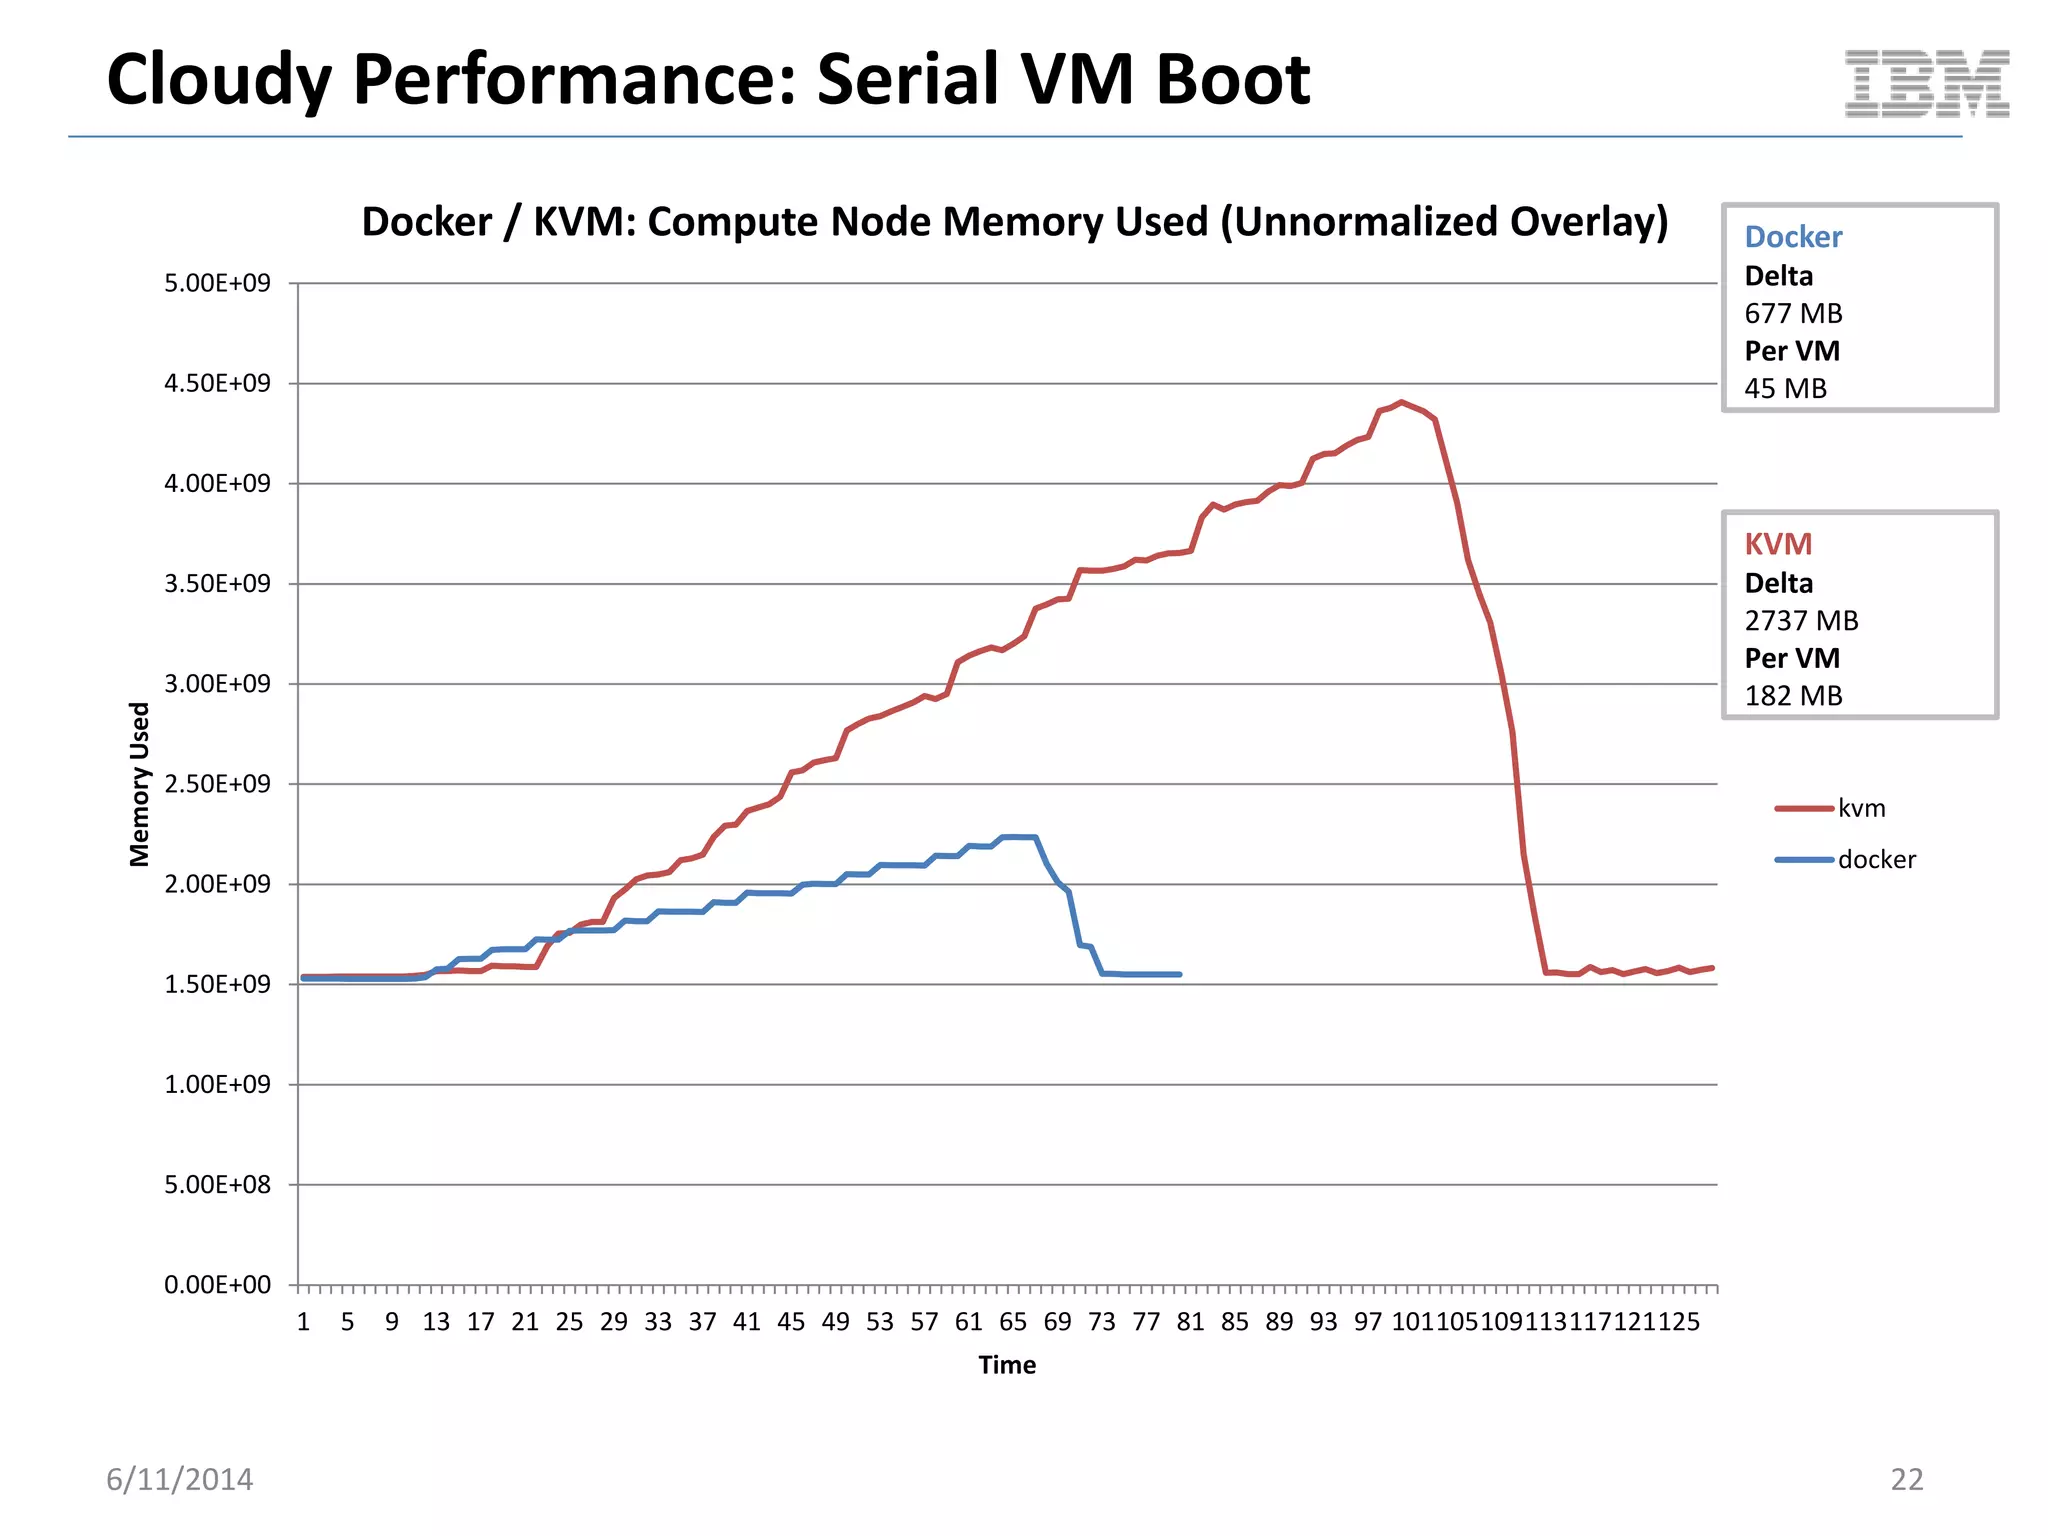
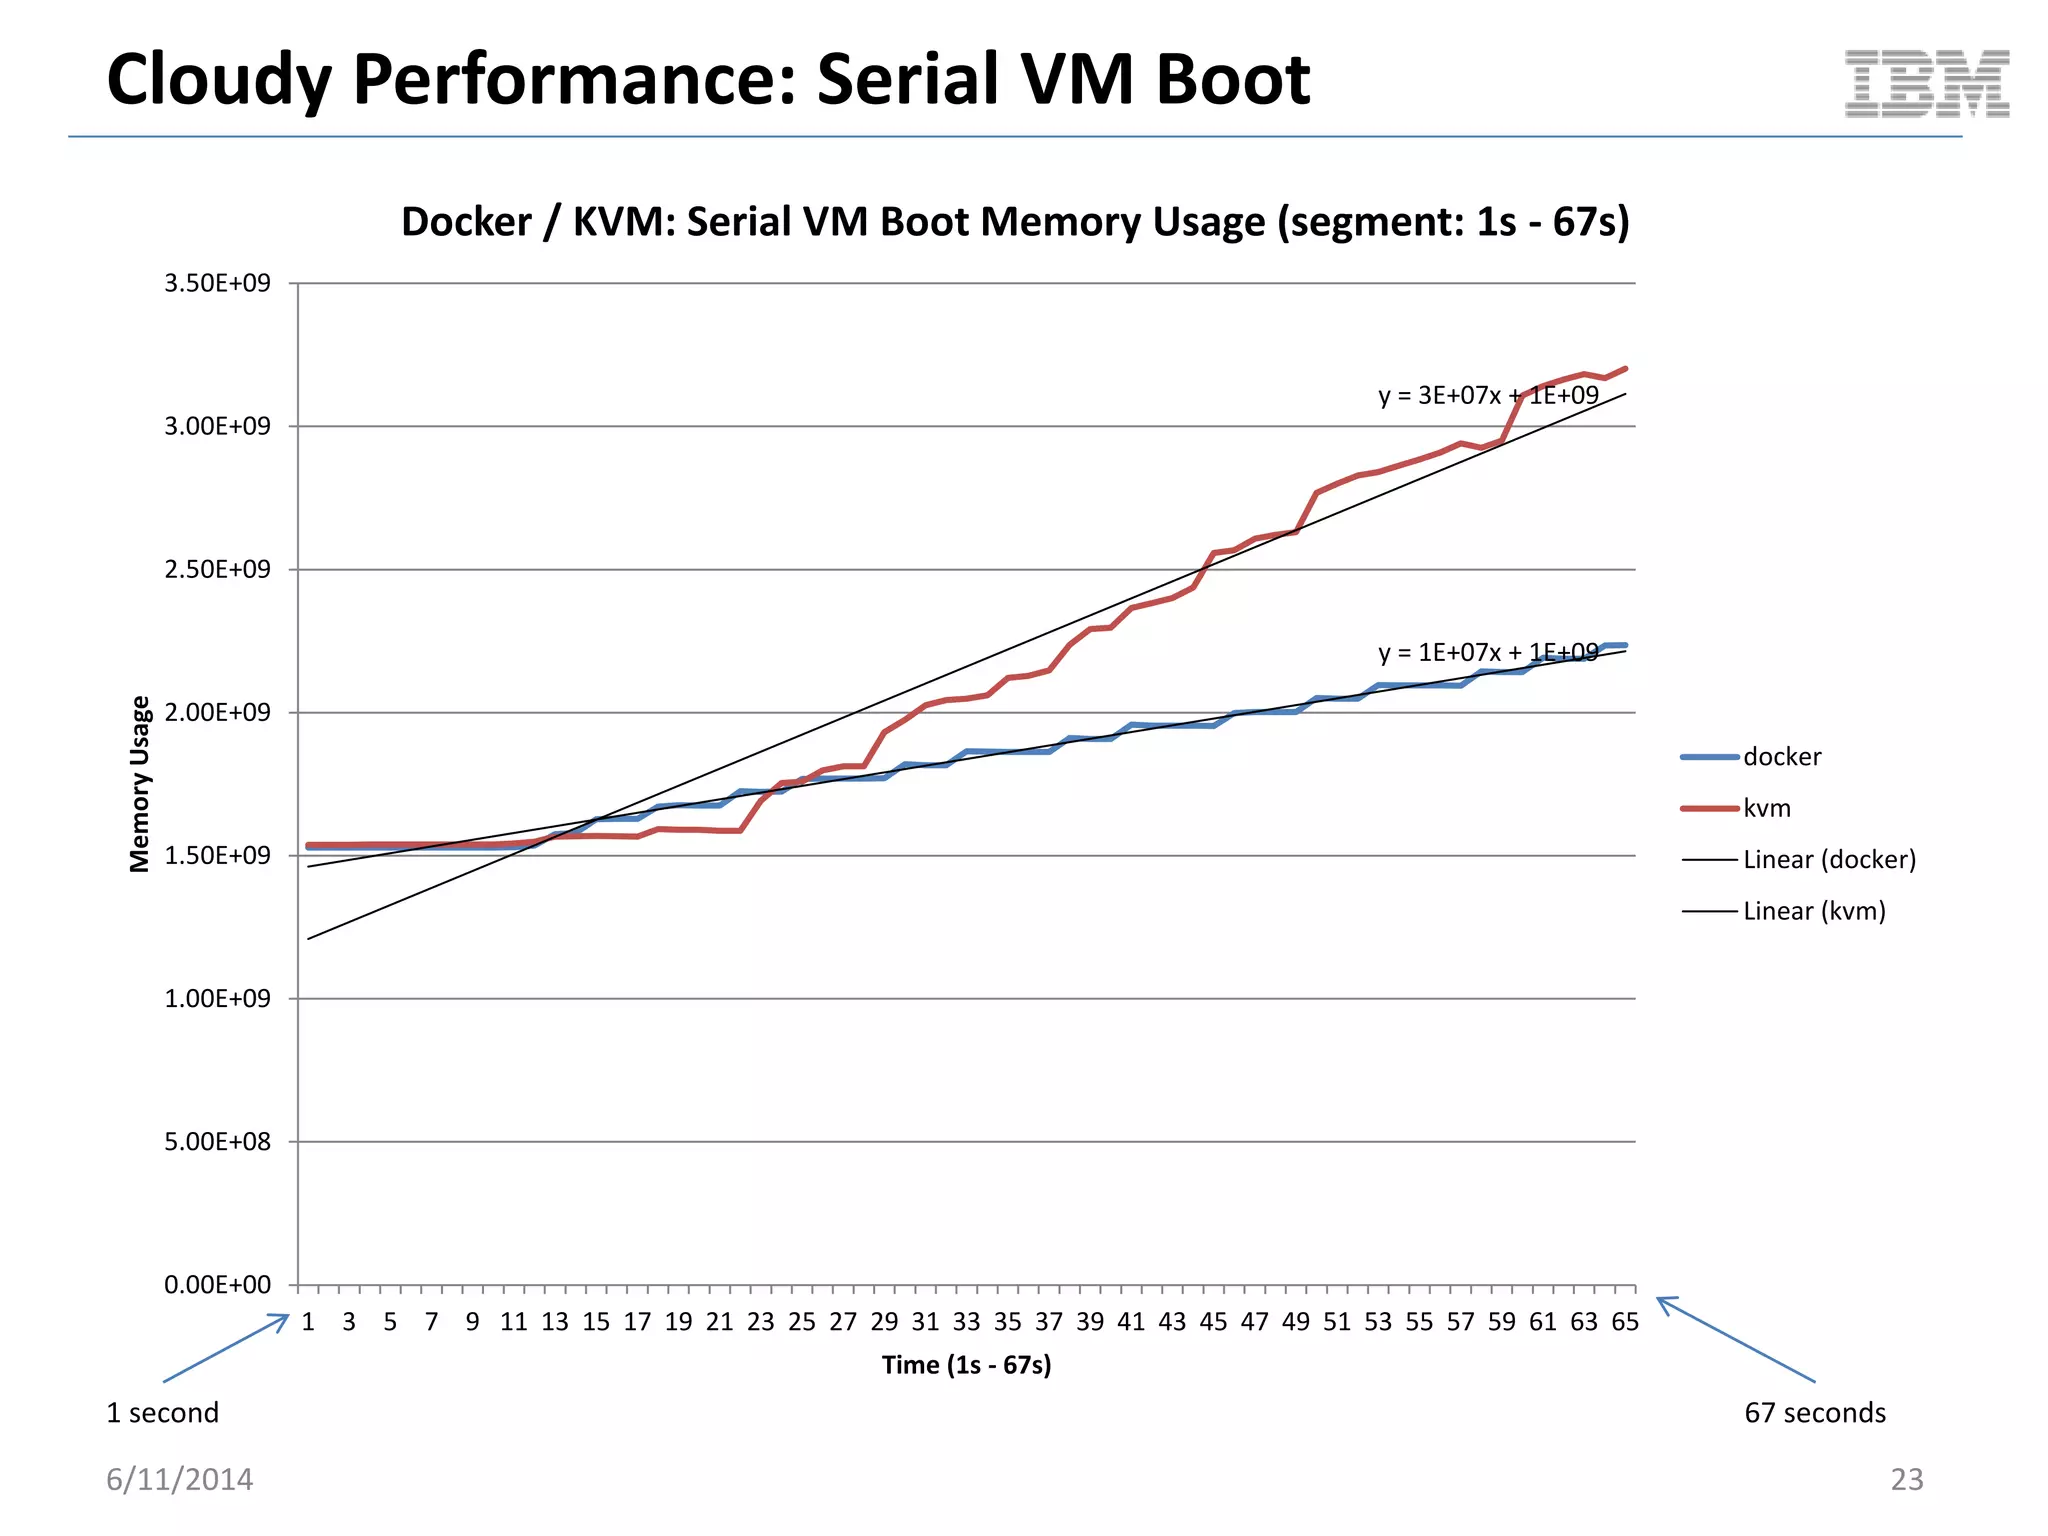
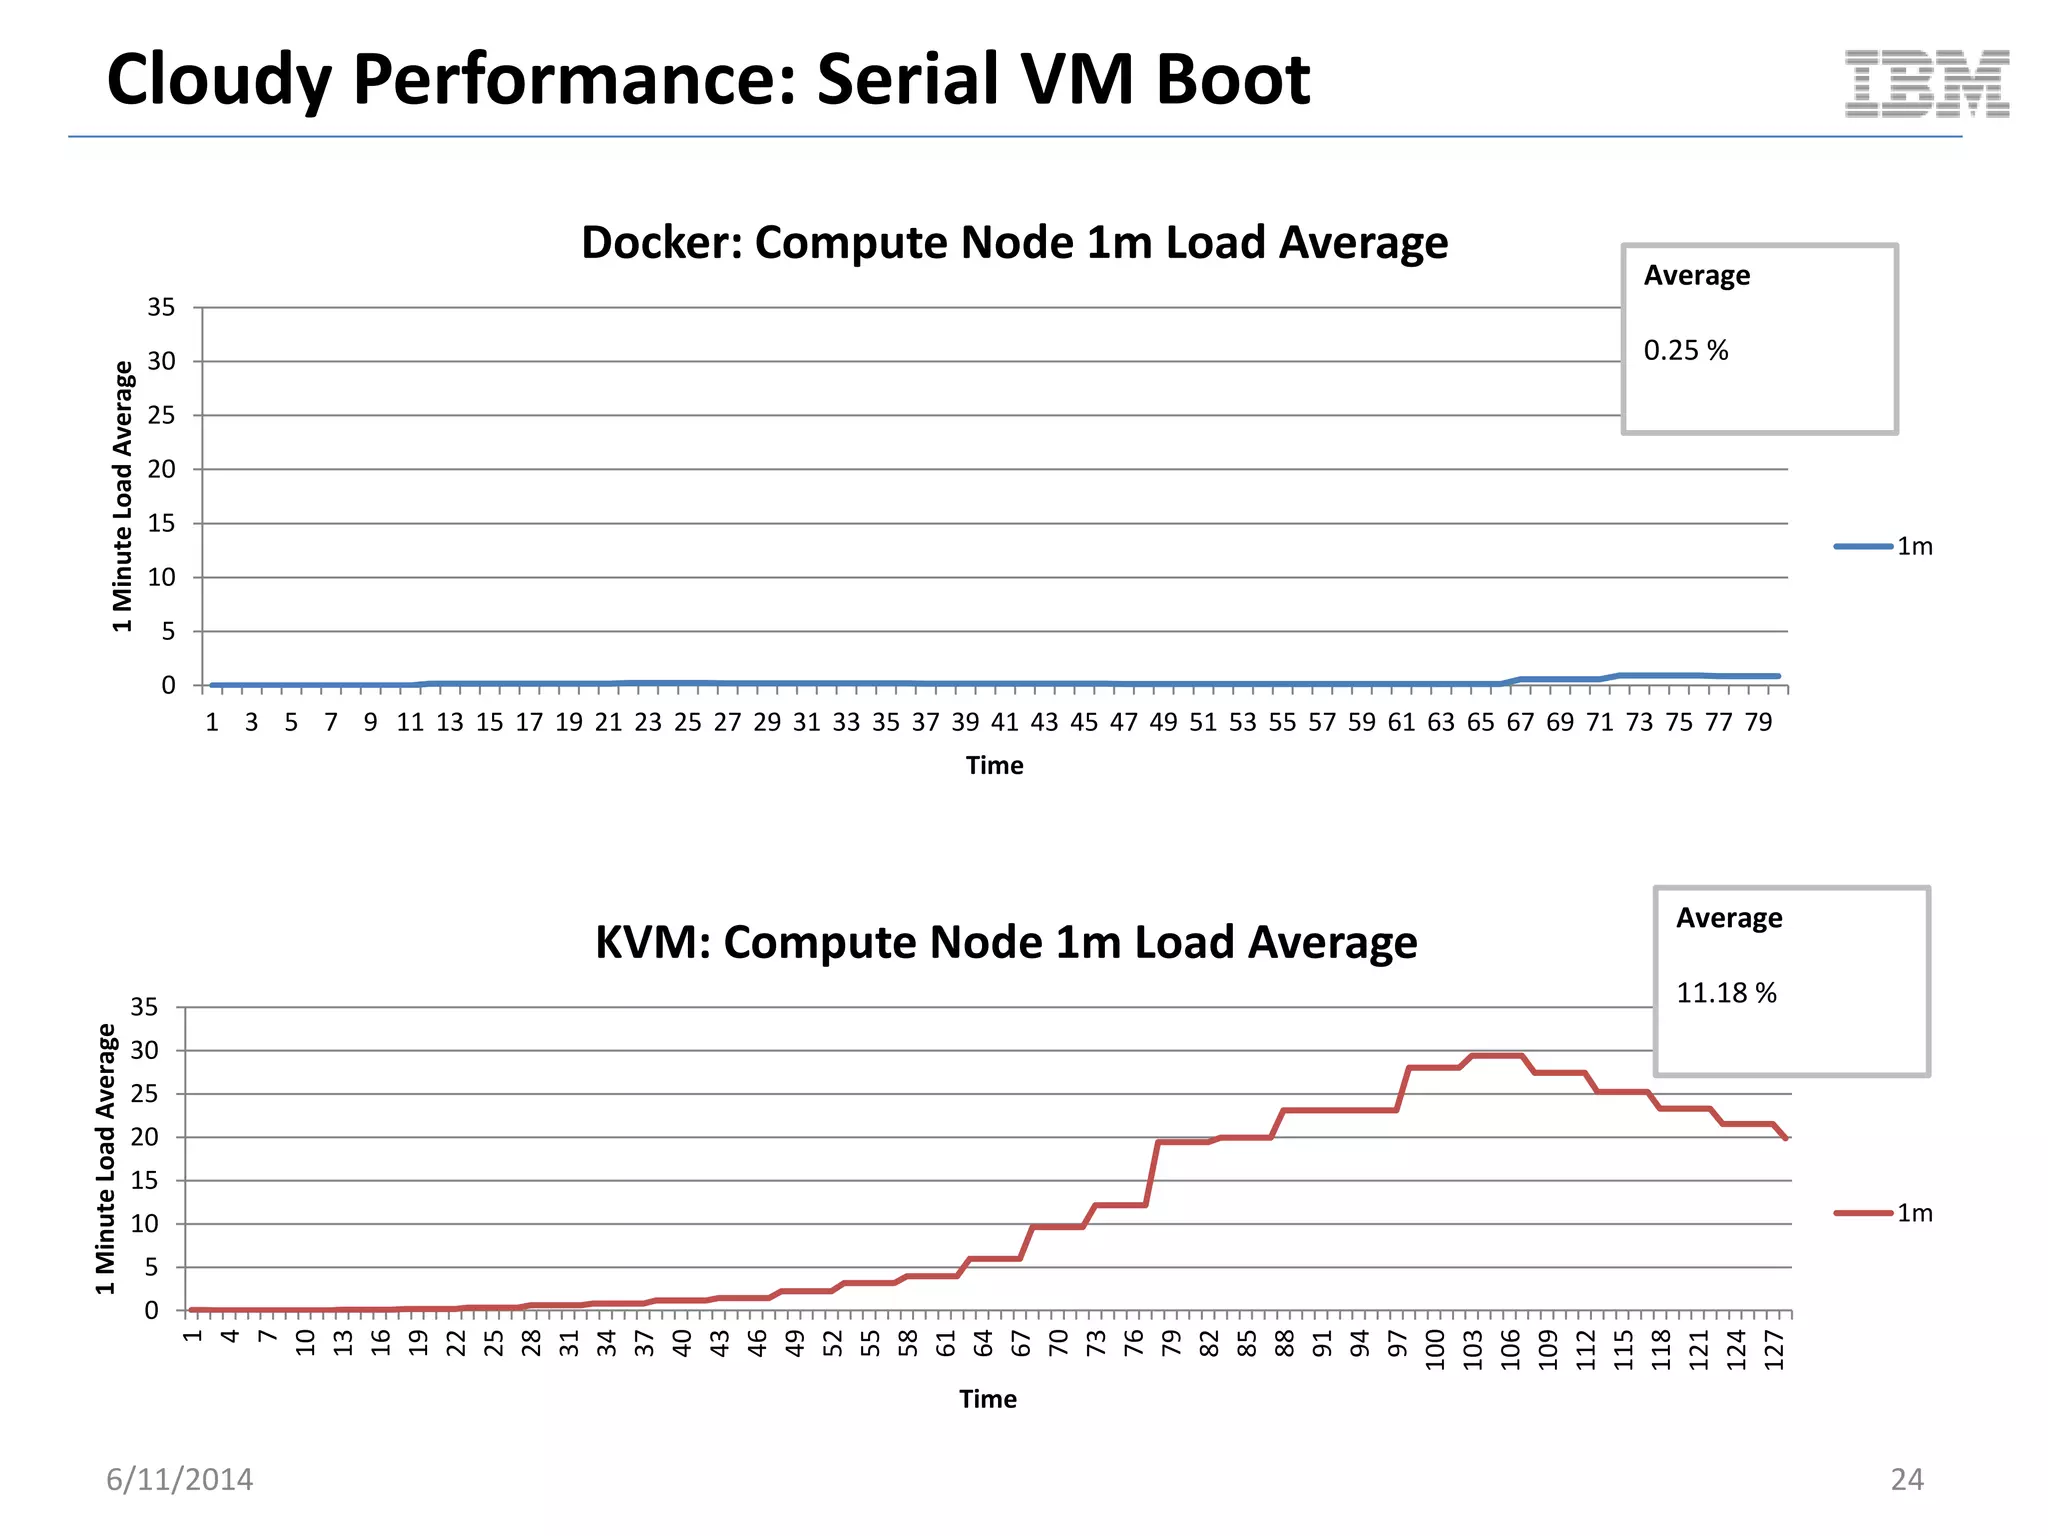
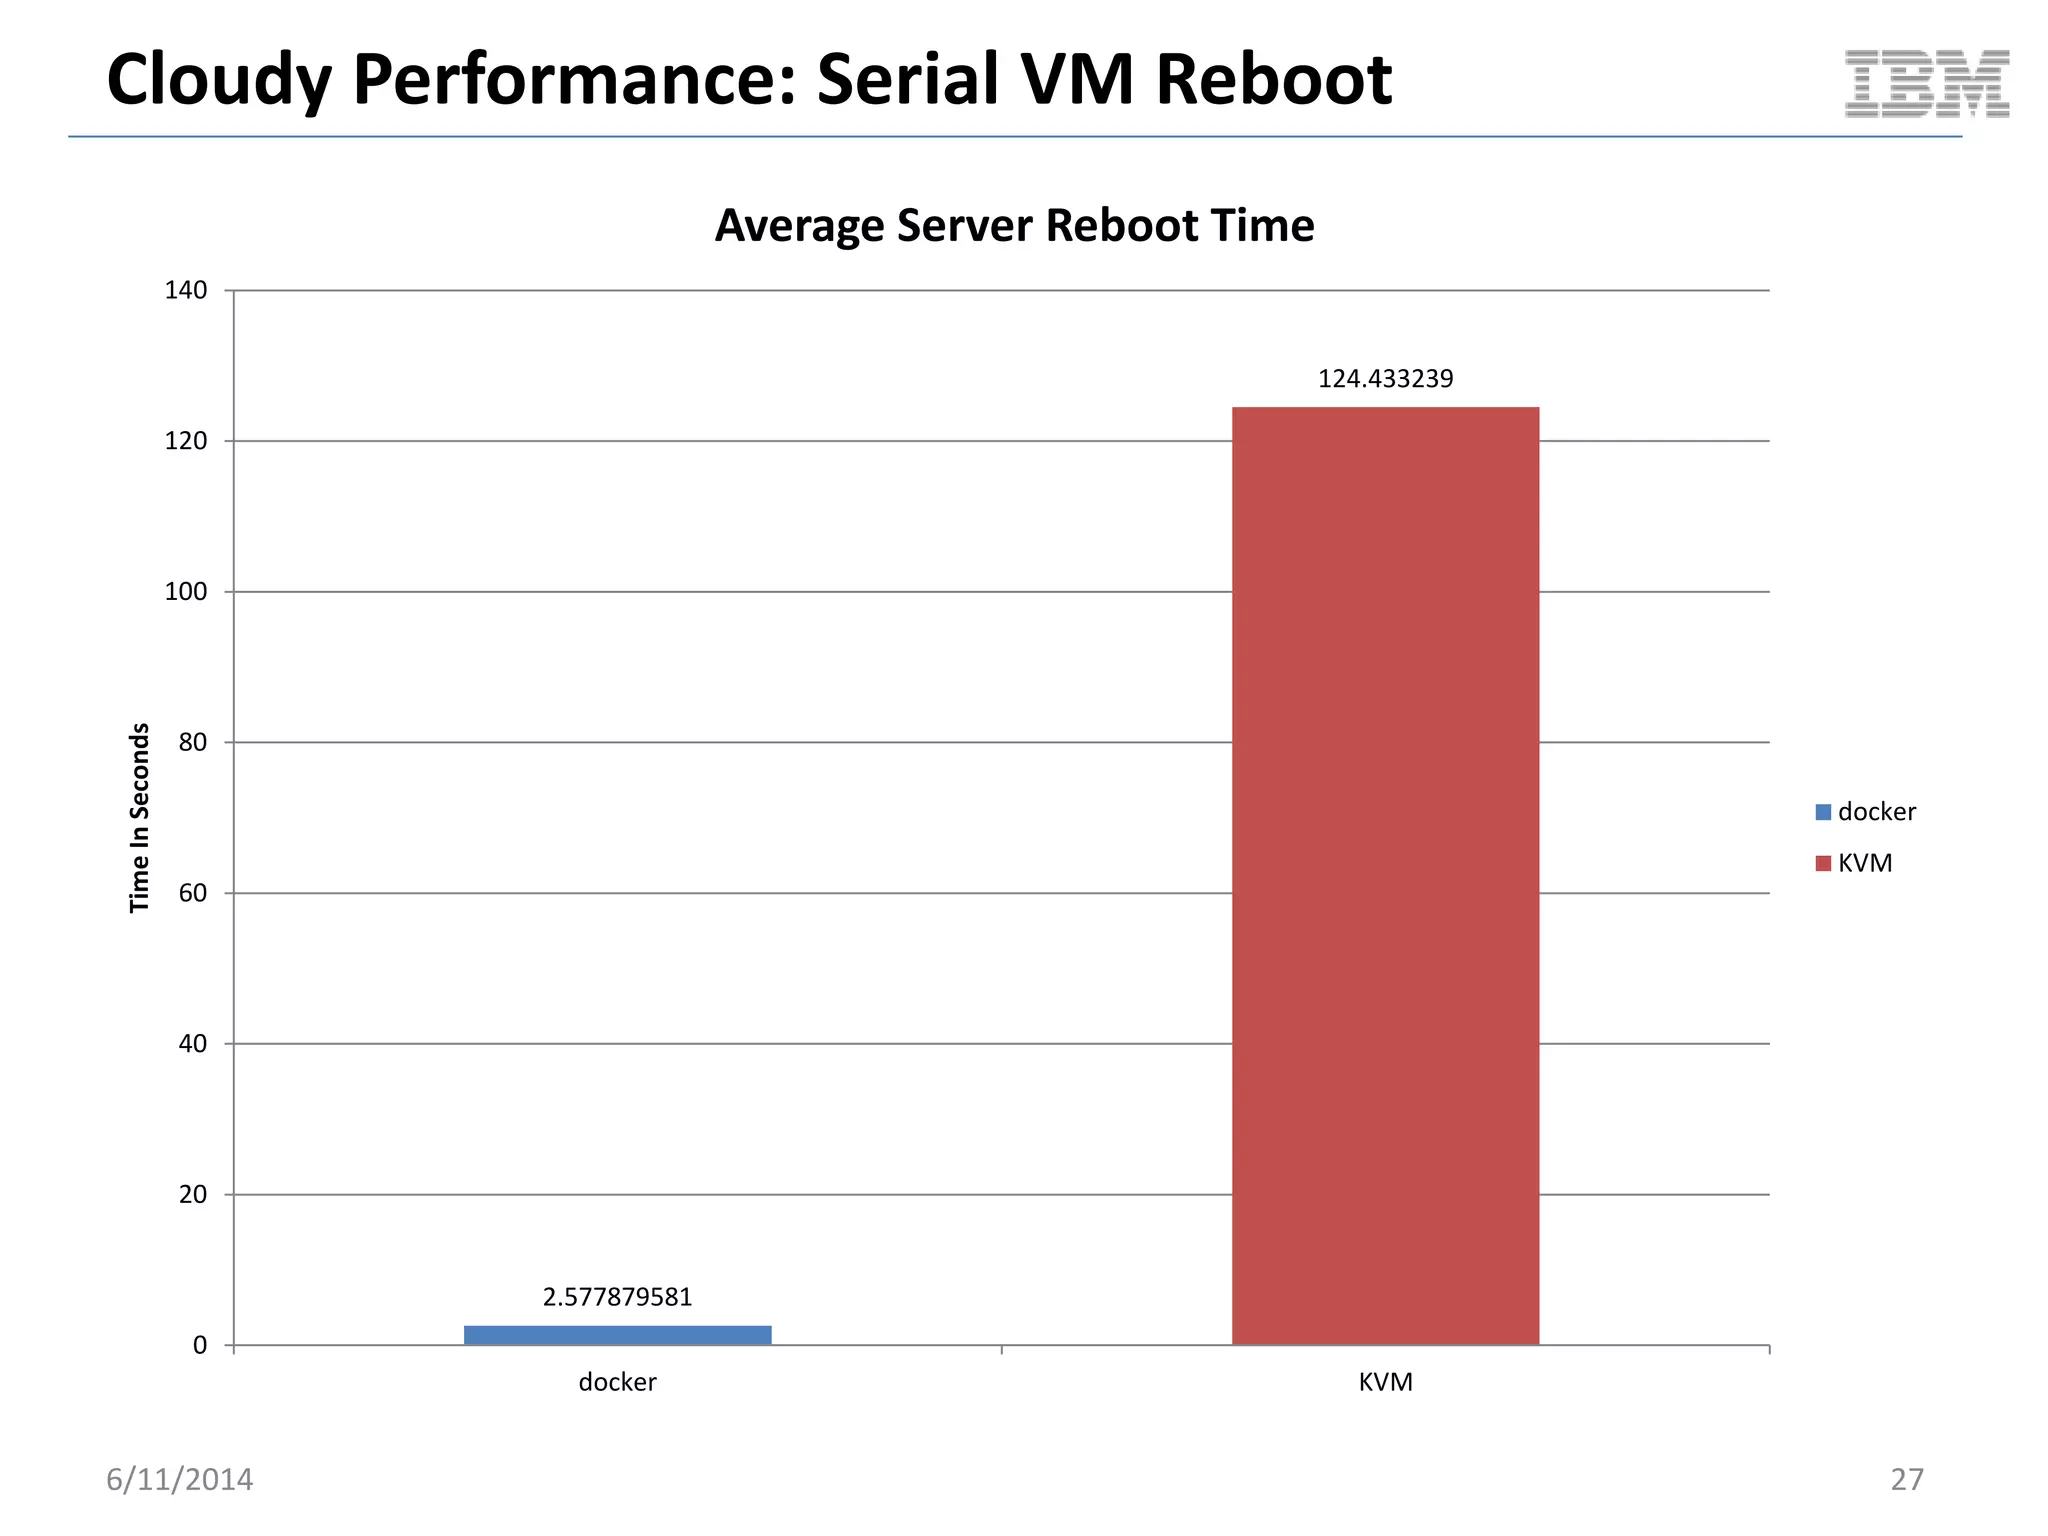
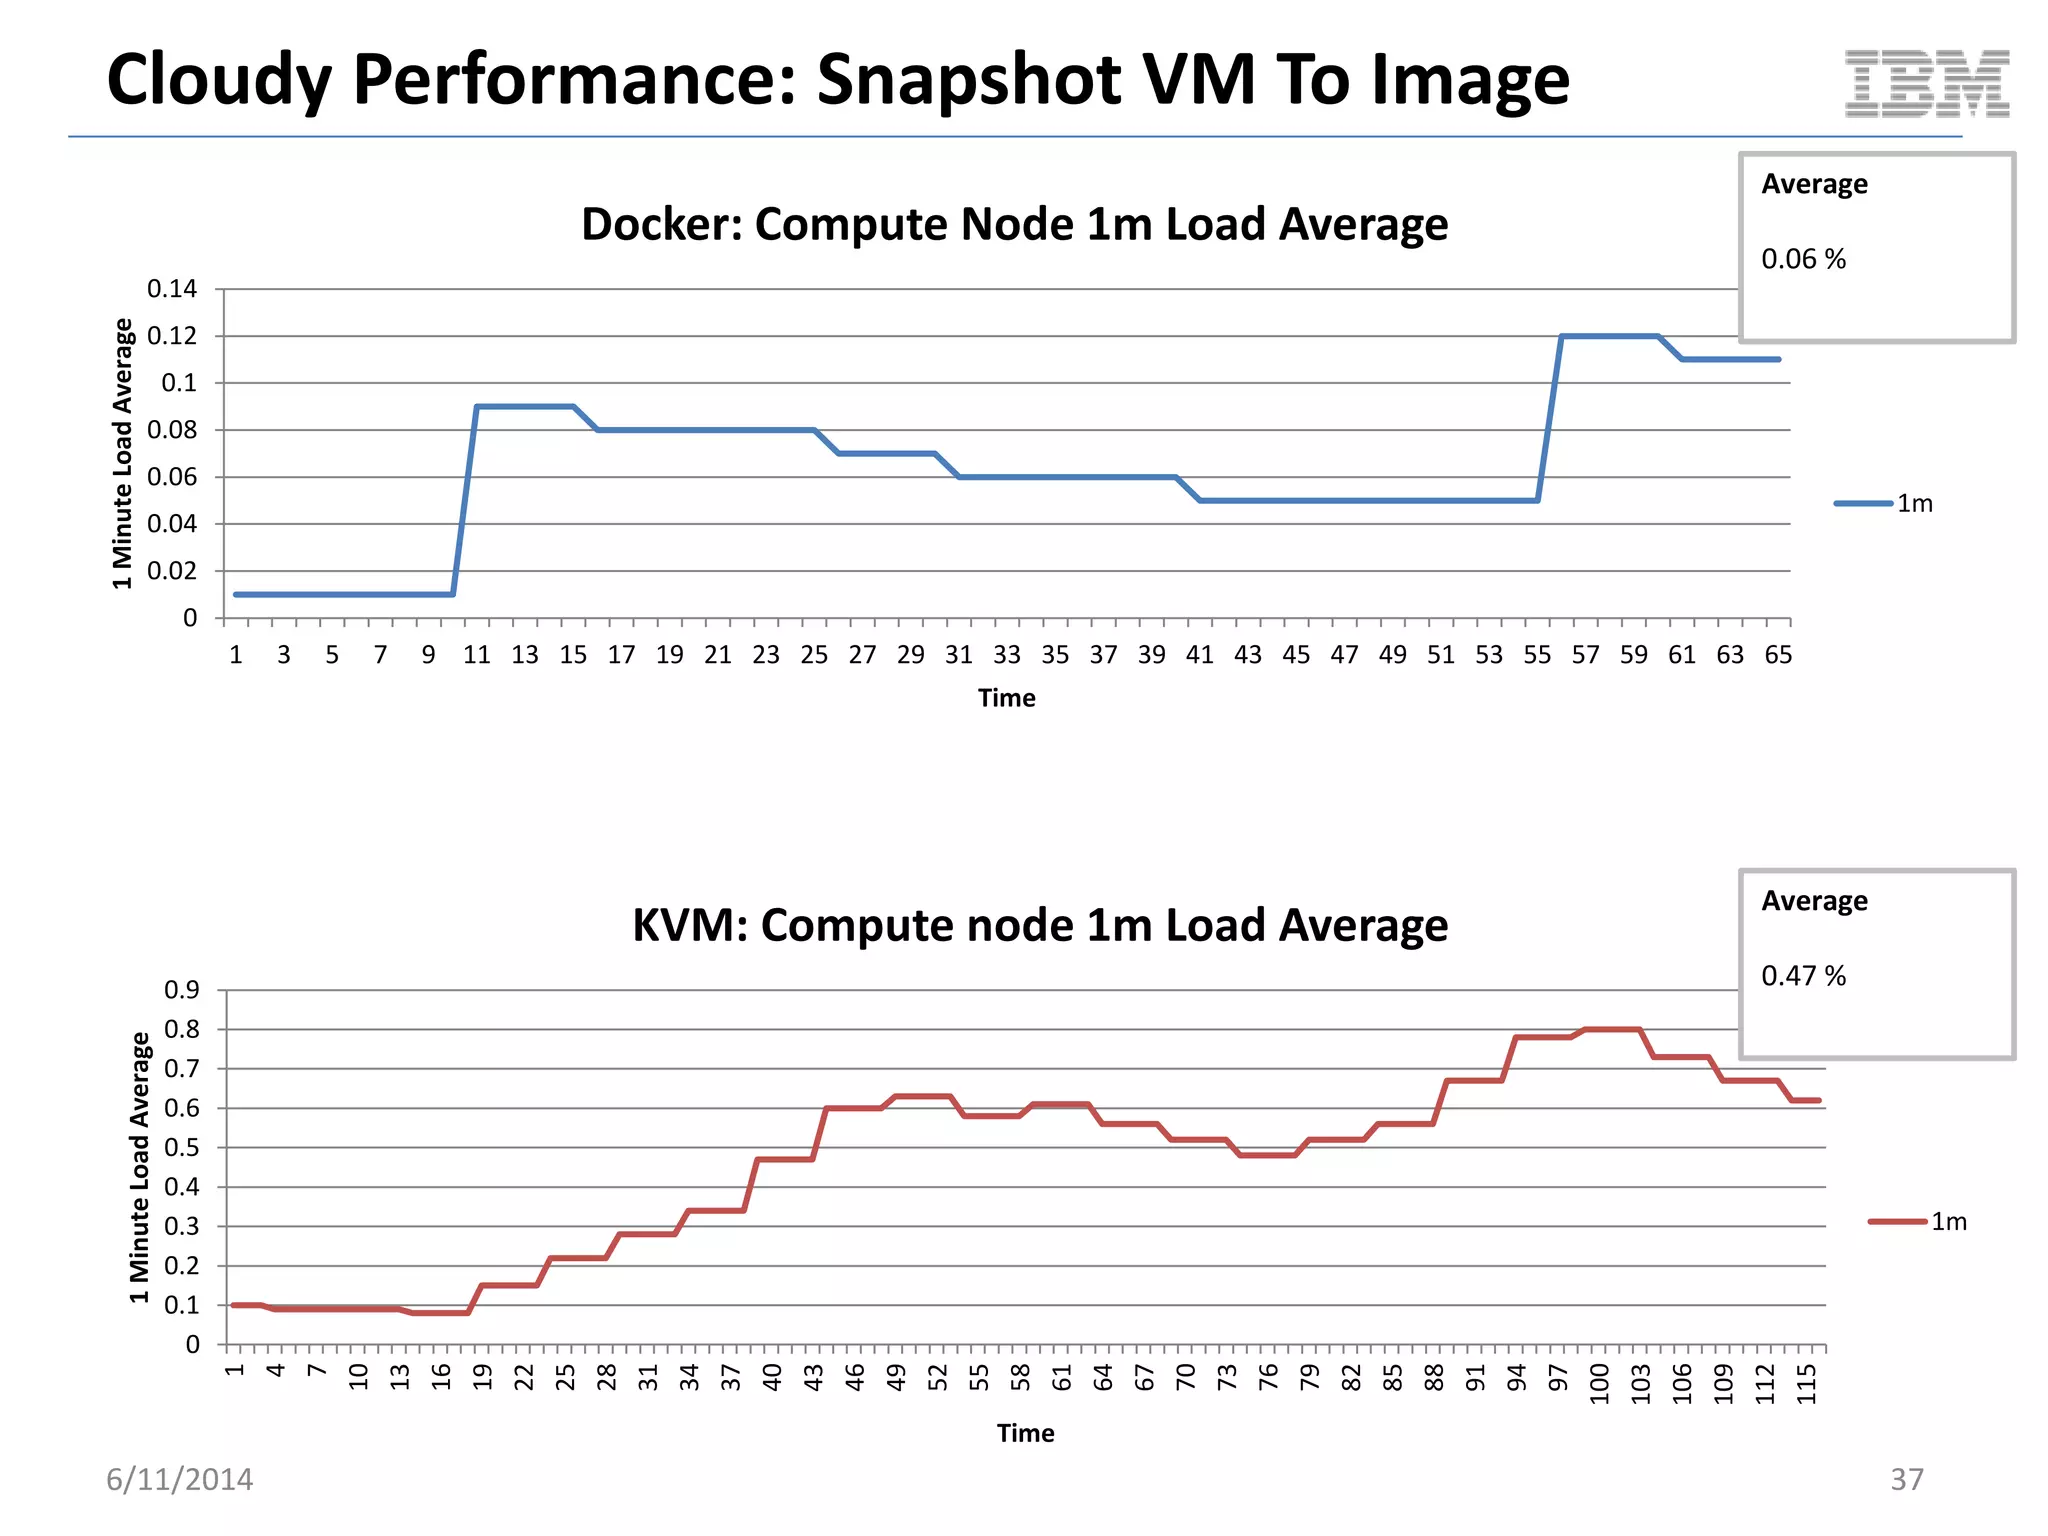
Docker containers provide significantly lower resource usage and higher density than traditional virtual machines when running multiple workloads concurrently on a server. When booting 15 Ubuntu VMs with MySQL sequentially, Docker containers boot on average 3.5 seconds compared to 5.8 seconds for KVMs. During steady state operation of 15 active VMs, Docker uses on average 0.2% CPU and 49MB RAM per container, while KVMs use 1.9% CPU and 292MB RAM each. Docker maintains low 1-minute load averages of 0.15, while KVMs average 35.9% under load.


![Vibe Coding vs. Spec-Driven Development [Free Meetup]](https://cdn.slidesharecdn.com/ss_thumbnails/vibecodingvsspecdrivendevelopment-251209105622-43f455e7-thumbnail.jpg?width=640&height=640&fit=bounds)


