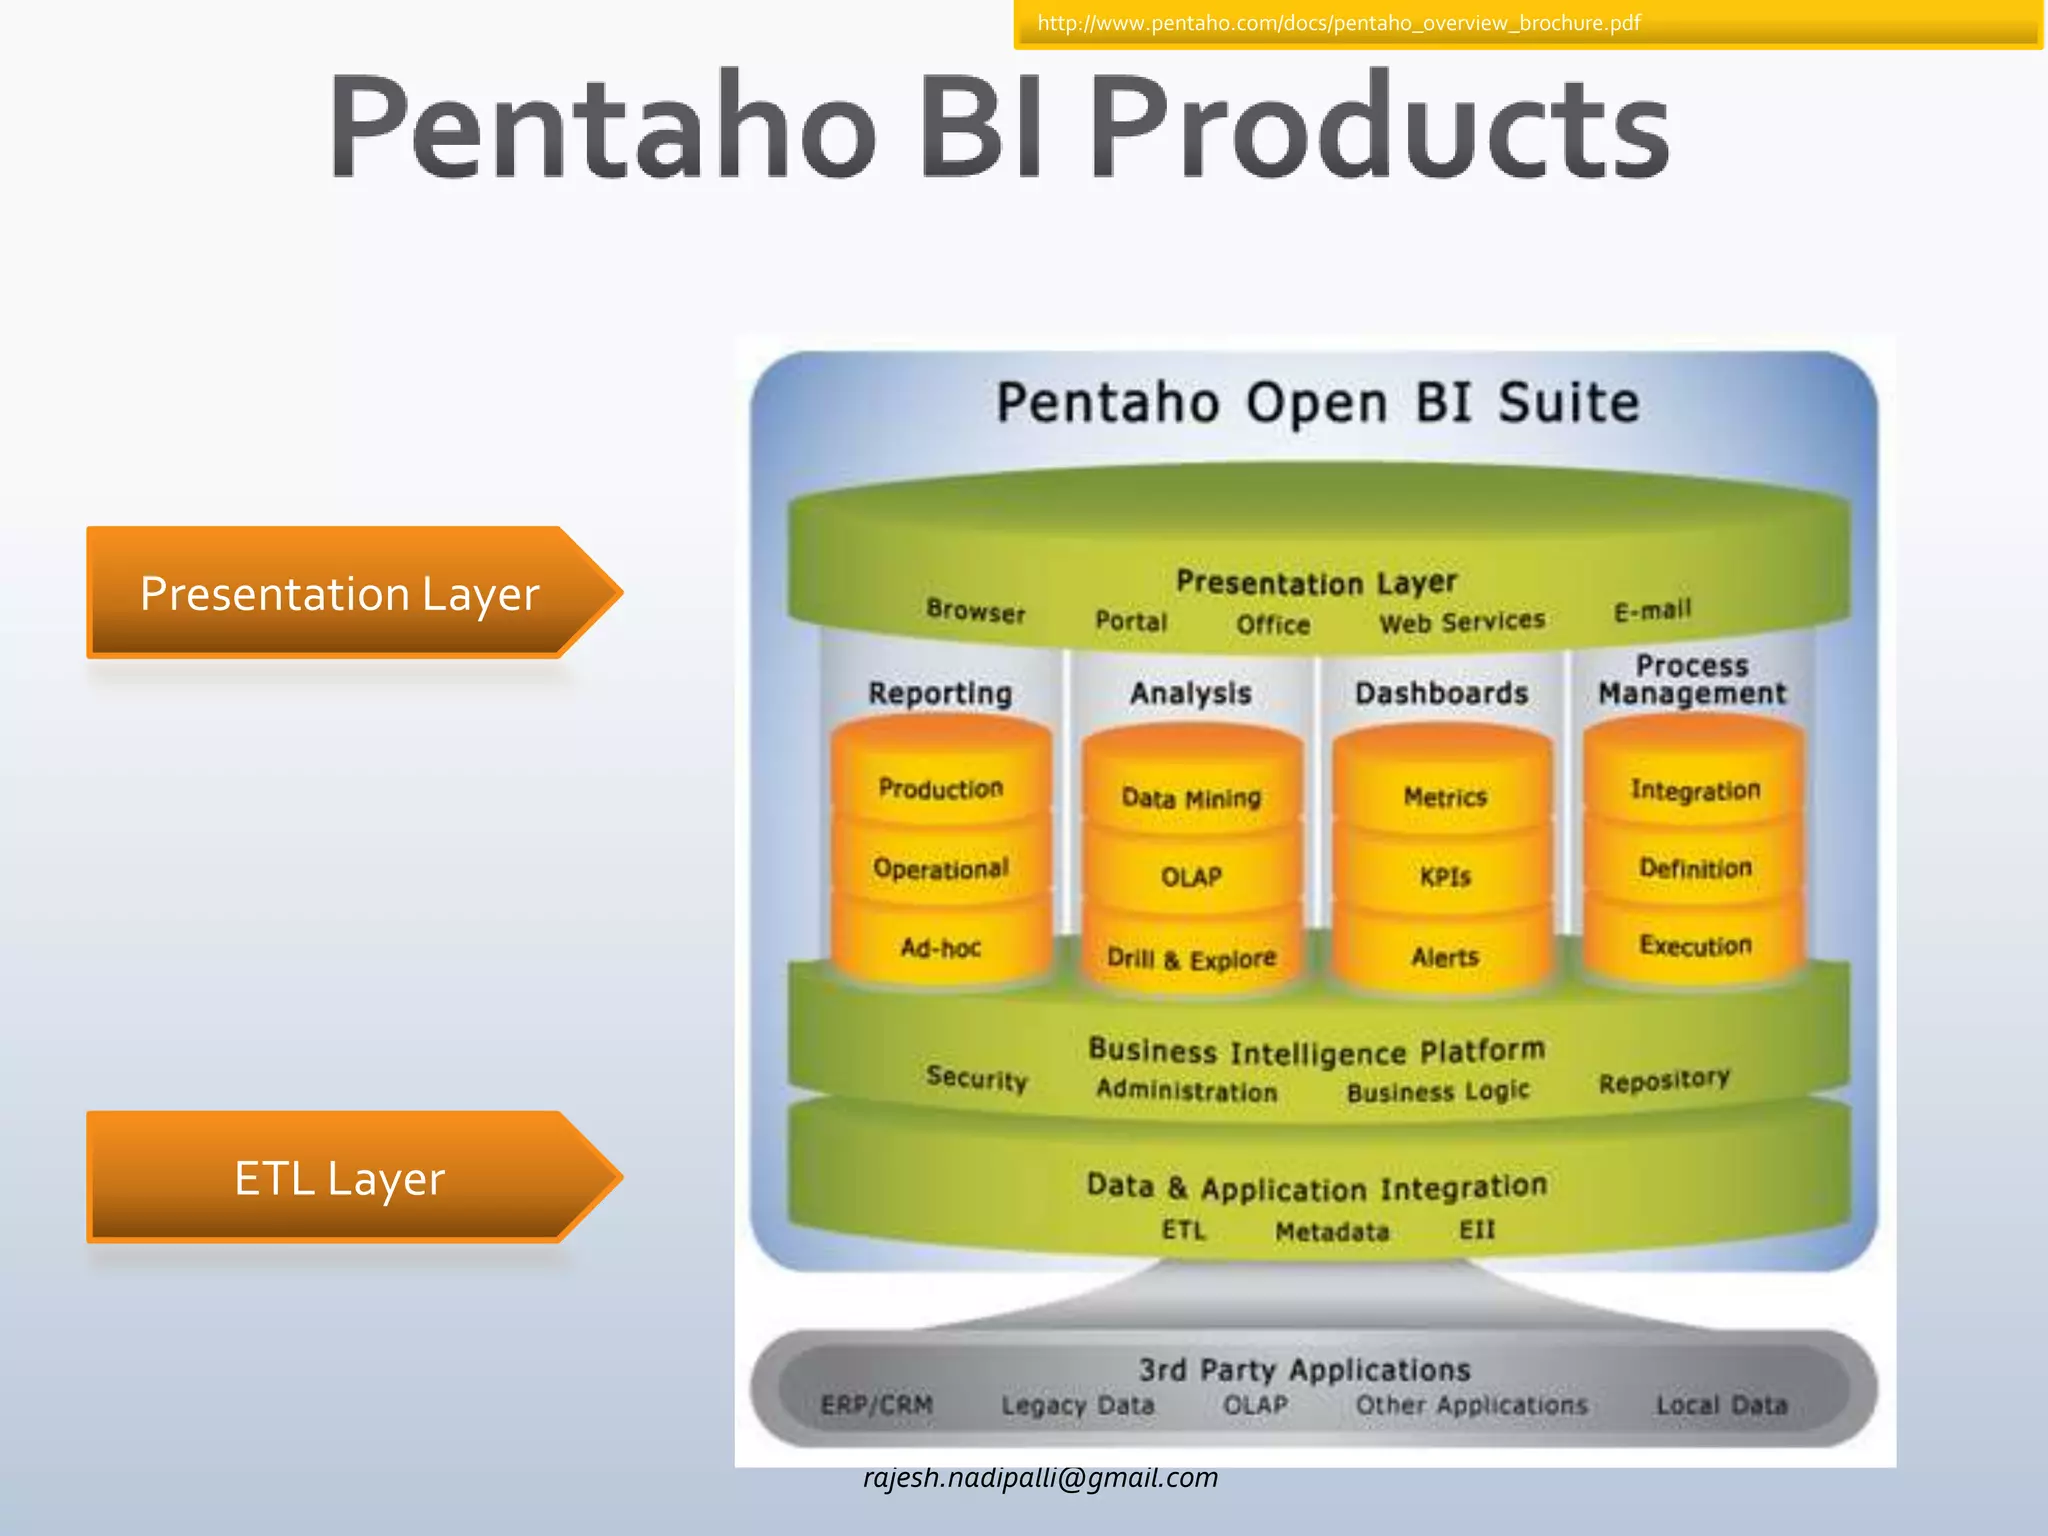
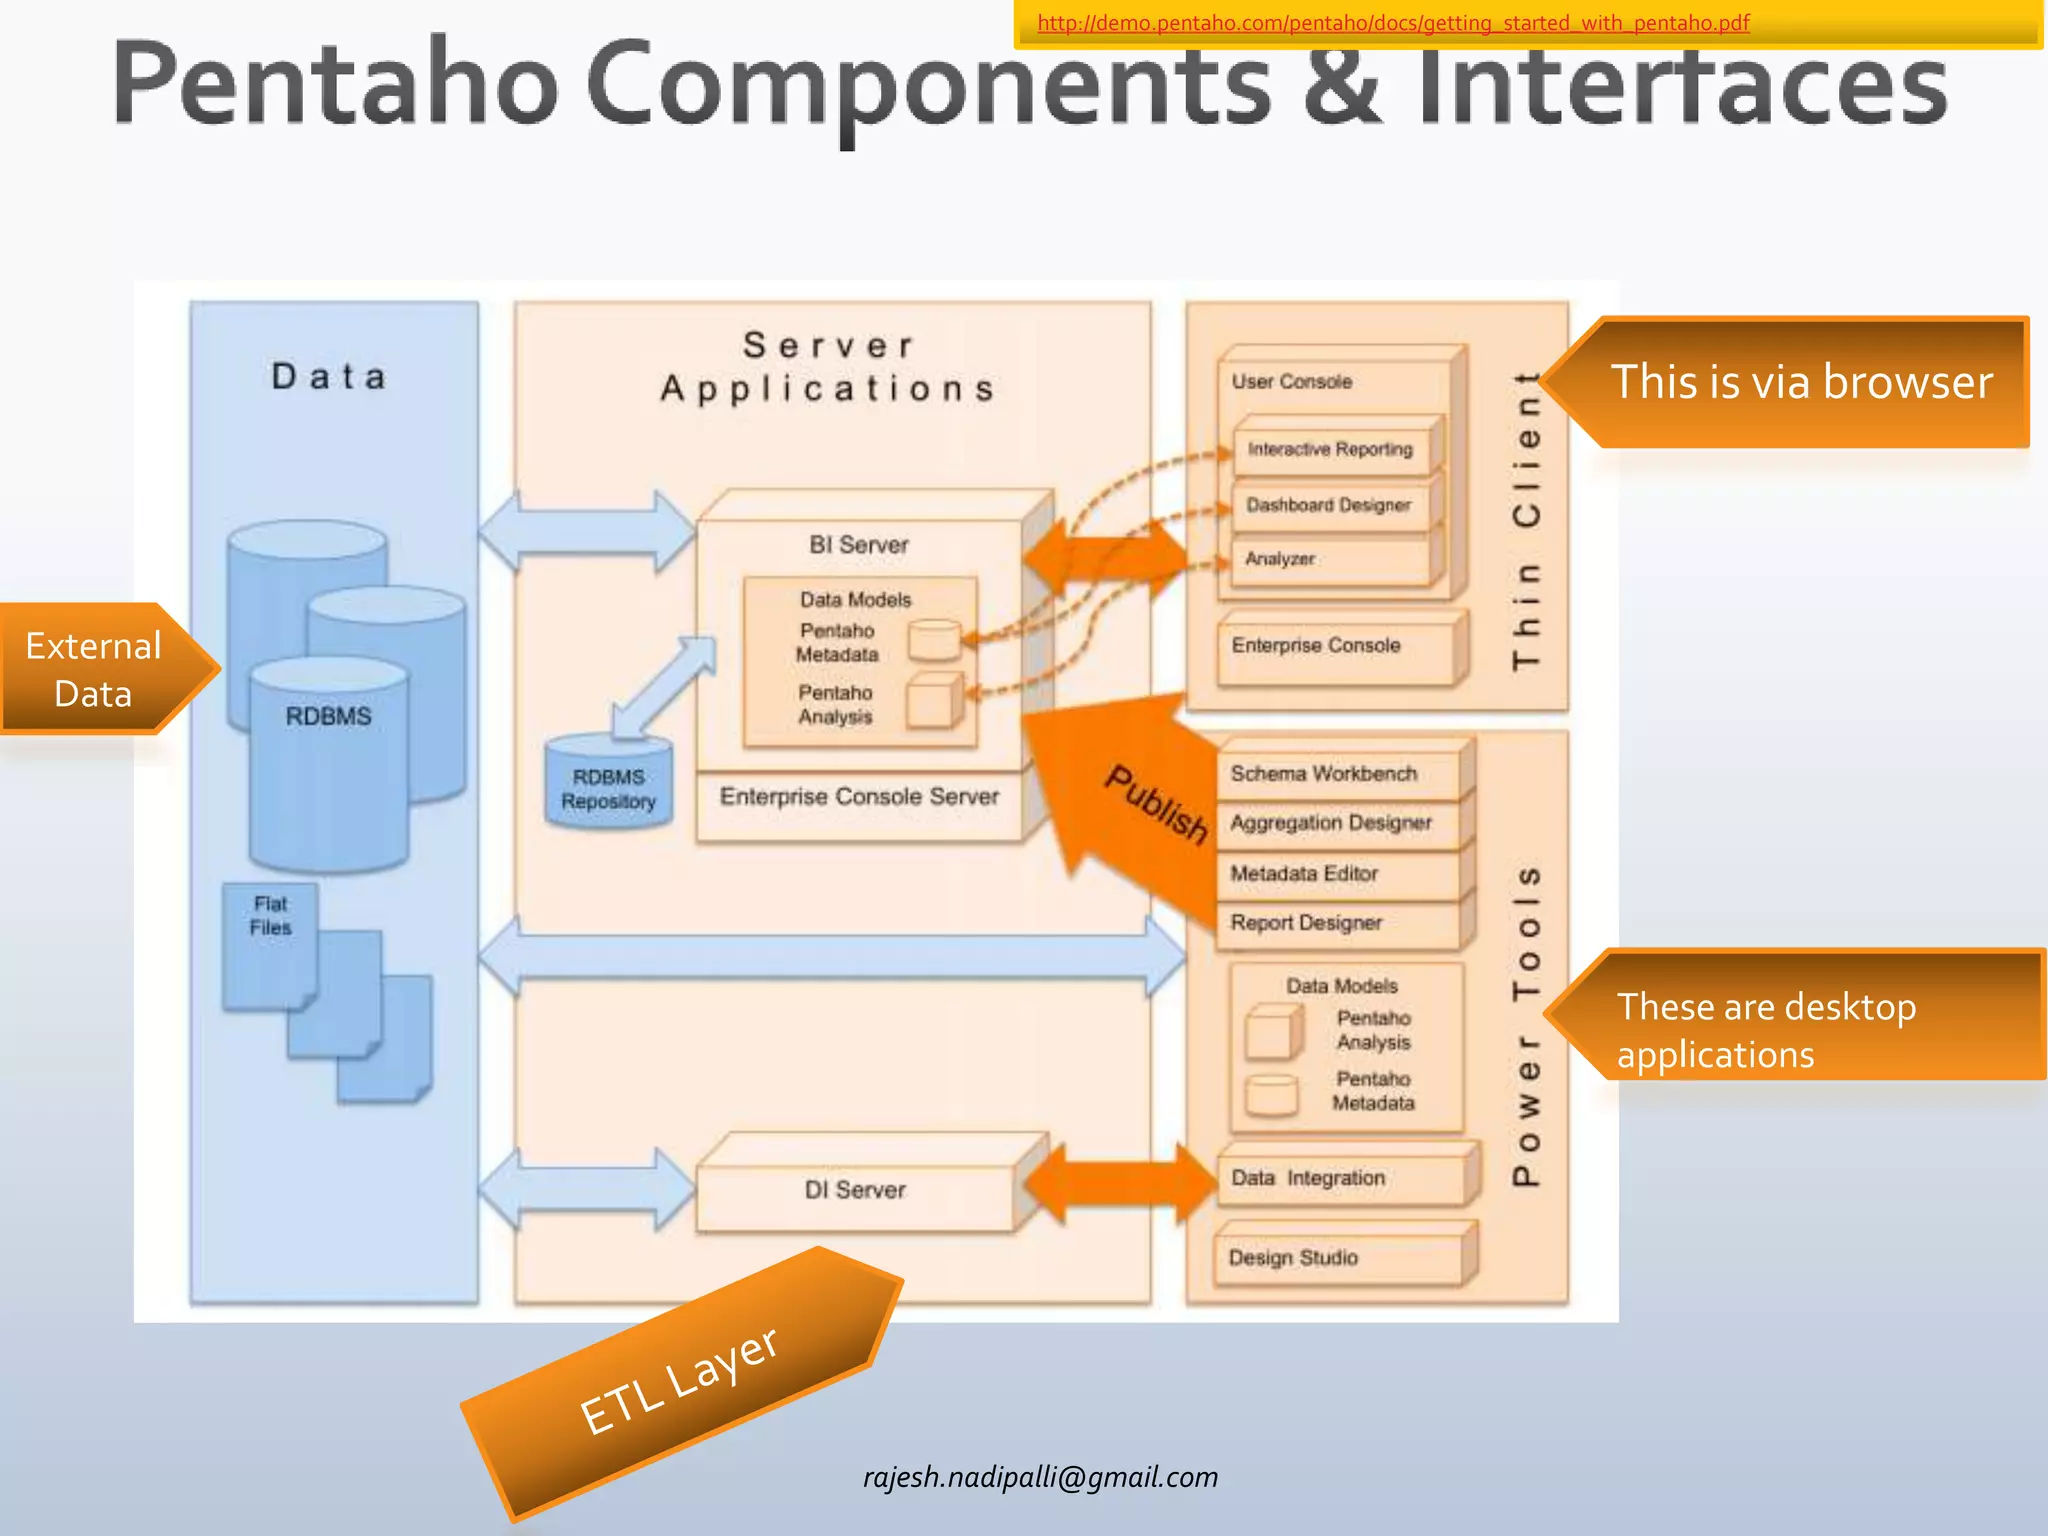
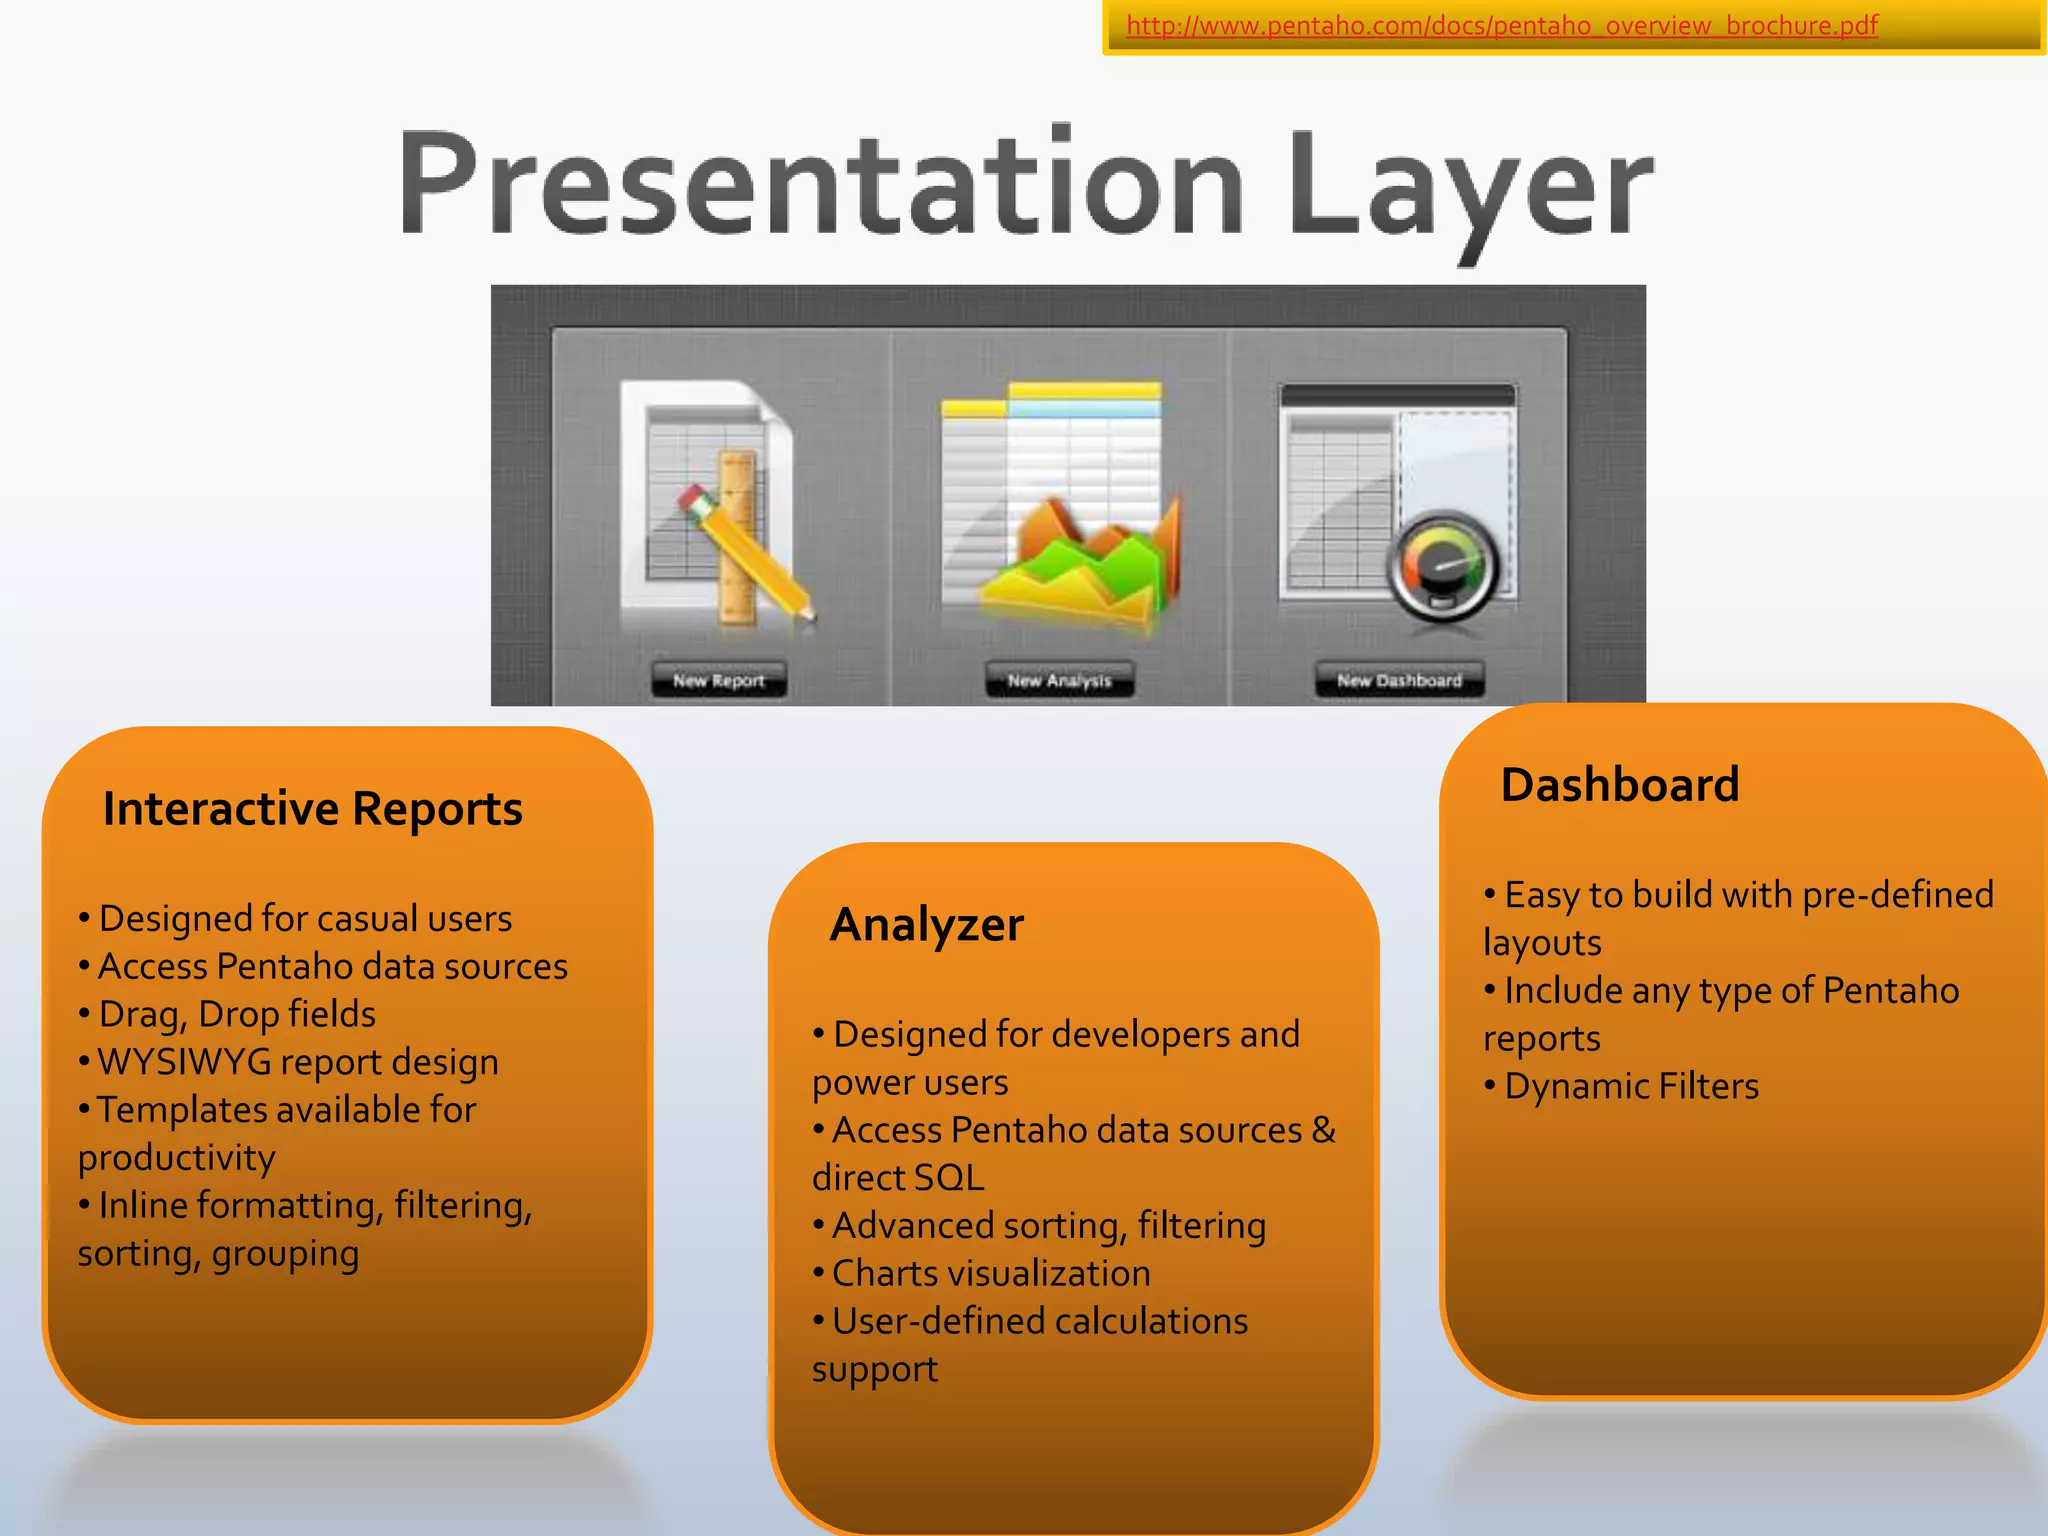
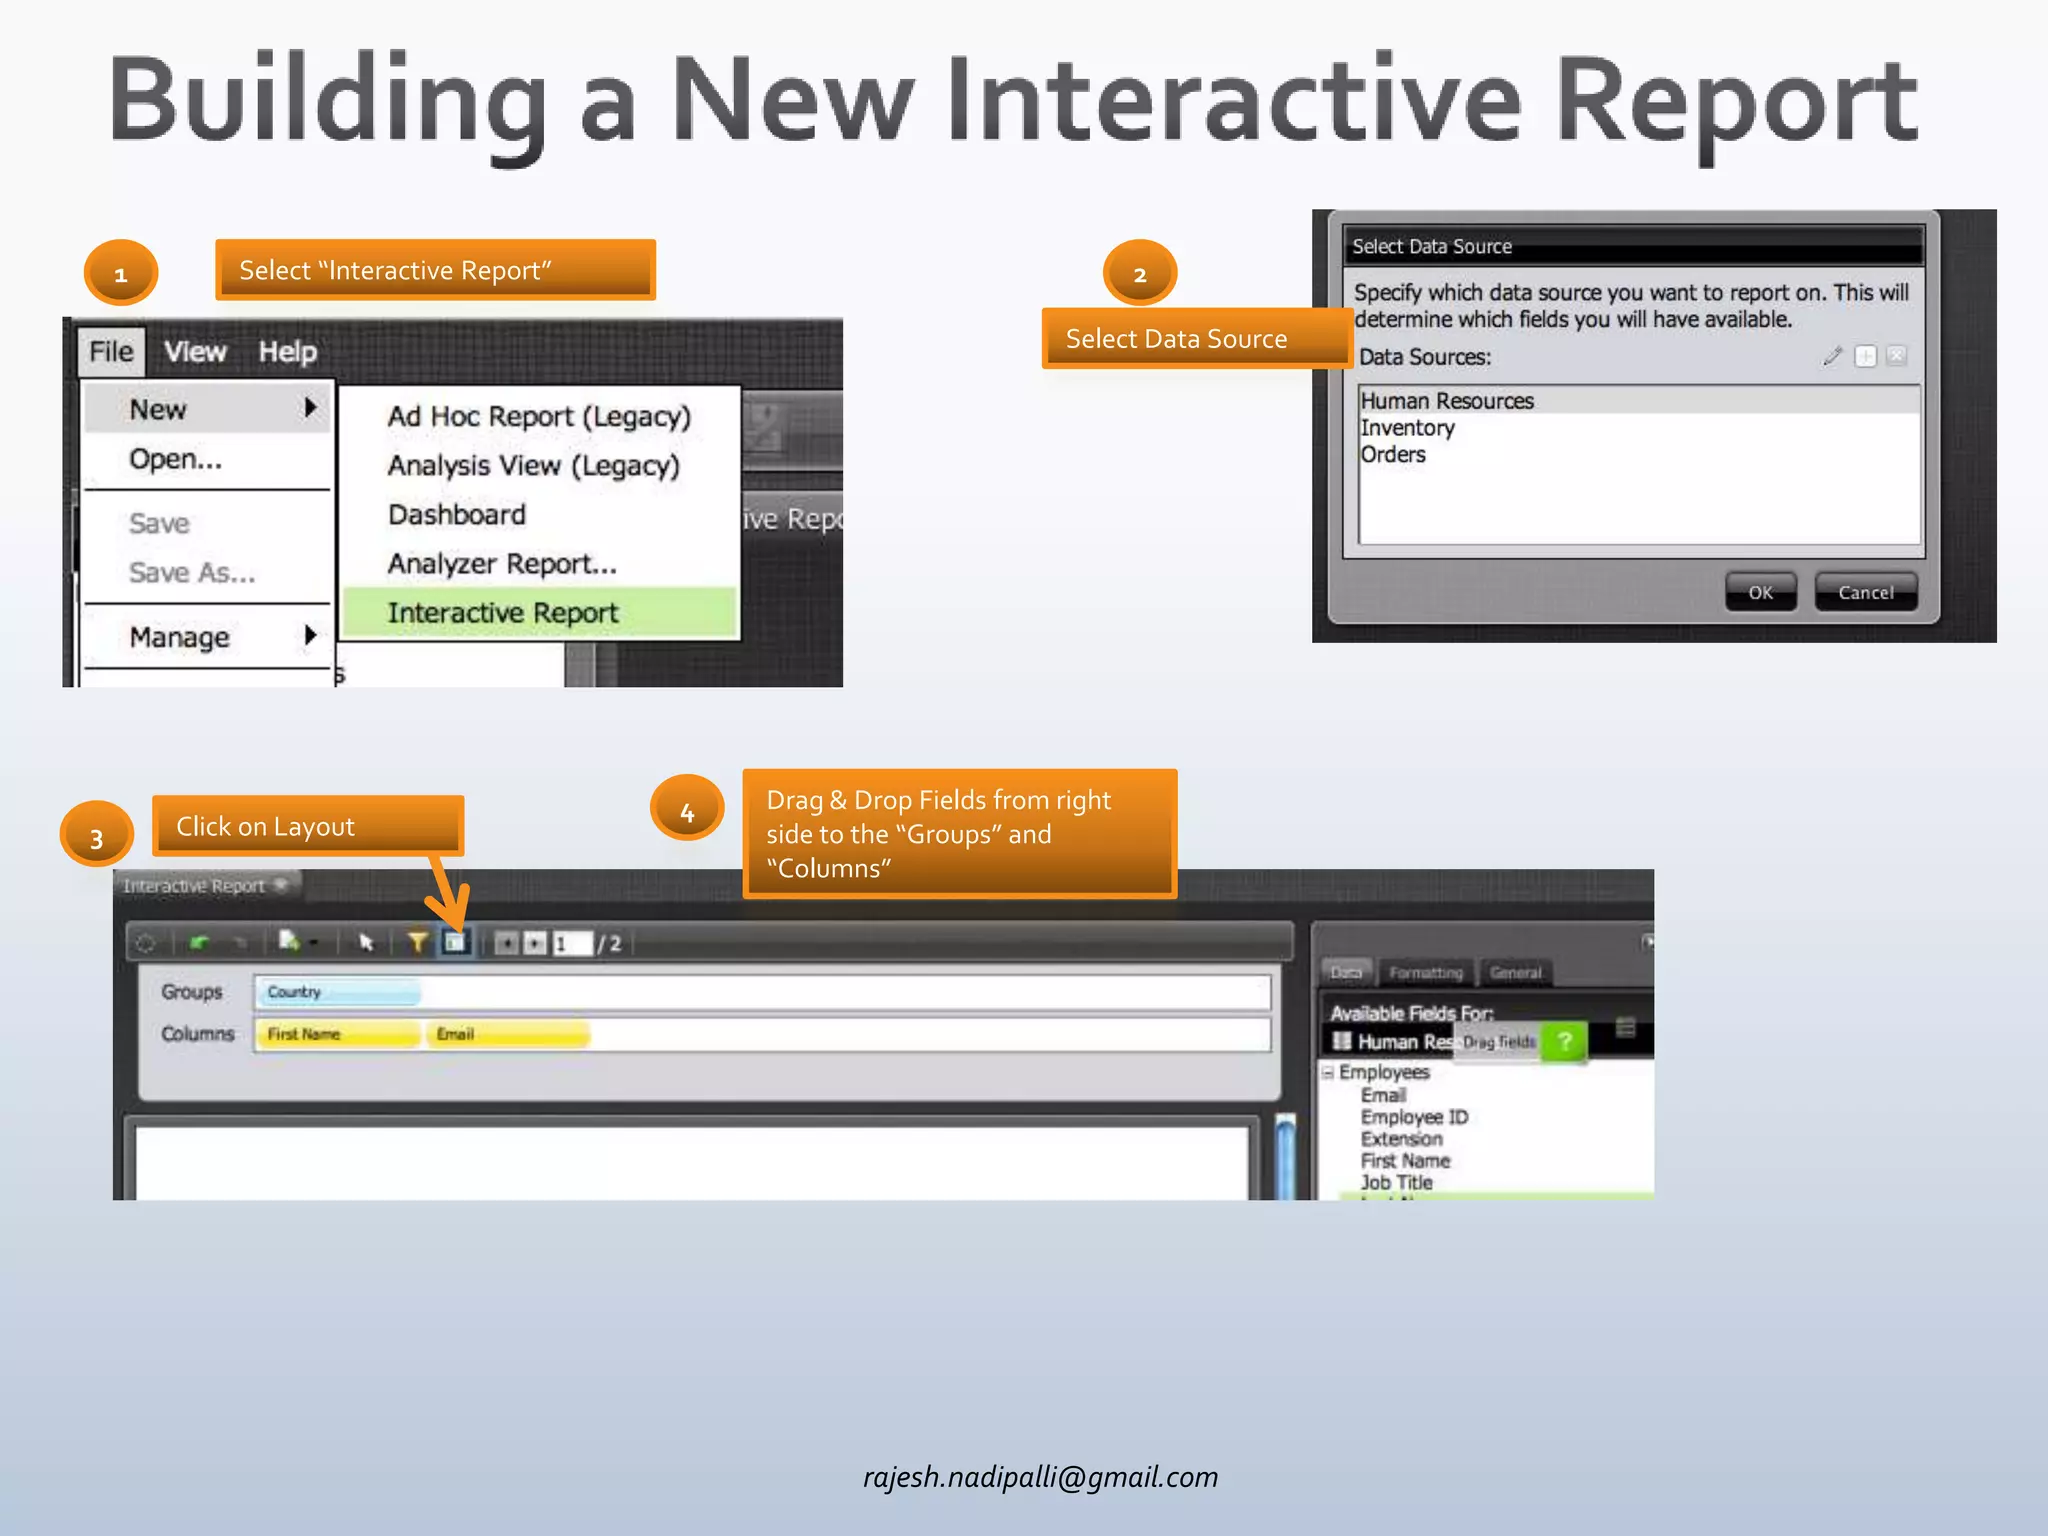
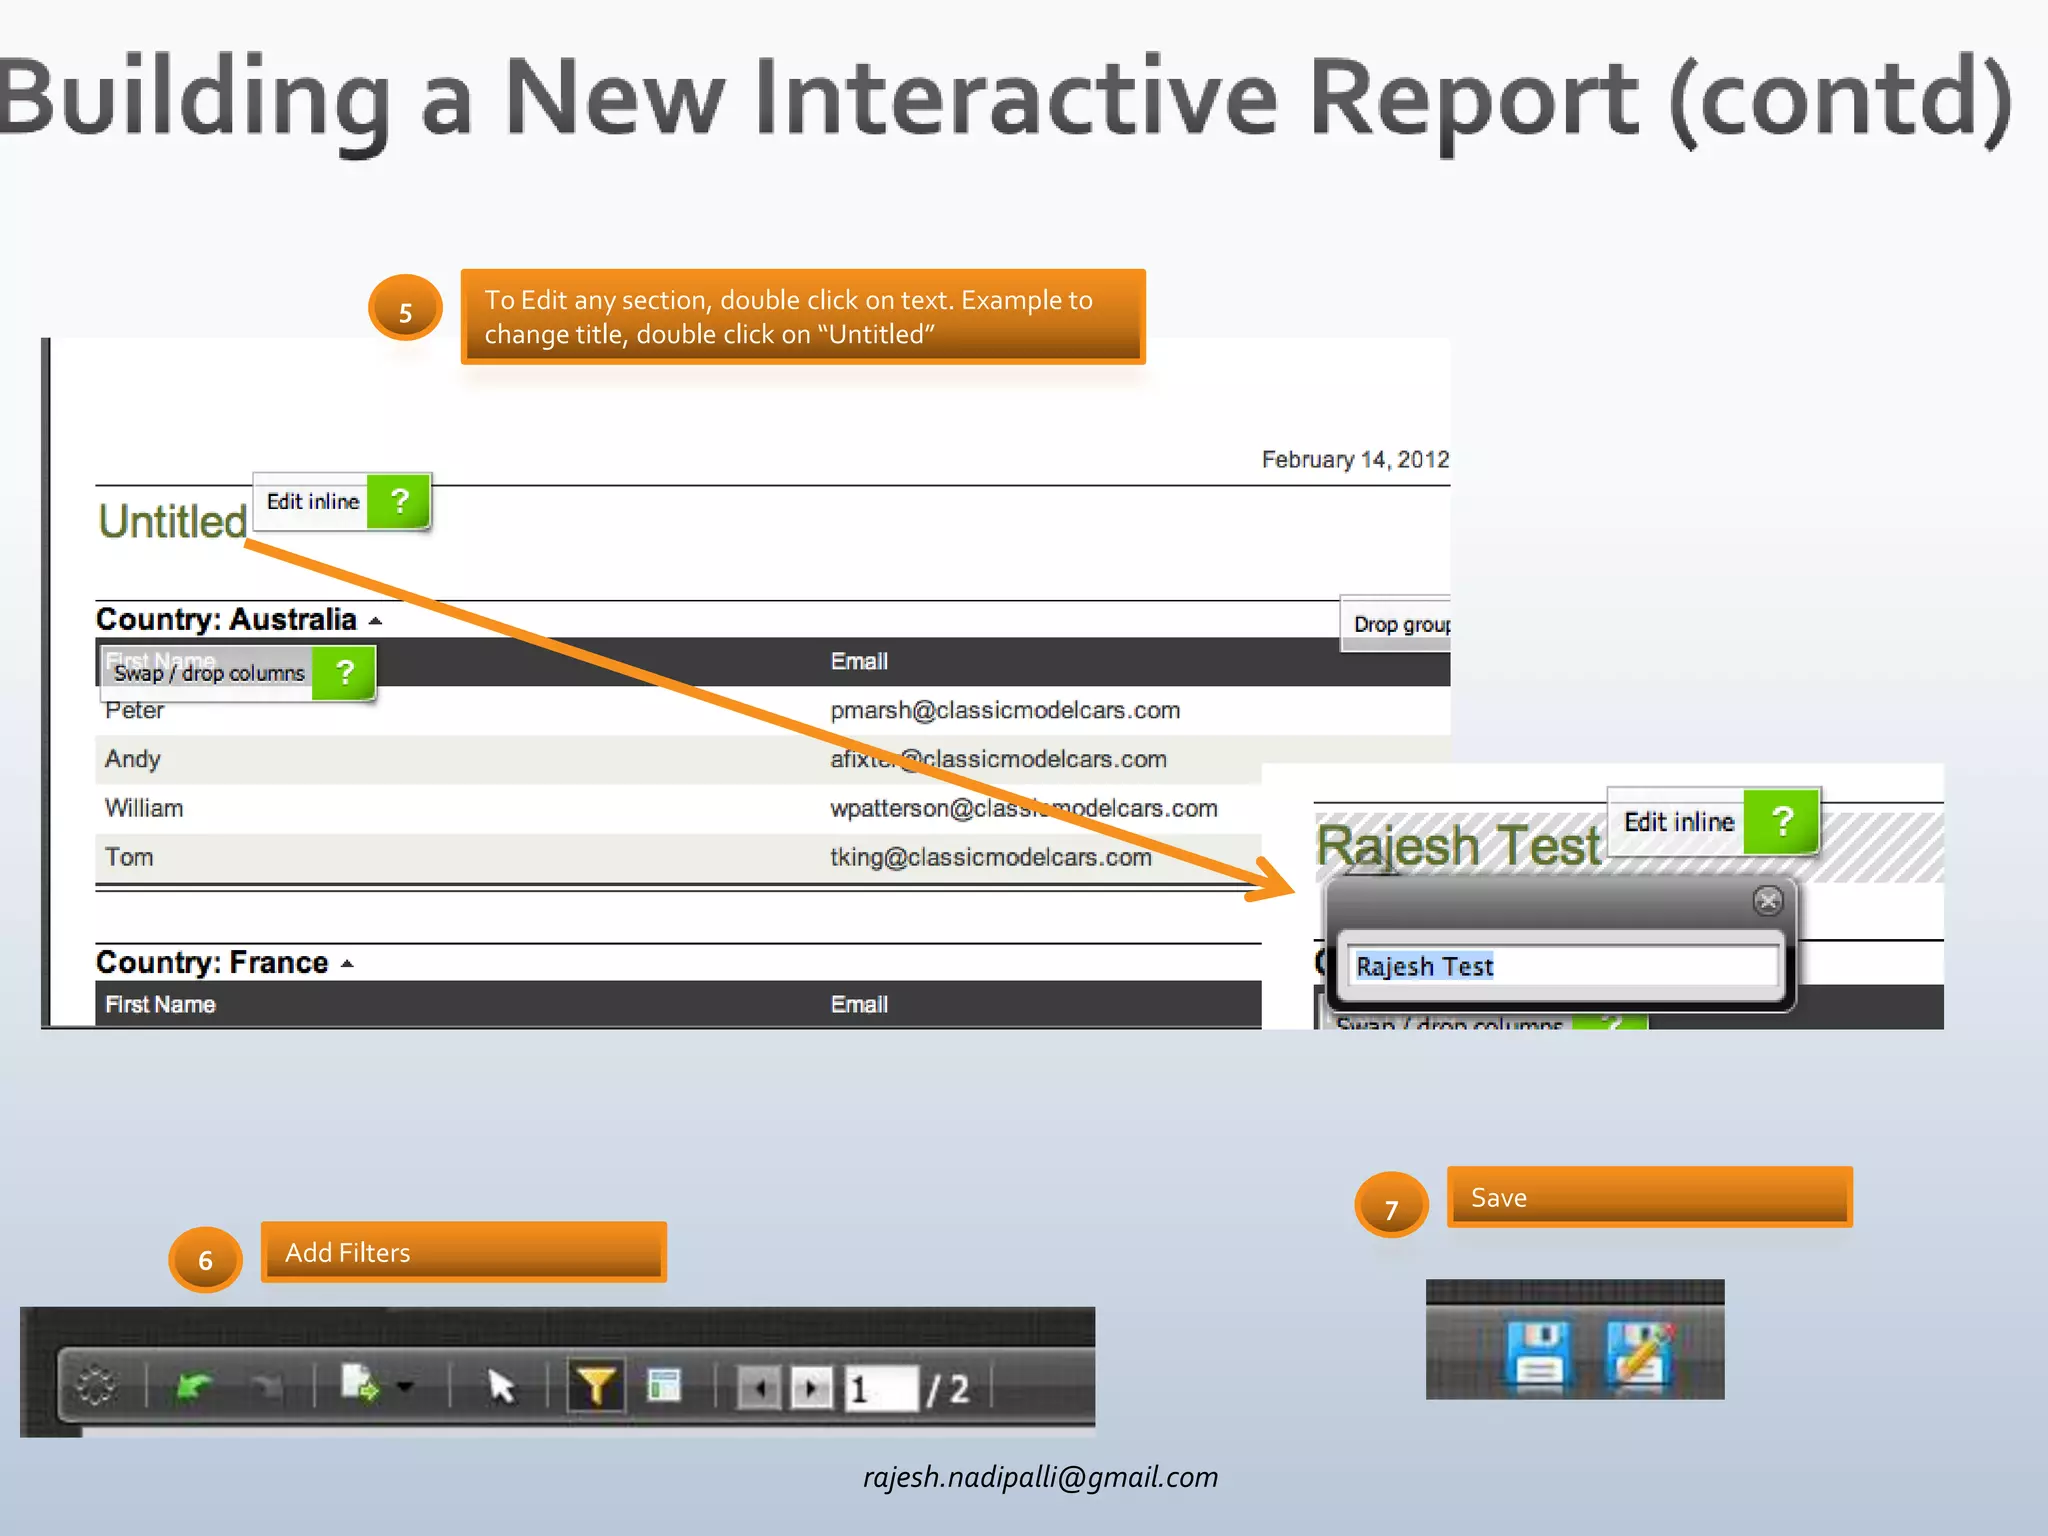
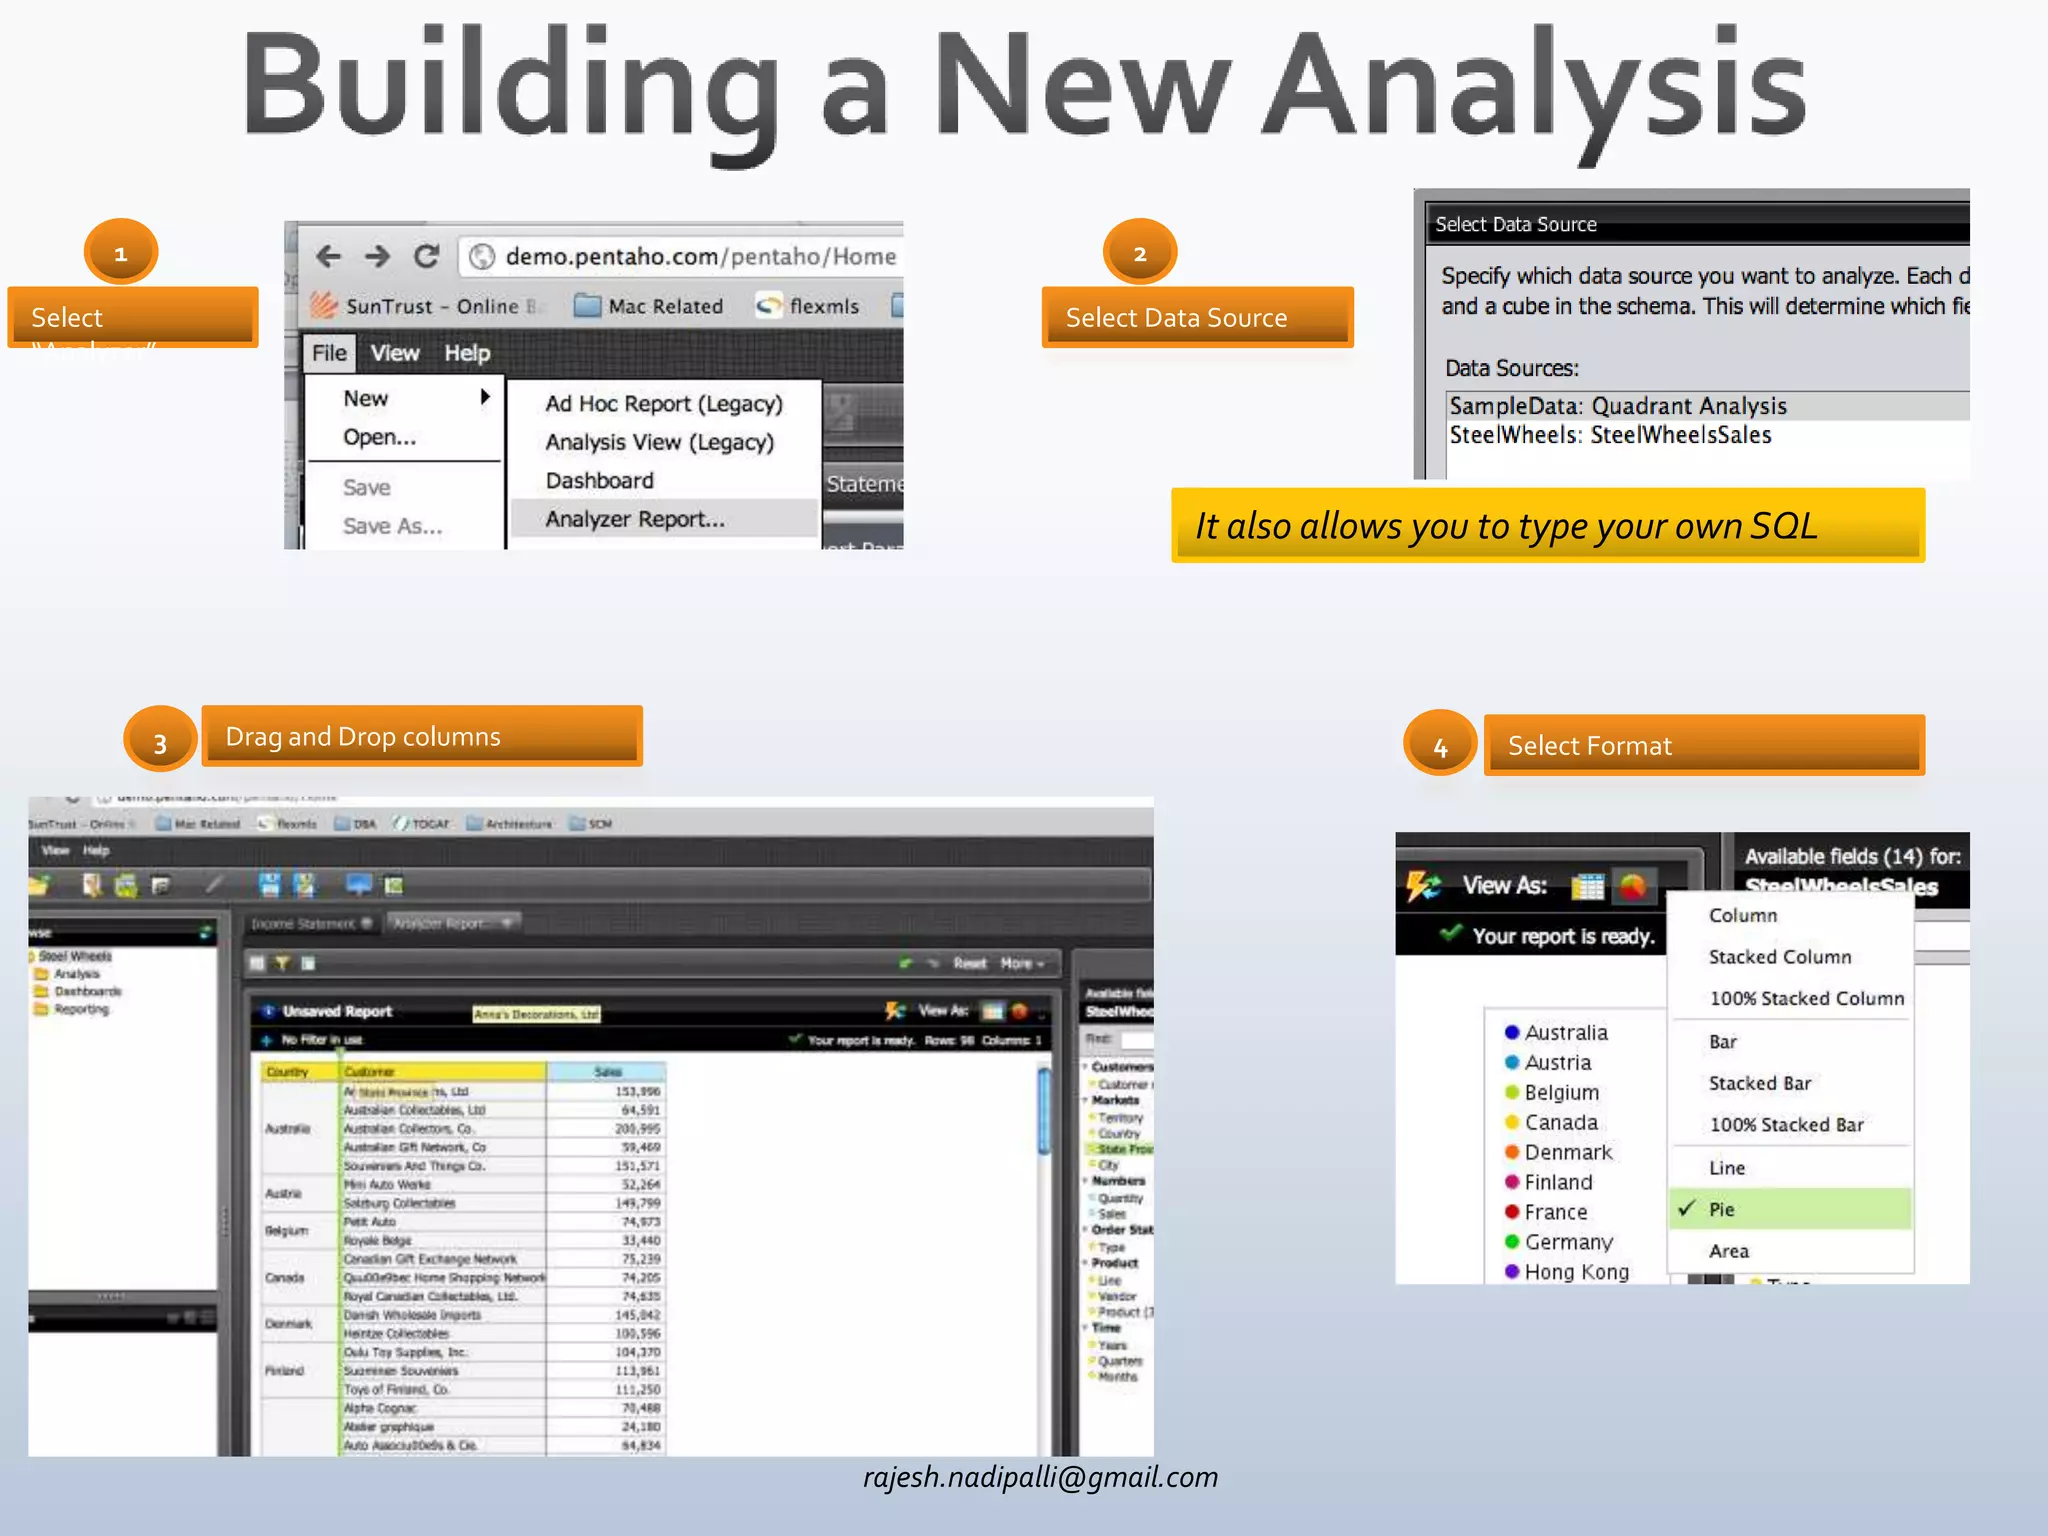
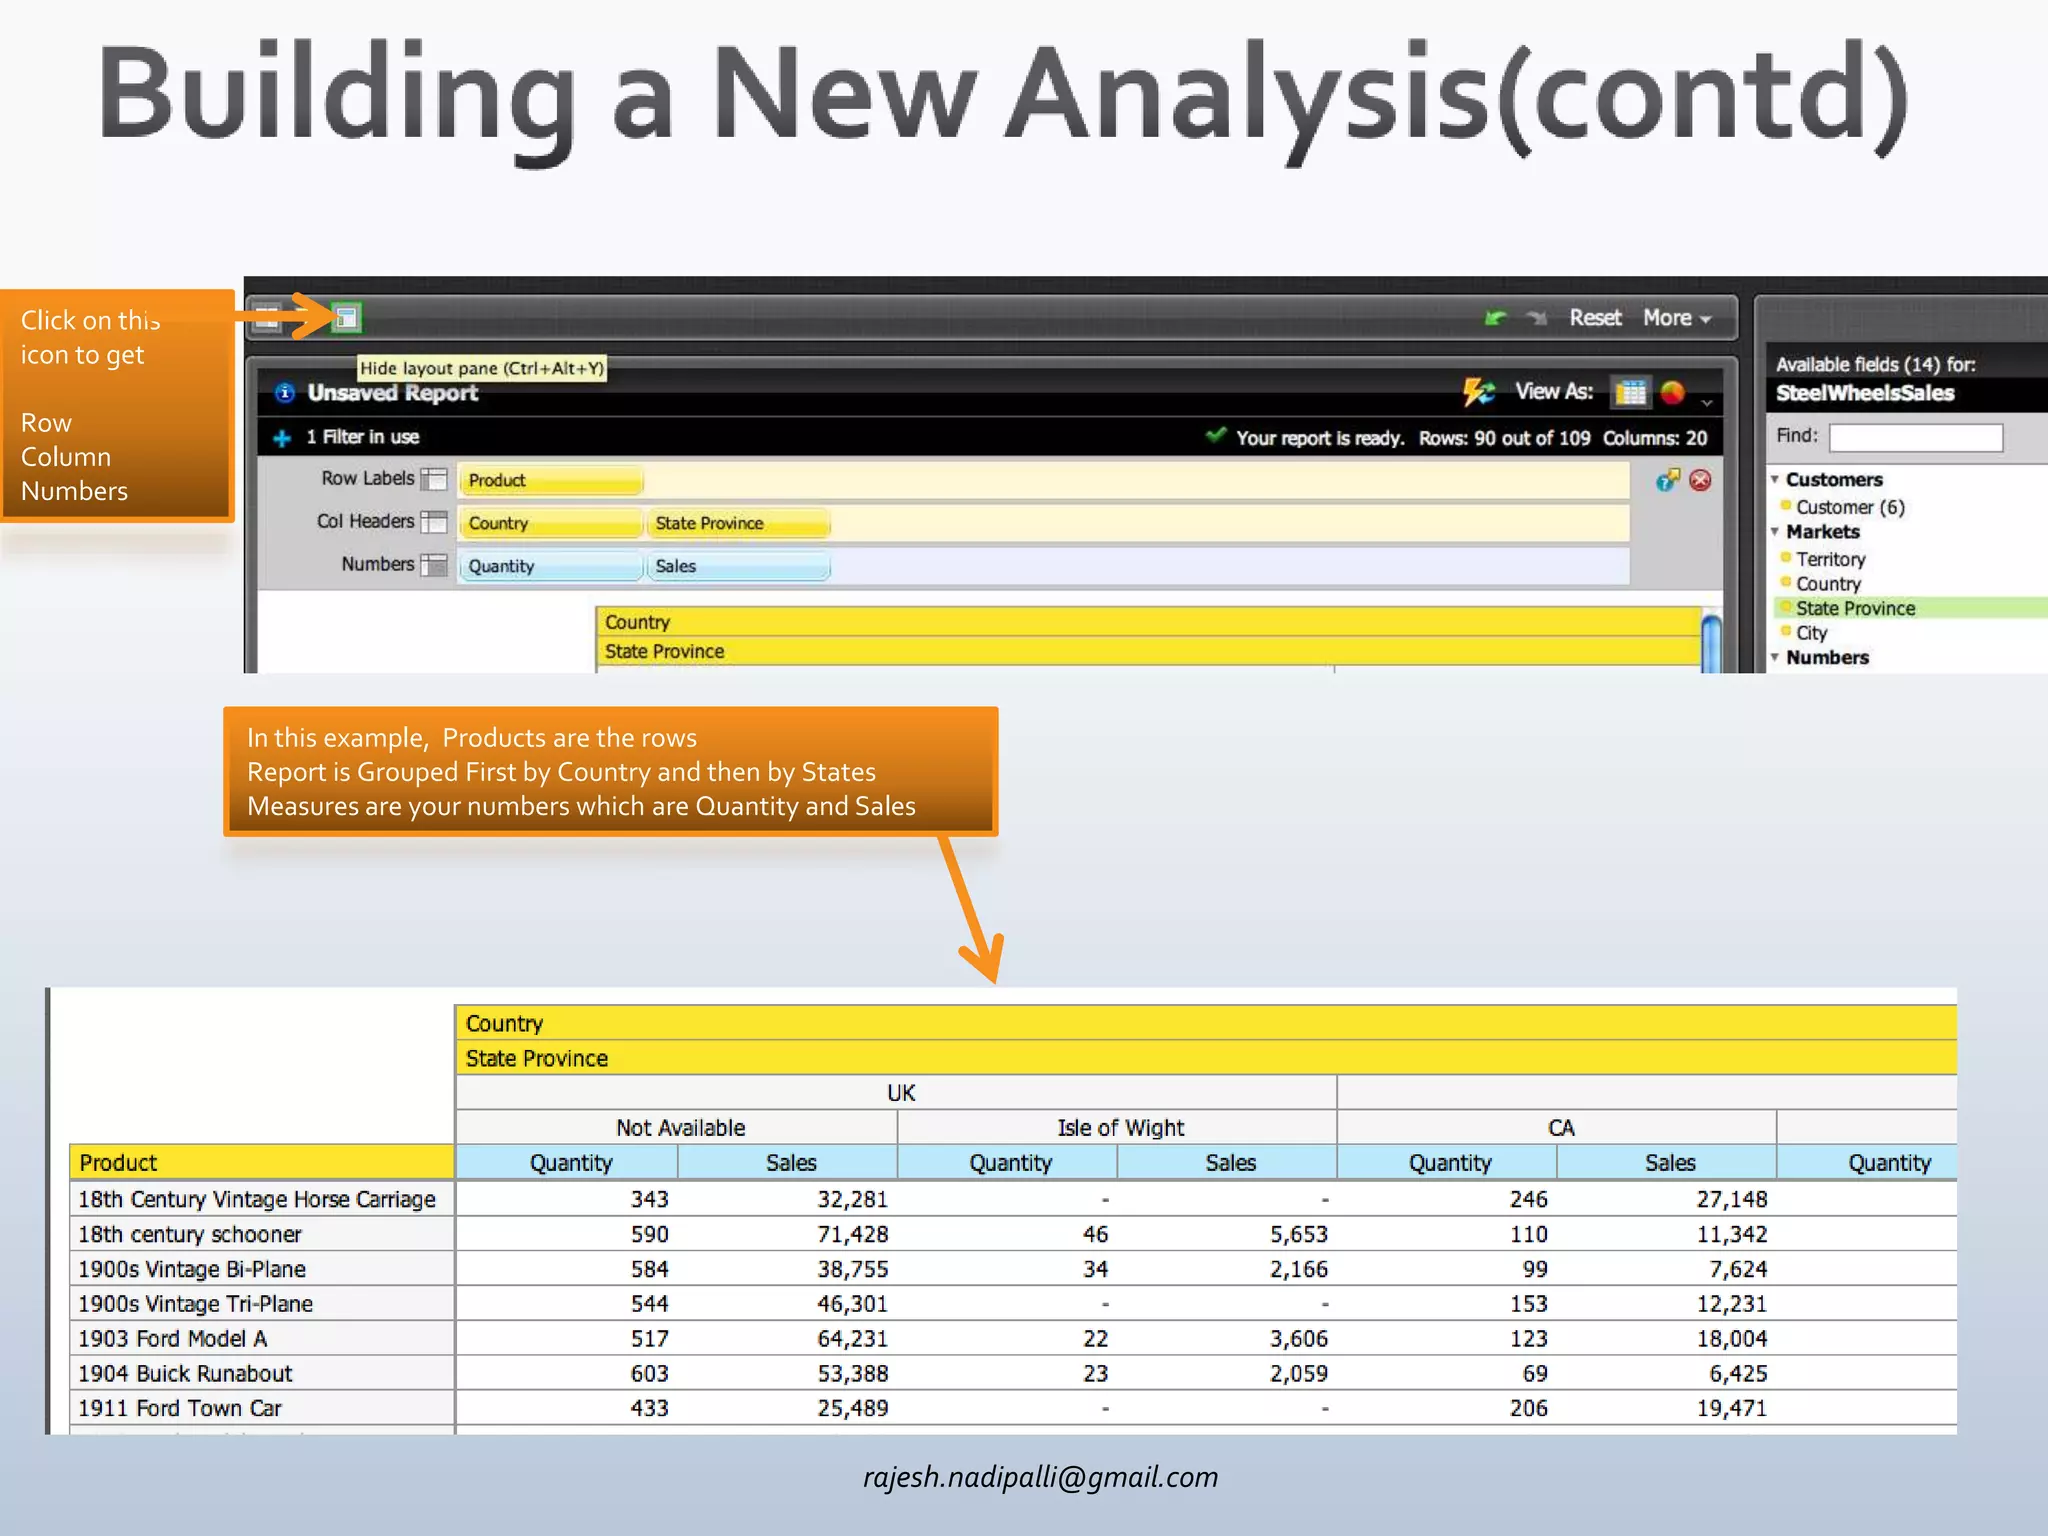
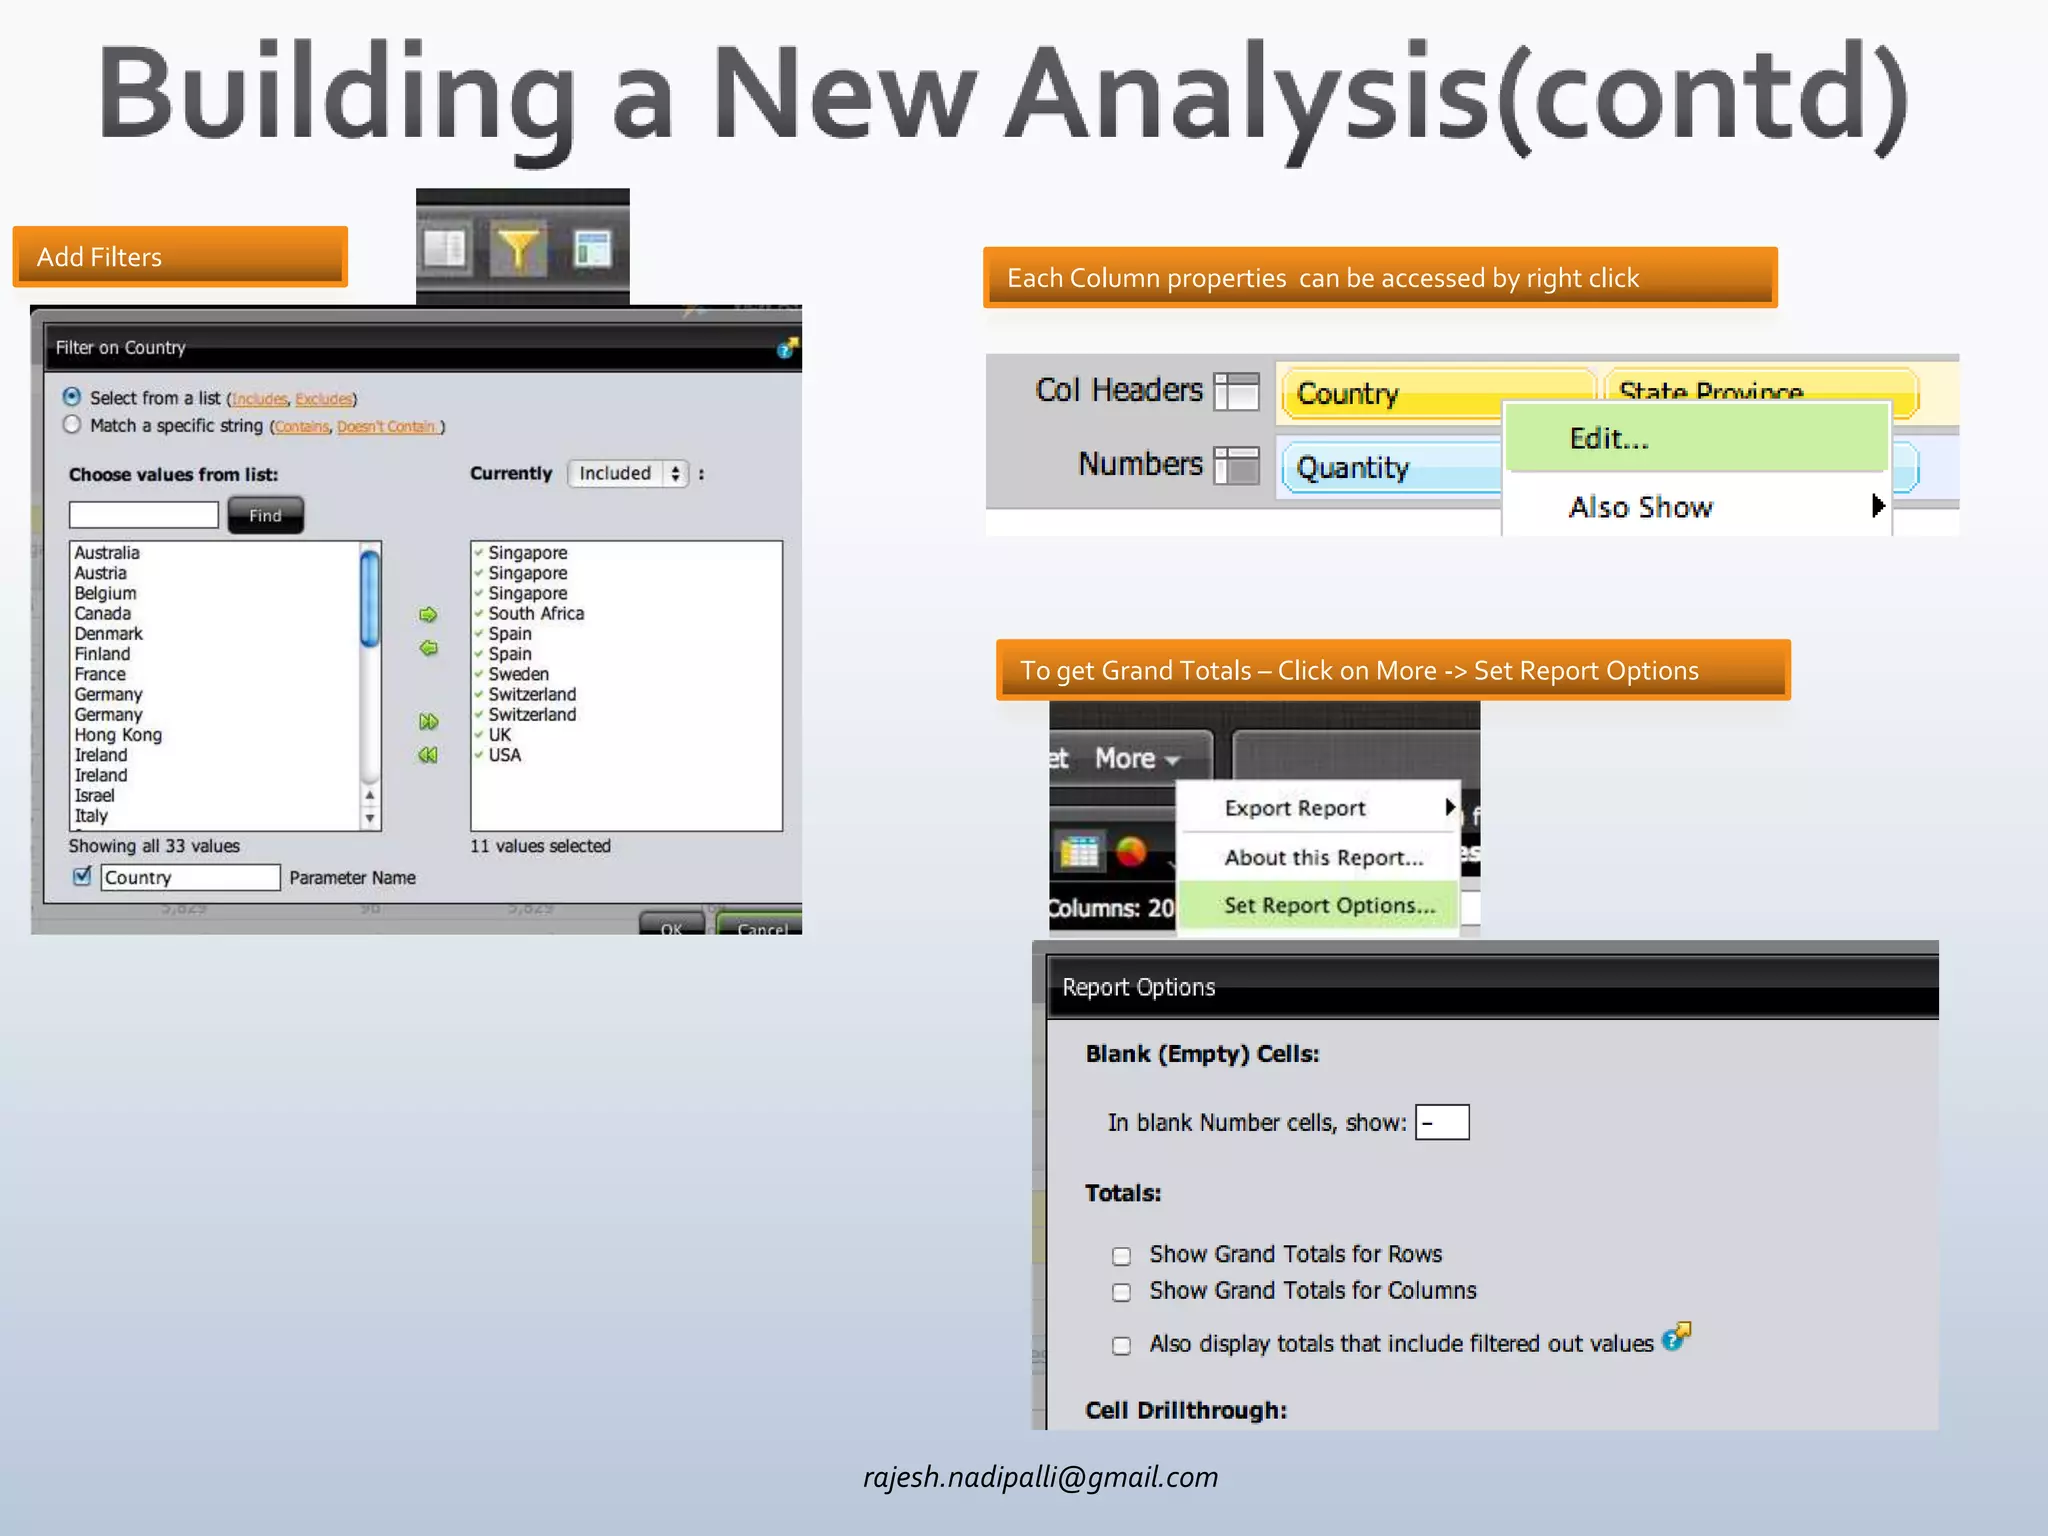
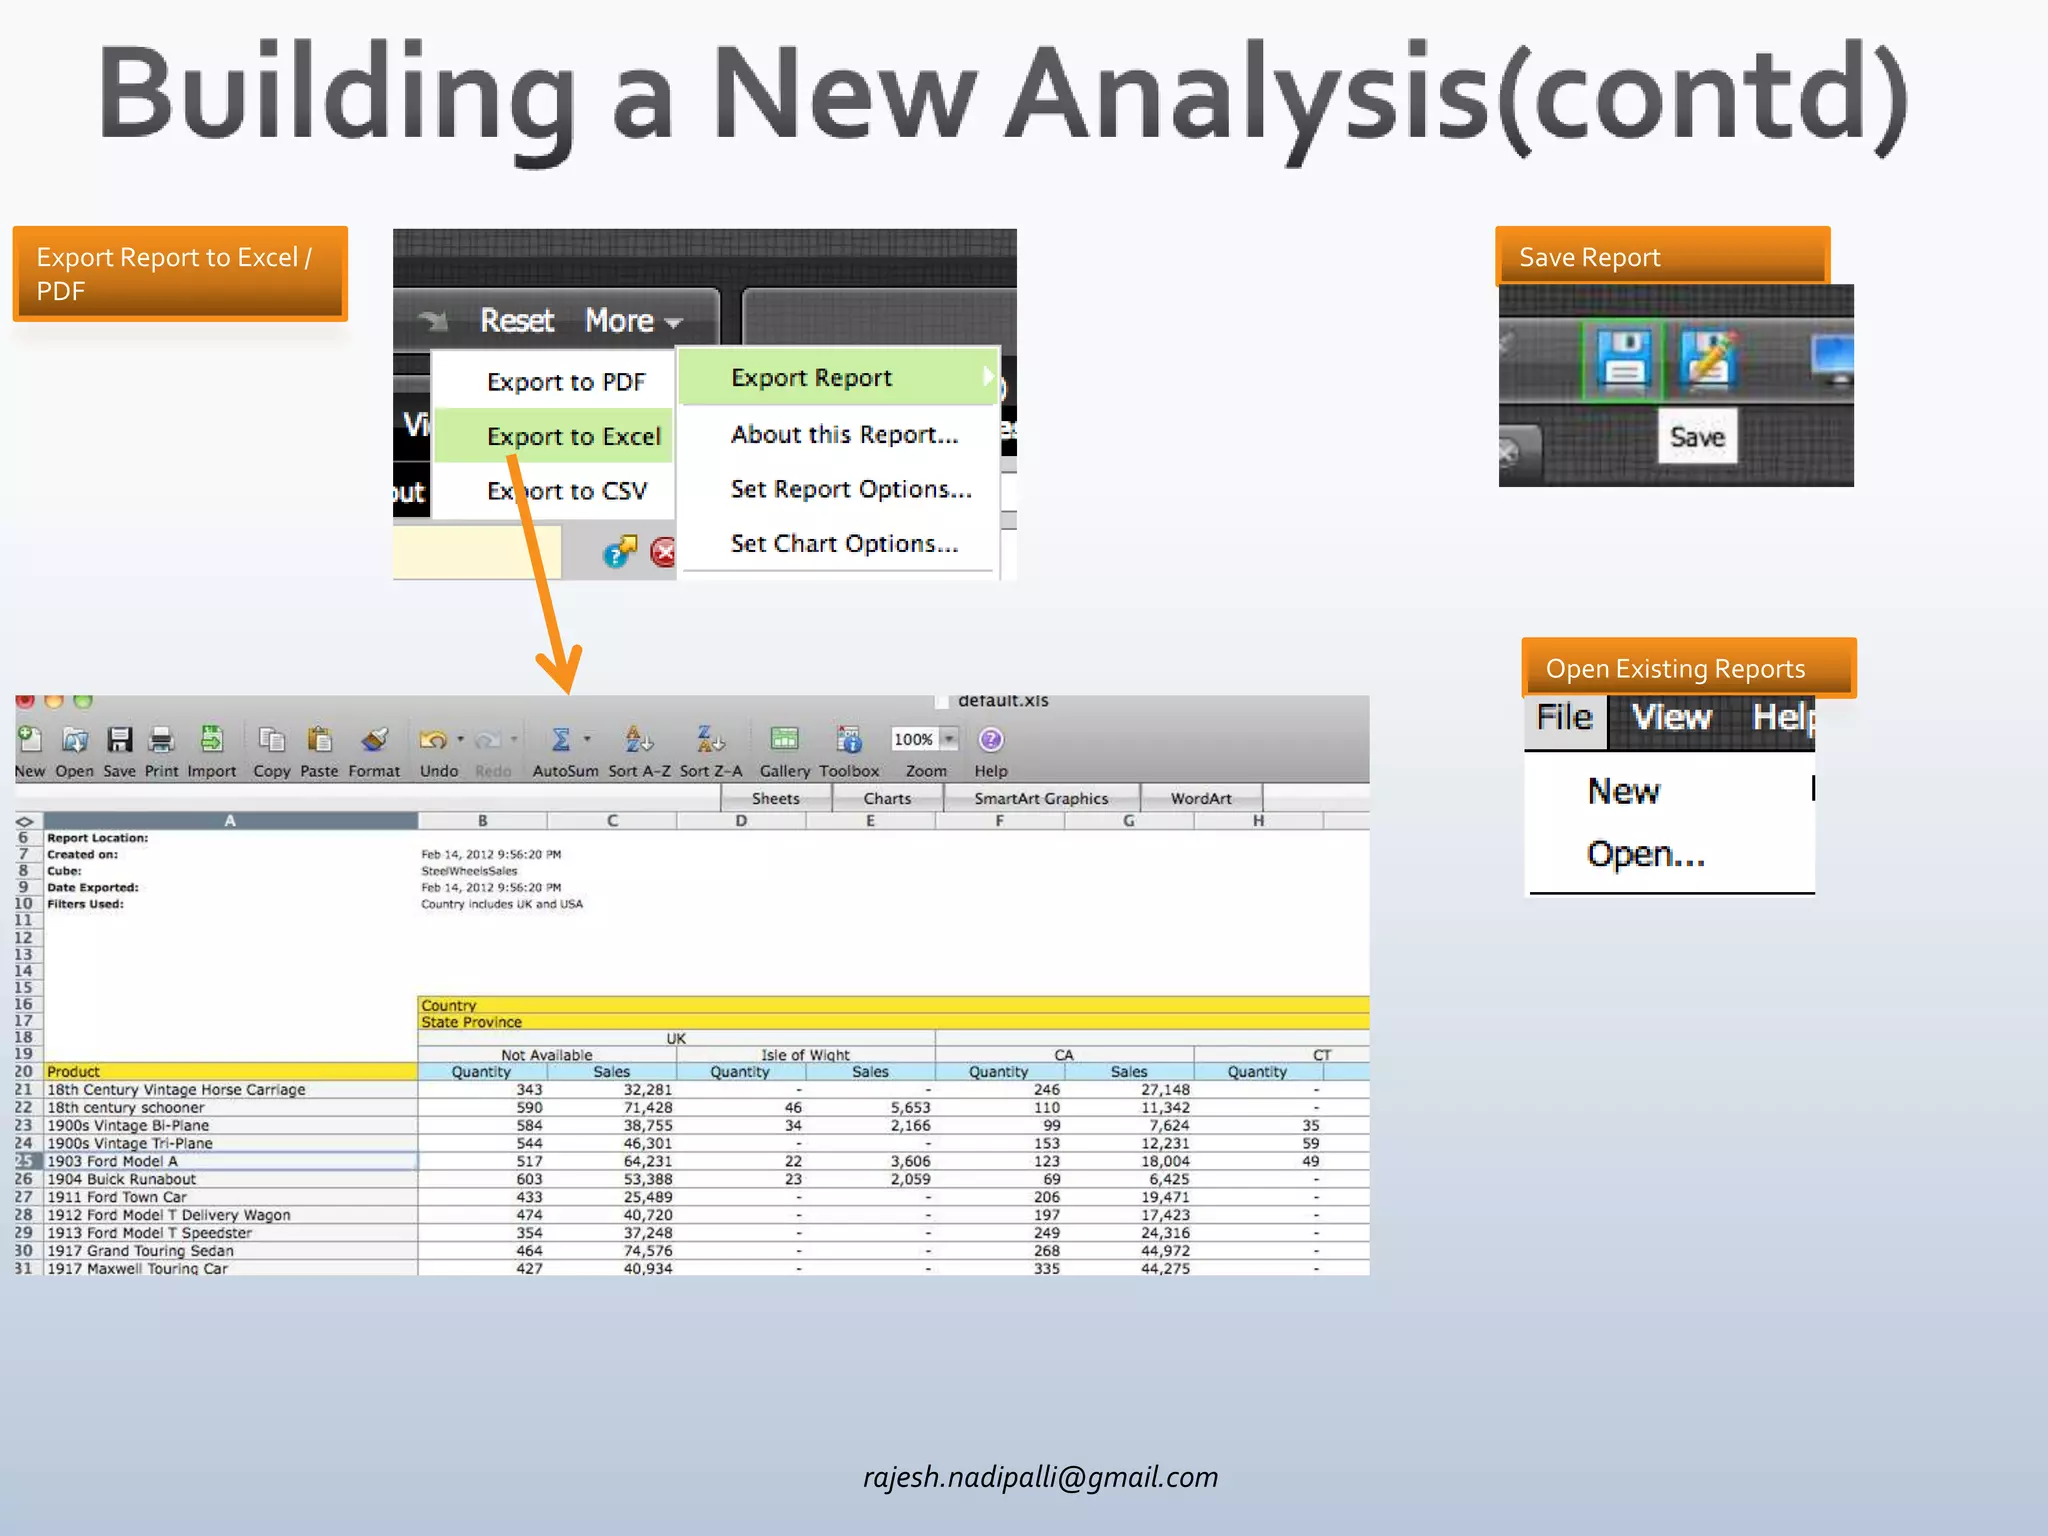
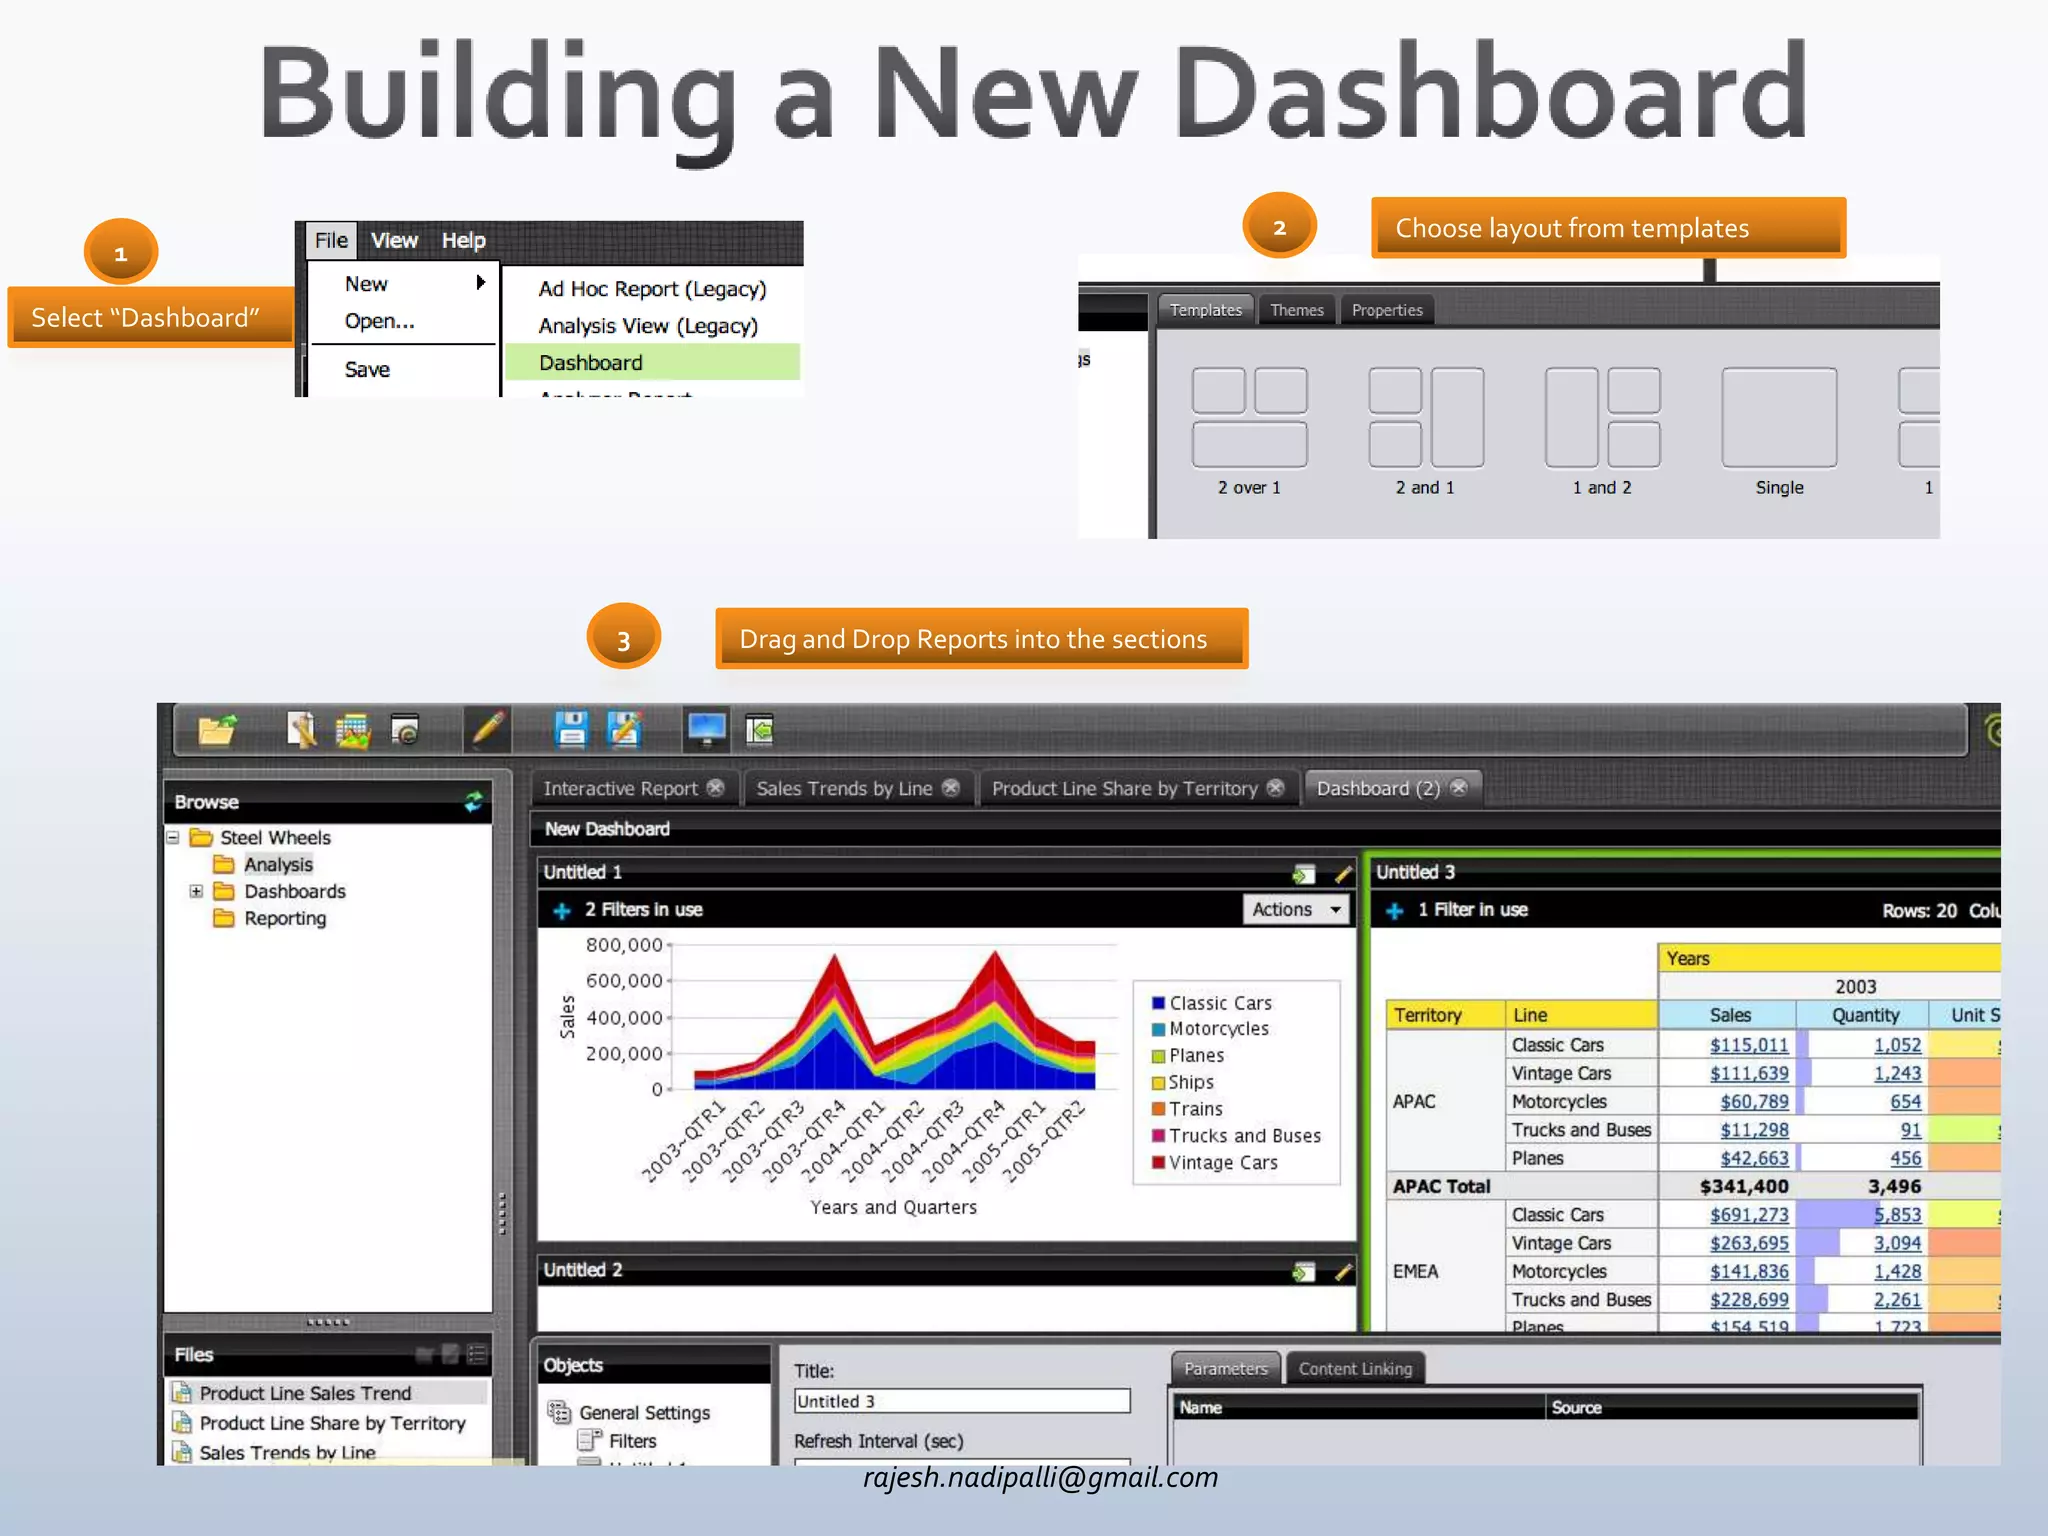
Rev 1


rajesh.nadipalli@gmail.com
Pentaho is leading Open source vendor with professional support that is
subscription based This document is just to give a quick overview of Pentaho BI
Suite (4.2) presentation layer; for product details please visit http://pentaho.com.

In the next few slides I will cover the following sections in detail:


                                  rajesh.nadipalli@gmail.com
rajesh.nadipalli@gmail.com
http://www.pentaho.com/docs/pentaho_overview_brochure.pdf


Presentation Layer


    ETL Layer


                     rajesh.nadipalli@gmail.com
http://demo.pentaho.com/pentaho/docs/getting_started_with_pentaho.pdf


                                                                              This is via browser


External
 Data


                                                                               These are desktop
                                                                               applications


           rajesh.nadipalli@gmail.com
http://www.pentaho.com/docs/pentaho_overview_brochure.pdf


 Interactive Reports                                                                Dashboard

                                                                                   • Easy to build with pre-defined
• Designed for casual users        Analyzer                                        layouts
• Access Pentaho data sources
                                                                                   • Include any type of Pentaho
• Drag, Drop fields
                                  • Designed for developers and                    reports
• WYSIWYG report design
                                  power users                                      • Dynamic Filters
• Templates available for
                                  • Access Pentaho data sources &
productivity
                                  direct SQL
• Inline formatting, filtering,
                                  • Advanced sorting, filtering
sorting, grouping
                                  • Charts visualization
                                  • User-defined calculations
                                  support

                                     rajesh.nadipalli@gmail.com
rajesh.nadipalli@gmail.com
1        Select “Interactive Report”                                       2

                                                                        Select Data Source


                                           4   Drag & Drop Fields from right
3       Click on Layout                        side to the “Groups” and
                                               “Columns”


                                                       rajesh.nadipalli@gmail.com
5    To Edit any section, double click on text. Example to
                  change title, double click on “Untitled”


                                                                               7   Save

6   Add Filters


                                                  rajesh.nadipalli@gmail.com
rajesh.nadipalli@gmail.com
1                                                  2

Select                                              Select Data Source
“Analyzer”


                                                              It also allows you to type your own SQL


          3   Drag and Drop columns                                         4    Select Format


                                      rajesh.nadipalli@gmail.com
Click on this
icon to get

Row
Column
Numbers


                In this example, Products are the rows
                Report is Grouped First by Country and then by States
                Measures are your numbers which are Quantity and Sales


                                                                 rajesh.nadipalli@gmail.com
Add Filters
                        Each Column properties can be accessed by right click


                         To get Grand Totals – Click on More -> Set Report Options


              rajesh.nadipalli@gmail.com
Export Report to Excel /                                Save Report
PDF


                                                          Open Existing Reports


                           rajesh.nadipalli@gmail.com
rajesh.nadipalli@gmail.com
2   Choose layout from templates
      1

Select “Dashboard”


                     3   Drag and Drop Reports into the sections


                                   rajesh.nadipalli@gmail.com
rajesh.nadipalli@gmail.com
http://wiki.pentaho.com/display/ServerDoc2x/01.+Metadata+Business+Model+Overview


rajesh.nadipalli@gmail.com

Pentaho bi suite overview presentation

Editor's Notes

  • #7 http://demo.pentaho.com/pentaho/content/analyzer/help/topic.html?