Downloaded 103 times


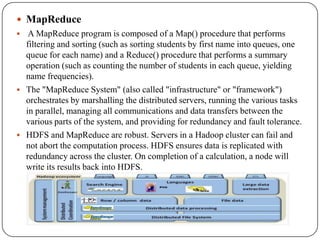

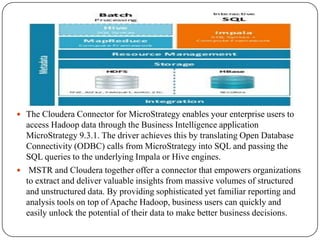


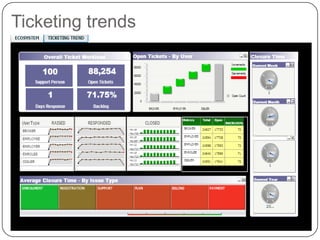


The document discusses the integration of Hadoop with MicroStrategy, highlighting Hadoop's capabilities in processing large data sets efficiently and its core components, such as HDFS and MapReduce. It explains the collaboration between Cloudera and MicroStrategy to create a BI framework that allows users to perform analytics on Hadoop data easily through the Cloudera connector. Additionally, it covers Impala for low-latency SQL queries on Hadoop and showcases applications and dashboards developed for healthcare management and ticketing trends, emphasizing the system's scalability and cost-effectiveness.